The Earth was 448.5 percent more abundant in 2021 than it was in 1980.
Gale L. Pooley, Marian L. Tupy —
Does population growth lead to greater resource scarcity, as argued by the English scholar Thomas Malthus and, more recently, by the Stanford University biologist Paul Ehrlich? Or does population growth coincide with, and perhaps even contribute to resource abundance, as the University of Maryland economist Julian Simon has argued? The Simon Abundance Index (SAI) measures the relationship between population growth and the abundance of 50 basic commodities, including food, energy, materials, minerals, and metals.
Main Findings
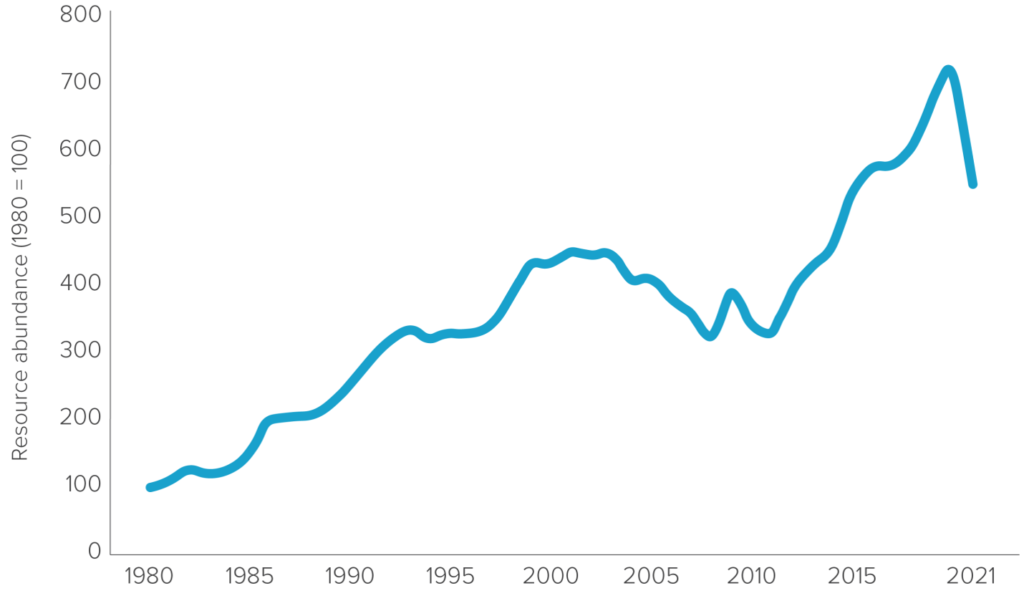
Global resource abundance fell by 22.6 percent in 2021, according to the fifth annual Simon Abundance Index. The base year of the index is 1980, and the base value of the index is 100. In 2021, the index stood at 548.5. In other words, the index rose by 448.5 percent over the last 41 years, implying a compound annual growth rate in global resource abundance of 4.24 percent and a doubling of global resource abundance every 16.7 years.
Figure 1: The Simon Abundance Index (1980–2021)
Analysis
The SAI is measured in time prices. To calculate a commodity’s time price, the nominal price of a commodity is divided by the global average nominal hourly wage. Over the last 41 years, the average nominal price of the 50 commodities rose by 103.9 percent, and the global average nominal hourly wage rose by 413.6 percent. So, the overall time price of the 50 commodities fell by 67.9 percent.
The personal resource abundance multiplier is calculated by dividing the average time price of the 50 commodities in 1980 by the average time price of the 50 commodities in 2021. The multiplier tells us how much more of a resource a person can get for the same hours of work between two points in time. The same number of hours of work that bought one unit in the basket of 50 commodities in 1980 bought 3.088 units in the same basket in 2021.
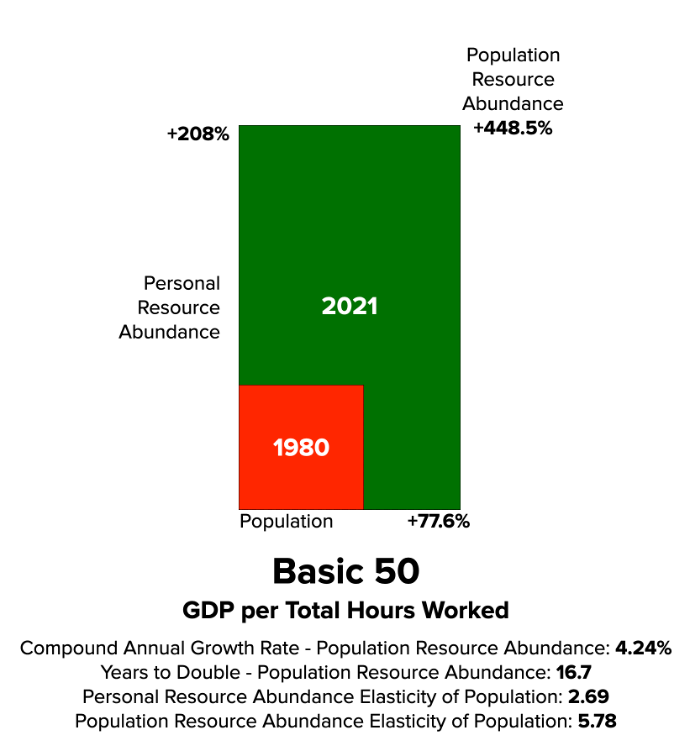
The resource abundance for the average inhabitant of the planet rose by 208.8 percent. The compound annual growth rate in personal resource abundance amounted to 2.79 percent, implying that personal resource abundance doubled every 25.2 years.
Over the last 41 years, the overall time price of the 50 commodities fell by 67.9 percent. Meanwhile, the world’s population increased by 77.6 percent. So, for every 1 percent increase in the world’s population, the average time price of the 50 commodities decreased by 0.88 percent (67.9 percent ÷ 77.6 percent = -0.88).
Note that the personal resource abundance analysis looks at resource abundance from the perspective of an individual human being. The question that we aim to answer is: “How much more abundant have resources become for the average inhabitant of the planet?”
Population resource abundance analysis, in contrast, allows us to quantify the relationship between global resource abundance and global population growth. You can think of the difference between the two levels of analysis by using a pizza analogy. Personal resource abundance measures the size of a slice of pizza per person. Population resource abundance measures the size of the entire pizza pie.
The population resource abundance multiplier is calculated by multiplying the change in personal resource abundance by the change in global population (3.088 x 1.776). The multiplier of 5.485 corresponds to the 548.5 value in the SAI 2022. It indicates an increase in the global resource abundance of 448.5 percent and a compound annual growth rate of 4.24 percent. Using these values, we can estimate that global resource abundance doubles every 16.7 years or so.
Figure 2: Visualization of the Relationship between Global Population Growth and Personal Resource Abundance of the 50 Basic Commodities (1980–2021)
Finally, let us say a few words about the resource abundance elasticity of population. In economics, elasticity measures one variable’s sensitivity to a change in another variable. If variable X changes by 10 percent, while variable Y, as a result of the change in X, changes by 5 percent, then the elasticity coefficient of X relative to Y is 2.0 (10 ÷ 5). A coefficient of 2.0 can be interpreted as a 2 percent change in X corresponding to a 1 percent change in Y.
We found that every 1 percent increase in population corresponded to an increase in personal resource abundance (the size of the slice of pizza) of 2.69 percent (208.8 ÷ 77.6). We also found that every 1 percent increase in population corresponded to an increase in population resource abundance (the size of the pizza pie) of 5.8 percent (448.5 ÷ 77.6).
Changes between 2020 and 2021
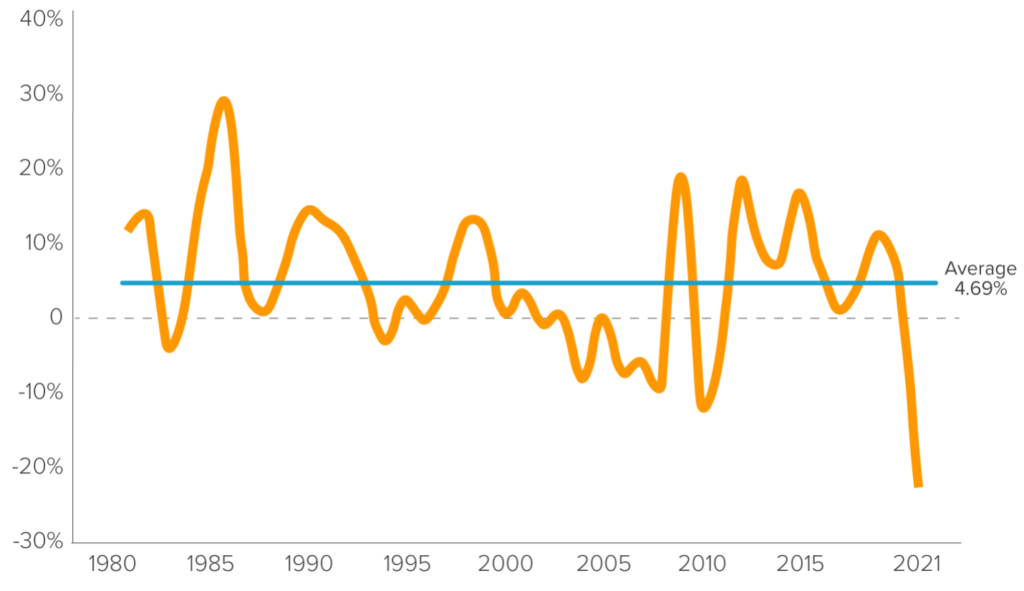
Over the last 12 months, the SAI declined from 708.4 to 548.5 (22.6 percent). This was the largest one-year drop recorded by the index. The largest previous one-year drop amounted to 11.3 percent in 2010. On average, the index increased by 4.69 percent a year between 1980 and 2021.
Figure 3: The Simon Abundance Index, Annual Percentage Change (1980–2021)
What accounts for the SAI decline between 2020 and 2021? First, although the long-term trend in resource abundance is a positive one, prices can and do move up as well as down. Julian Simon noted as much when he wrote in his 1996 book The Ultimate Resource 2,
There is no physical or economic reason why human resourcefulness and enterprise cannot forever continue to respond to impending shortages and existing problems with new expedients that, after an adjustment period, leave us better off than before the problem arose. . . . Adding more people will cause [short‐run] problems, but at the same time there will be more people to solve these problems and leave us with the bonus of lower costs and less scarcity in the long run. . . . The ultimate resource is people—skilled, spirited, and hopeful people who will exert their wills and imaginations for their own benefit, and so, inevitably, for the benefit of us all.
Second, prices and wages can be adversely affected by government policy. The COVID-19 pandemic–related restrictions on economic activity, for example, resulted in a supply shock from which many an industry is yet to fully recover. The supply shock was exacerbated by fiscal and monetary stimuli, which kept some workers from reentering the job market once the restrictions were lifted. These stimuli also resulted in a demand shock, with money flowing into real estate, the stock market, and commodities as savers attempted to protect themselves from rising inflation. Additional regulations on new resource exploration and production may have helped to reduce output, particularly in the energy sector. Finally, the spike in resource prices was greatly enhanced by the Russian invasion of Ukraine (although the conflict is not reflected in this year’s SAI).
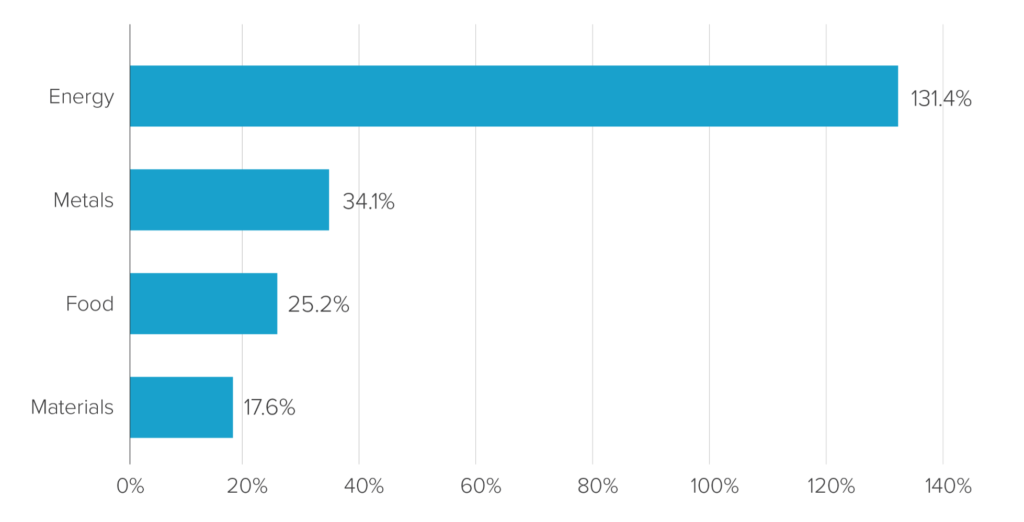
Figure 4: The Simon Abundance Index, Percentage Change in Time Prices of the Main Resource Groups (2020–2021)
Third, humanity has experienced similar shocks and accompanying reductions in resource abundance before. Mercifully, history suggests that growth in the abundance of resources can be restored. The index, for example, grew by 28.4 percent, 20.0 percent, and 19.3 percent in 1986, 1985, and 2009, respectively. When government policies and proper monetary management encourage entrepreneurship, the discovery of new knowledge and creation of new wealth can return and flourish.
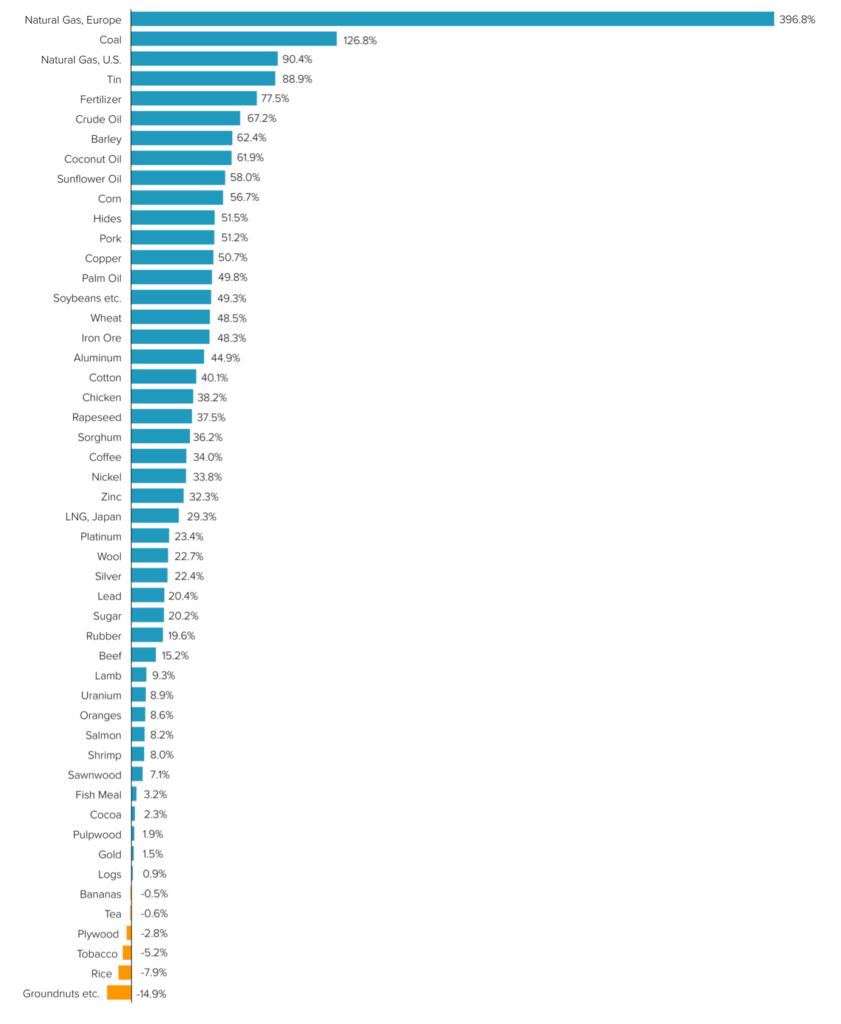
Figure 5: The Simon Abundance Index, Percentage Change in Time Prices of Individual Resources (2020–2021)
Summary: For decades, experts assumed that rising prosperity inevitably led to falling birth rates, fueling concerns about population collapse in wealthy societies. But new data show that this link is weakening or even reversing, with many high-income countries now seeing higher fertility than some middle-income nations. As research reveals that wealth and fertility can rise together, policymakers have an opportunity to rethink outdated assumptions about tradeoffs between prosperity and demographic decline.
For years, it was treated as a demographic law: as countries grow wealthier, they have fewer children. Prosperity, it was believed, inevitably drove birth rates down. This assumption shaped countless forecasts about the future of the global population.
And in many wealthy countries, such as South Korea and Italy, very low fertility rates persist. But a growing body of research is challenging the idea that rising prosperity always suppresses fertility.
University of Pennsylvania economist Jesús Fernández-Villaverde recently observed that middle-income countries are now experiencing lower total fertility rates than many advanced economies ever have. His latest work shows that Thailand and Colombia each have fertility rates around 1.0 births per woman, which is even lower than rates in well-known low-fertility advanced economies such as Japan, Spain and Italy.
“My conjecture is that by 2060 or so, we might see rich economies as a group with higher [total fertility rates] than emerging economies,” Fernández-Villaverde predicts.
This changing relationship between prosperity and fertility is already apparent in Europe. For many years, wealthier European countries tended to have lower birth rates than poorer ones. That pattern weakened around 2017, and by 2021 it had flipped.
This change fits a broader historical pattern. Before the Industrial Revolution, wealthier families generally had more children. The idea that prosperity leads to smaller families is a modern development. Now, in many advanced economies, that trend is weakening or reversing. The way that prosperity influences fertility is changing yet again. Wealth and family size are no longer pulling in opposite directions.
This shift also calls into question long-standing assumptions about women’s income and fertility. For years, many economists thought that higher salaries discouraged women from having children by raising the opportunity cost of taking time off work. That no longer seems to hold in many countries.
In several high-income nations, rising female earnings are now associated with higher fertility. Studies in Italy and the Netherlands show that couples where both partners earn well are more likely to have children, while low-income couples are the least likely to do so. Similar findings have emerged from Sweden as well. In Norway, too, higher-earning women now tend to have more babies.
This trend is not limited to Europe. In the United States, richer families are also beginning to have more babies than poorer ones, reversing patterns observed in previous decades. A study of seven countries — including the United States, the United Kingdom, Germany and Australia — found that in every case, higher incomes for both men and women increased the chances of having a child.
This growing body of evidence challenges the assumption that prosperity causes people to have fewer children.
Still, birth rates are falling across much of the world, with many countries now below replacement level. While this trend raises serious concerns, such as the risk of an aging and less innovative population and widening gaps in public pension solvency, it is heartening that it is not driven by prosperity itself. Wealth does not automatically lead to fewer children, and theories blaming consumerism or rising living standards no longer hold up.
Although the recent shift in the relationship between prosperity and fertility is welcome, it is not yet enough to raise fertility to the replacement rate of around 2.1 children per woman — a challenging threshold to reach.
But the growing number of policymakers around the world concerned about falling fertility can consider many simple, freedom-enhancing reforms that lower barriers to raising a family, including reforms to education, housing and childcare. Still, it’s important to challenge the common assumption that prosperity inevitably leads to lower birth rates: Wealth does not always mean fewer children.
This article was published at The Hill on 6/16/2025.
Americans in Their 80s and 90s Are Redefining Old Age
“For a growing number of Americans, old age has undergone a profound transformation. Many are living to advanced ages in good health, with some even demonstrating improvements with the passing years.
A long-running study of older people in the greater New Haven, Conn., area found that most who had lost the ability to feed or bathe themselves recovered within six months, and often sooner. The Einstein Aging Study, which has followed people 70 or older from the Bronx since 1993, discovered a declining rate of dementia in successive age cohorts born after 1929.
According to research at the Stanford Center on Longevity, older Americans report higher levels of emotional well-being and lower levels of negative emotions compared with young adults.”
Global Suicide Rate Dropped Significantly Since 2000
“Between 2000 and 2021, the global age-standardized suicide rate dropped by 35%. The decreases varied by WHO region: 3% in Africa, 26% in South-East Asia, 30% in the Eastern Mediterranean, 48% in Europe and 50% in the Western Pacific (Fig. 10). The only region with an increase was the Americas, where the age-standardized suicide rate rose by 17% in the same time period. The global rate also decreased for age-group specific suicide rates (i.e. 15-29 years, 30-49 years, 50-69 years, and 70+ years) in the same time period.”
More People, More Food: Why Ehrlich and Thanos Got It Wrong
Compared to 1900, we have 8.28 million fewer farmers today with 263.7 million more people. And we live 30 years longer.
Gale L. Pooley —
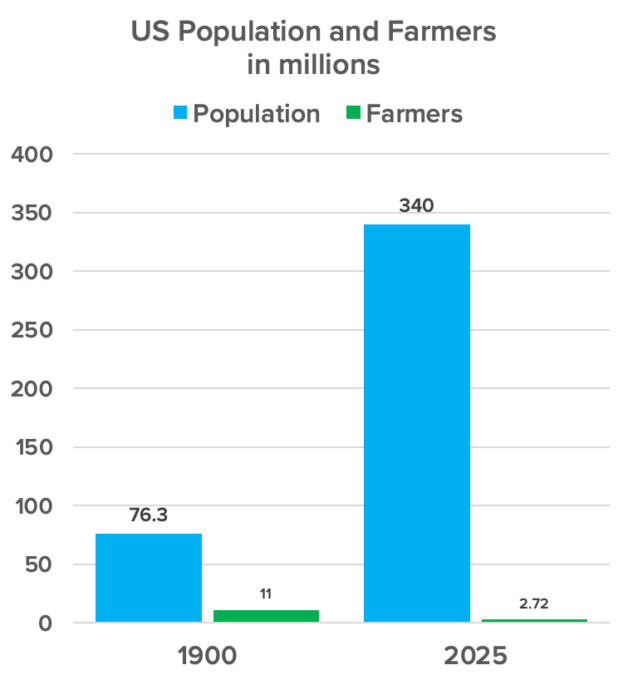
In 1900, the U.S. Census recorded a total population of 76.3 million, including 11 million farmers. Today, with a population nearing 340 million, the number of farmers has dropped to just 2.72 million.
At the turn of the century, each farmer fed 6.94 people. Today, that number has risen to 125. While the U.S. population grew by 346 percent, farmer productivity soared by 1,702 percent. Each one percent increase in population corresponded to a 4.92 percent increase in farmer productivity.
In 1900, life expectancy was just 47 years. Today, it’s around 77. Medicine and sanitation played a role, but the abundance of food made possible by farmers discovering and applying new knowledge was a foundational driver of that gain.
So, who’s going to tell Ehrlich and Thanos they had it backwards? More life discovers more knowledge, which leads to better tools and more abundant resources.
Find more of Gale’s work at his Substack, Gale Winds.