fbpx
01 / 04
Food Prices from the U.S. Unskilled Worker Perspective (1919-2019)

Blog Post | Food & Hunger

Food Prices from the U.S. Unskilled Worker Perspective (1919-2019)

The time price of our basket of 42 food items fell from 47 hours of work in 1919 to ten hours in 2019.

On March 9, 2019, Congresswoman Alexandria Ocasio-Cortez (D-NY) argued that “Capitalism is irredeemable,” because “people can’t afford to live.” Is that true? The cost of living isn’t easy to calculate. The declining cost of home appliances, for example, needs to be juxtaposed with the growing cost of healthcare, etc. Here we focus on an expense that’s intimately tied up with the very survival of human beings – the cost of food.1 Throughout history, people lived in a state of undernourishment. Yet in developed countries today, obesity is a growing problem. The declining cost of food is partly responsible for that reversal.

Our analysis begins with the 1919 nominal prices of 42 food items, ranging from a pound of sirloin steak to a dozen oranges.2We then express those nominal (i.e., 1919) prices in terms of hours of work.3 The “time price” of a food item in 1919, in other words, denotes the length of time that an unskilled worker had to work to earn enough money to buy that same item in 1919. We then look at the 2019 prices of the same food items (including, of course, the same quantity of those foods).4 We then express those nominal (i.e., 2019) prices in terms of hours of work.5 The time price of a food item in 2019, therefore, denotes the amount of time that an unskilled worker had to work to earn enough money to buy that same item in 2019.

We find that the unweighted average time price of our 42 food items fell by 79 percent between 1919 and 2019. The total time price (i.e., the nominal price divided by the nominal hourly wage) of our basket of 42 food items fell from 47 hours of work in 1919 to ten hours in 2019.


1 Written by Gale L. Pooley and Marian L. Tupy, co-authors of The Simon Project – an initiative of humanprogress.wpengine.com.

2 See Retail Prices, 1913 to December 1919: Bulletin of the United States Bureau of Labor Statistics, No. 270, pages 176-183.

3 The hourly wage of unskilled workers, which we derived from www.measuringworth.com, amounted to $0.25 per hour in 1919.

4 The 2019 nominal prices come from www.walmart.com.

5 According to our calculations based on data from www.measuringworth.com, the nominal wage rate of unskilled workers amounted to about $12.70 per hour in 2019.


Blog Post | Cost of Living

Even with Gas Prices at Historic High, Your Time Takes You Farther

You can drive 62 percent farther for your time today than in 1980.

Summary: Although nominal gas prices recently reached historic highs, your time can get you further than ever before. As this article explains, the time price of gasoline has decreased by 4 percent since 1980, and the time price per mile driven has fallen by 38 percent.


The top-selling car in 1980 was the Oldsmobile Cutlass. Gas mileage on this vehicle averaged 20 miles per gallon (17 city/23 highway). By 2022, the Honda CR-V claimed that title. The CR-V reported mileage at 31 miles per gallon (28 city/34 highway). This represents an increase of 55 percent over this 41-year period. Mileage has been increasing at a compound rate of around 1 percent a year.

Back in 1980, gasoline was selling for $1.19 per gallon and blue-collar hourly compensation (wages and benefits) averaged $9.12 per hour. This indicates a time price rate of 7.83 minutes per gallon. Today, gasoline is selling for around $4.18 per gallon and blue-collar hourly compensation is up to $33.39 per hour, indicating a rate of around 7.51 minutes per gallon. While the nominal price of a gallon of gasoline has increased by 251 percent, the time price has actually dropped by 4 percent.

But how much does it cost to travel one mile? That depends on the time price of gasoline and the car’s mileage. In 1980, at 20 miles per gallon, the time price per mile on the Cutlass would have been 23.5 seconds. By 2022, with the CR-V getting 31 miles per gallon, the time price per mile would be around 14.5 seconds. The time price per mile has decreased by 38 percent.

You can look at mileage from the perspective of how many miles you earn per minute of work time. The 1980 Cutlass would have given you 2.55 miles per minute of your time, while the 2022 CR-V gives you 4.13 miles. Gas mileage abundance, from your time perspective, has increased by 62 percent.

There are other differences to consider. NADAguides, a website that values automobiles and other transportation equipment, reports that the price of a new Cutlass in 1980 was $6,735. At $9.12 per hour, it would have taken a blue-collar worker 738 hours to own this new car. Today the CR-V is retailing for around $28,334. At $33.39 per hour, it would take the worker 849 hours to buy one. So, while the time price of the top-selling car has increased by 15 percent, the mileage, safety, reliability, and comfort have all increased by much more.

Yes, nominal gas prices are at historic highs, but it’s not the money that counts, it’s your time. Time prices are the true prices.

Blog Post | Food Prices

Food Prices from the U.S. Blue-Collar Worker Perspective (1919-2019)

The time price of our basket of 42 food items fell from 27.26 hours of work in 1919 to 3.85 hours in 2019.

On March 9, 2019, Congresswoman Alexandria Ocasio-Cortez (D-NY) argued that “Capitalism is irredeemable,” because “people can’t afford to live.” Is that true? The cost of living isn’t easy to calculate. The declining cost of home appliances, for example, needs to be juxtaposed with the growing cost of healthcare, etc. Here we focus on an expense that’s intimately tied up with the very survival of human beings – the cost of food.1 Throughout history, people lived in a state of undernourishment. Yet in developed countries today, obesity is a growing problem. The declining cost of food is partly responsible for that reversal.

Our analysis begins with the 1919 nominal prices of 42 food items, ranging from a pound of sirloin steak to a dozen oranges.2We then express those nominal (i.e., 1919) prices in terms of hours of work.3 The “time price” of a food item in 1919, in other words, denotes the length of time that a blue-collar worker had to work to earn enough money to buy that same item in 1919. We then look at the 2019 prices of the same food items (including, of course, the same quantity of those foods).4 We then express those nominal (i.e., 2019) prices in terms of hours of work.5 The time price of a food item in 2019, therefore, denotes the amount of time that a blue-collar worker had to work to earn enough money to buy that same item in 2019.

We find that the unweighted average time price of our 42 food items fell by 87 percent between 1919 and 2019. The total time price (i.e., the nominal price divided by the nominal hourly wage) of our basket of 42 food items fell from 27.26 hours of work in 1919 to 3.85 hours in 2019.


1 Written by Gale L. Pooley and Marian L. Tupy, co-authors of The Simon Project – an initiative of humanprogress.wpengine.com.

2 See Retail Prices, 1913 to December 1919: Bulletin of the United States Bureau of Labor Statistics, No. 270, pages 176-183.

3 The hourly wage of blue-collar workers, which we derived from www.measuringworth.com, amounted to $0.43 per hour in 1919.

4 The 2019 nominal prices come from www.walmart.com.

5 According to our calculations based on data from www.measuringworth.com, the nominal wage rate of blue-collar workers amounted to about $34.33 per hour in 2019.


Blog Post | Personal Income

Are Americans Really Worse off Than in the 1970s?

Populism feeds on myths about living standards that simply don't stand up to scrutiny.

Back in May, a young American called Akki caused a minor twitterstorm by seemingly showing what many pundits in the U.S. media frequently assert – that ordinary Americans are worse off today than they were in the late 1970s. A number of better educated twitterati soon pointed out that Akki, a self-declared member of #TheResistance, engaged in what former U.S. President George W. Bush once referred to as “fuzzy math.” In the meantime, Akki’s misleading claim scored over 197,000 likes on Twitter. It seems that in addition to the U.S. dollar, Americans have come to crave a new kind of currency: victimhood. Many Americans of all political persuasions relish the feeling of aggrievement and the accompanying sense of moral superiority, and if that means that they have to pretend that their lives are worse than those of their ancestors, so be it.

Per Akki, a loaf of bread in 1977 cost $0.32. In May 2019, it cost $1.98. In the meantime, the median income per person, Akki also claimed, remained the same. Ergo, Americans were worse off in 2019 than they were in 1977. The data from the Federal Reserve Bank of St. Louis, the most authoritative of sources, tells a somewhat different story. The real median income per person in 1977 came to $23,202. It stood at $31,099 in 2016 (the last year for which data are available). Both figures are in 2017 dollars. So, an American in the middle of the income spectrum was about $7,897 (or 34 percent) better off in 2016 than he or she would have been in 1977. And that’s not counting the increase in non-wage benefits that, due to the quirks of the U.S. tax code, continue to expand. As for the price of bread, Akki’s $0.32 would amount to $1.36 today. Target sells a loaf of bread for $1.09.

Thanks to Akki and many other misinformed people on both sides of the political spectrum, a myth of stagnating American standards of living has arisen and continues to spread. According to South Bend mayor and 2020 Democratic presidential hopeful Pete Buttigieg, the supposed stagnation started with the election of Ronald Reagan to the U.S. presidency in 1980. But, of course! “What we’ve seen is that the rising tide rose, right? GDP went up. Growth went up. Productivity went up — big numbers went up and most of our boats didn’t budge. For 90 percent of Americans, you start the clock right around the time I’m born [1982]. Income didn’t move at all — so lower to middle income, really, almost all of us,” Buttigieg said.

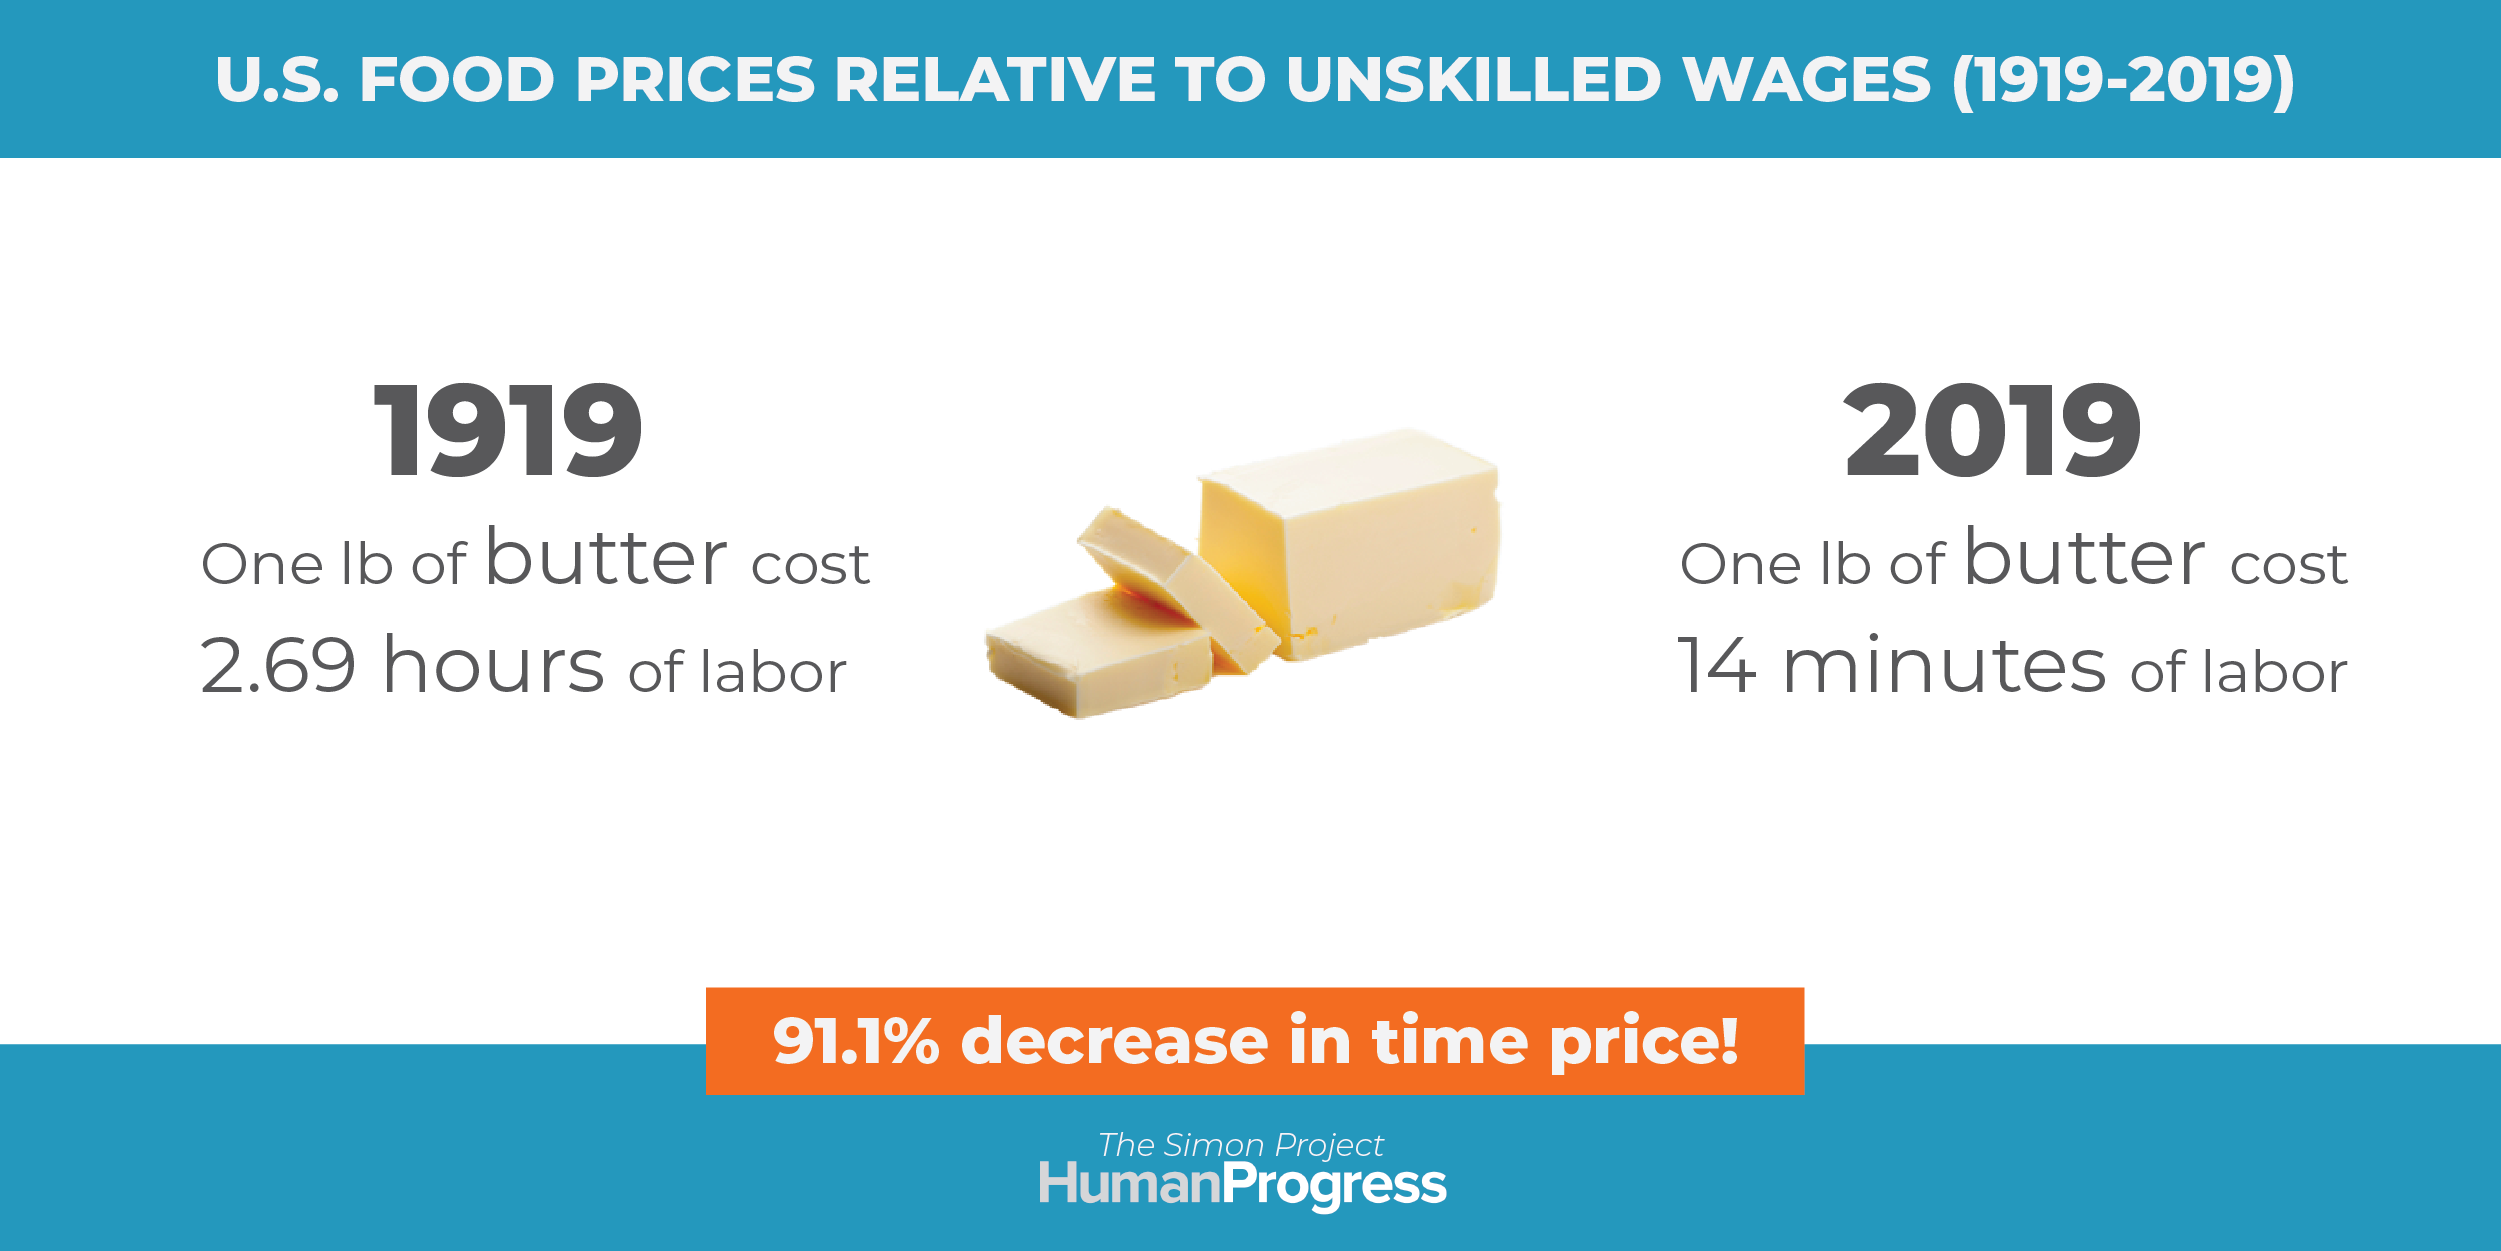
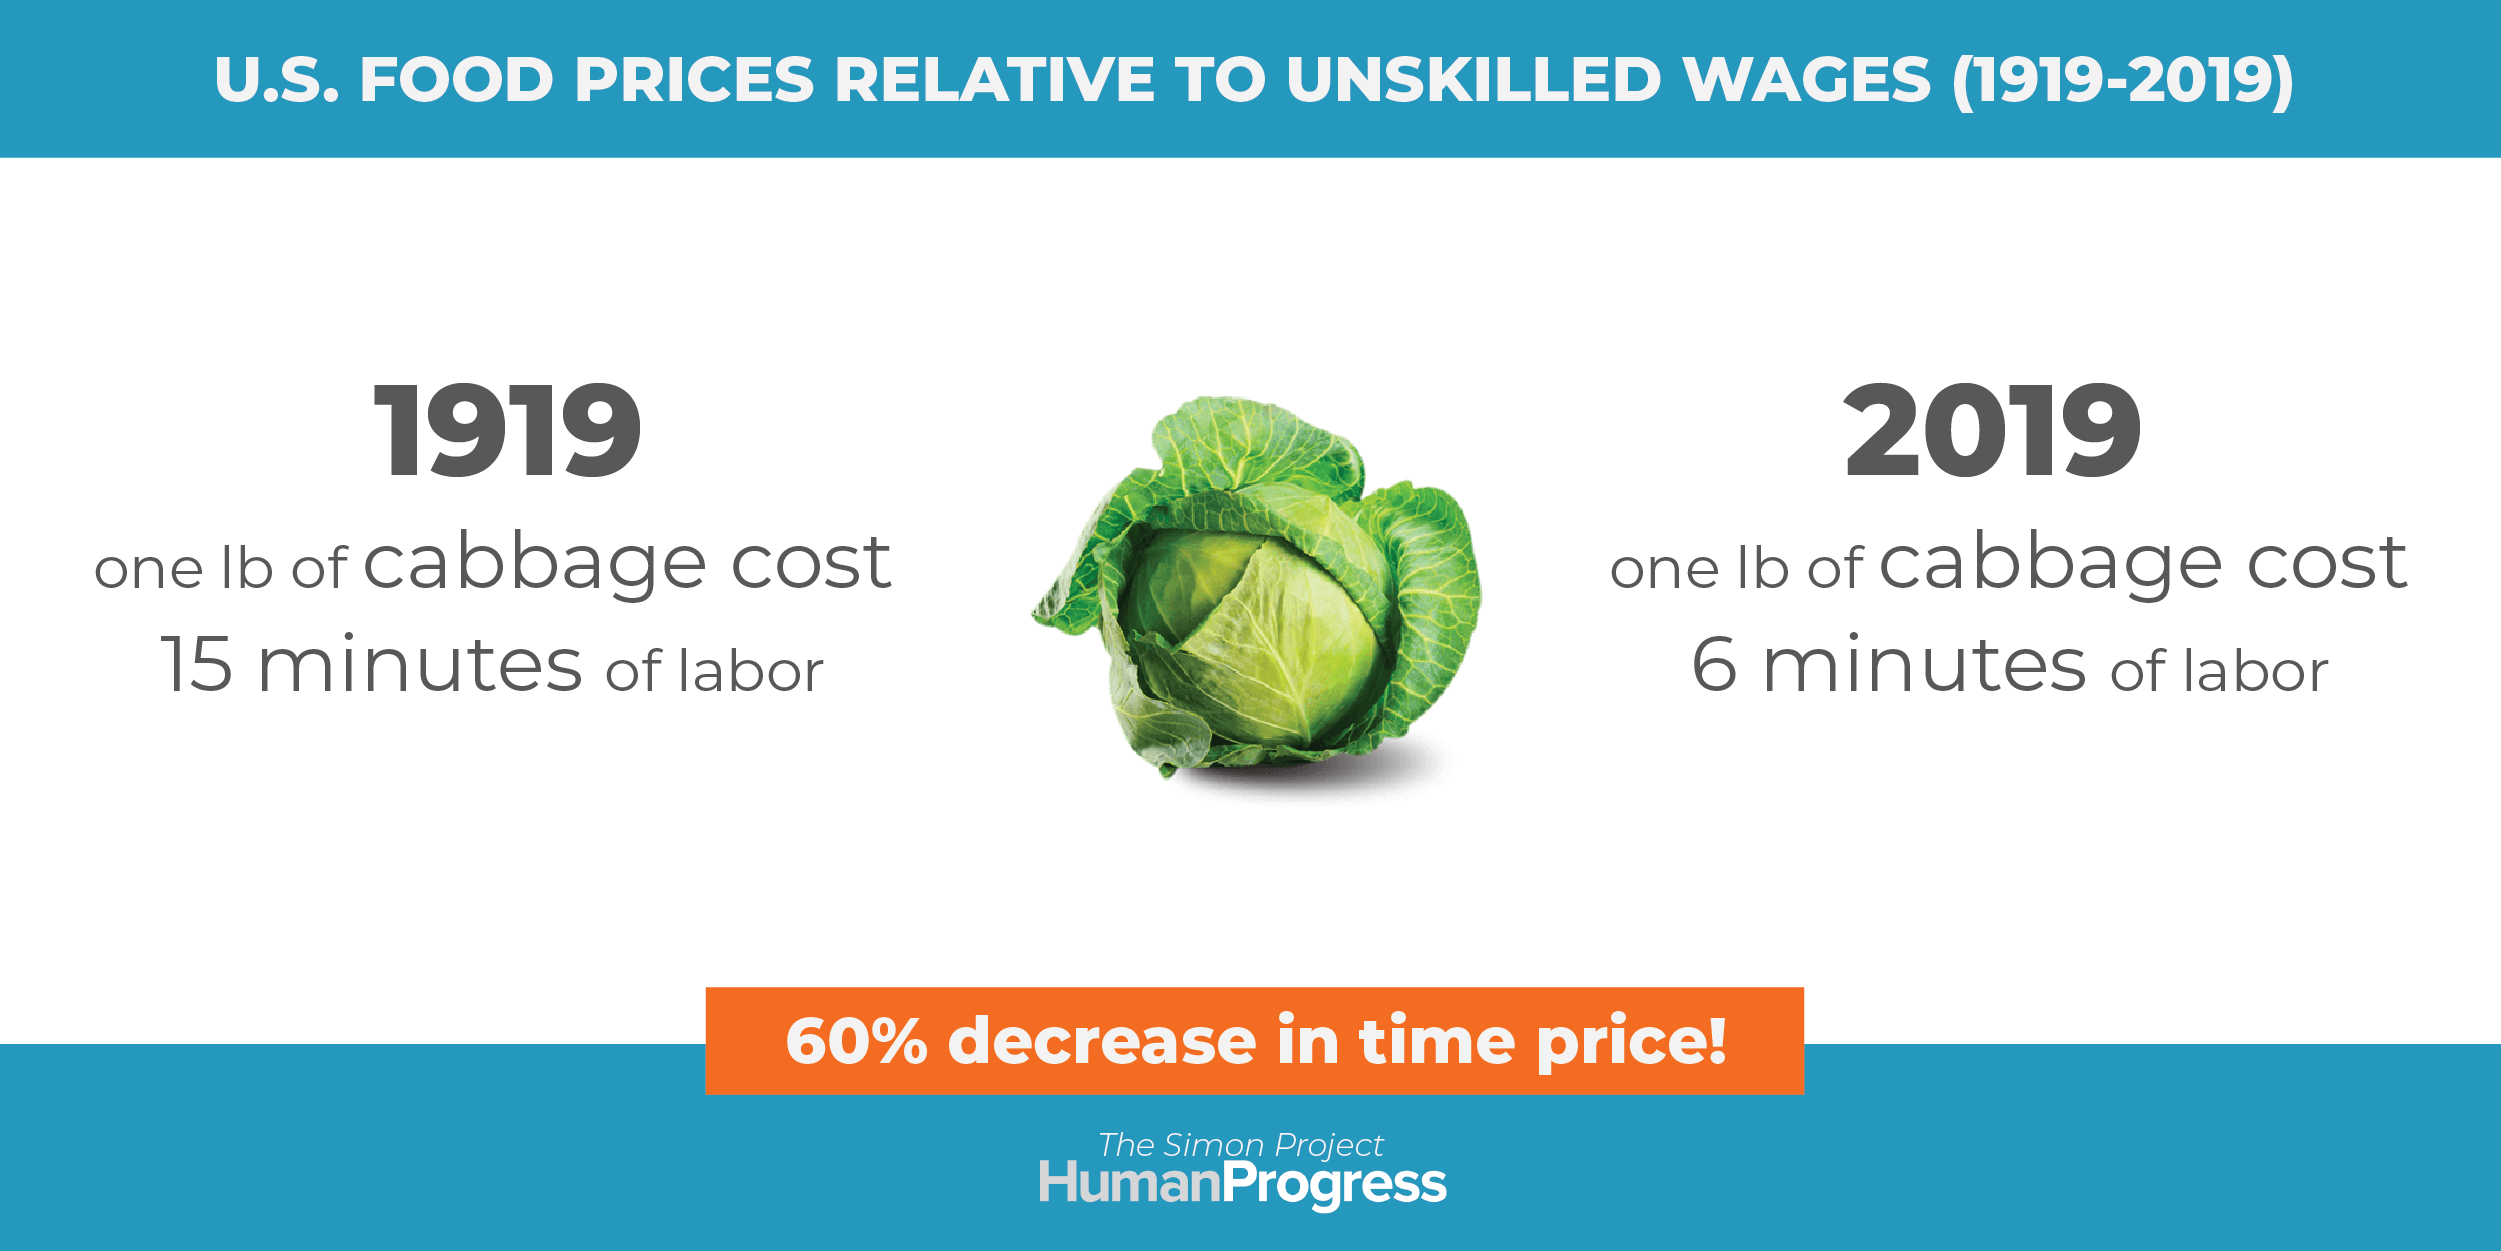
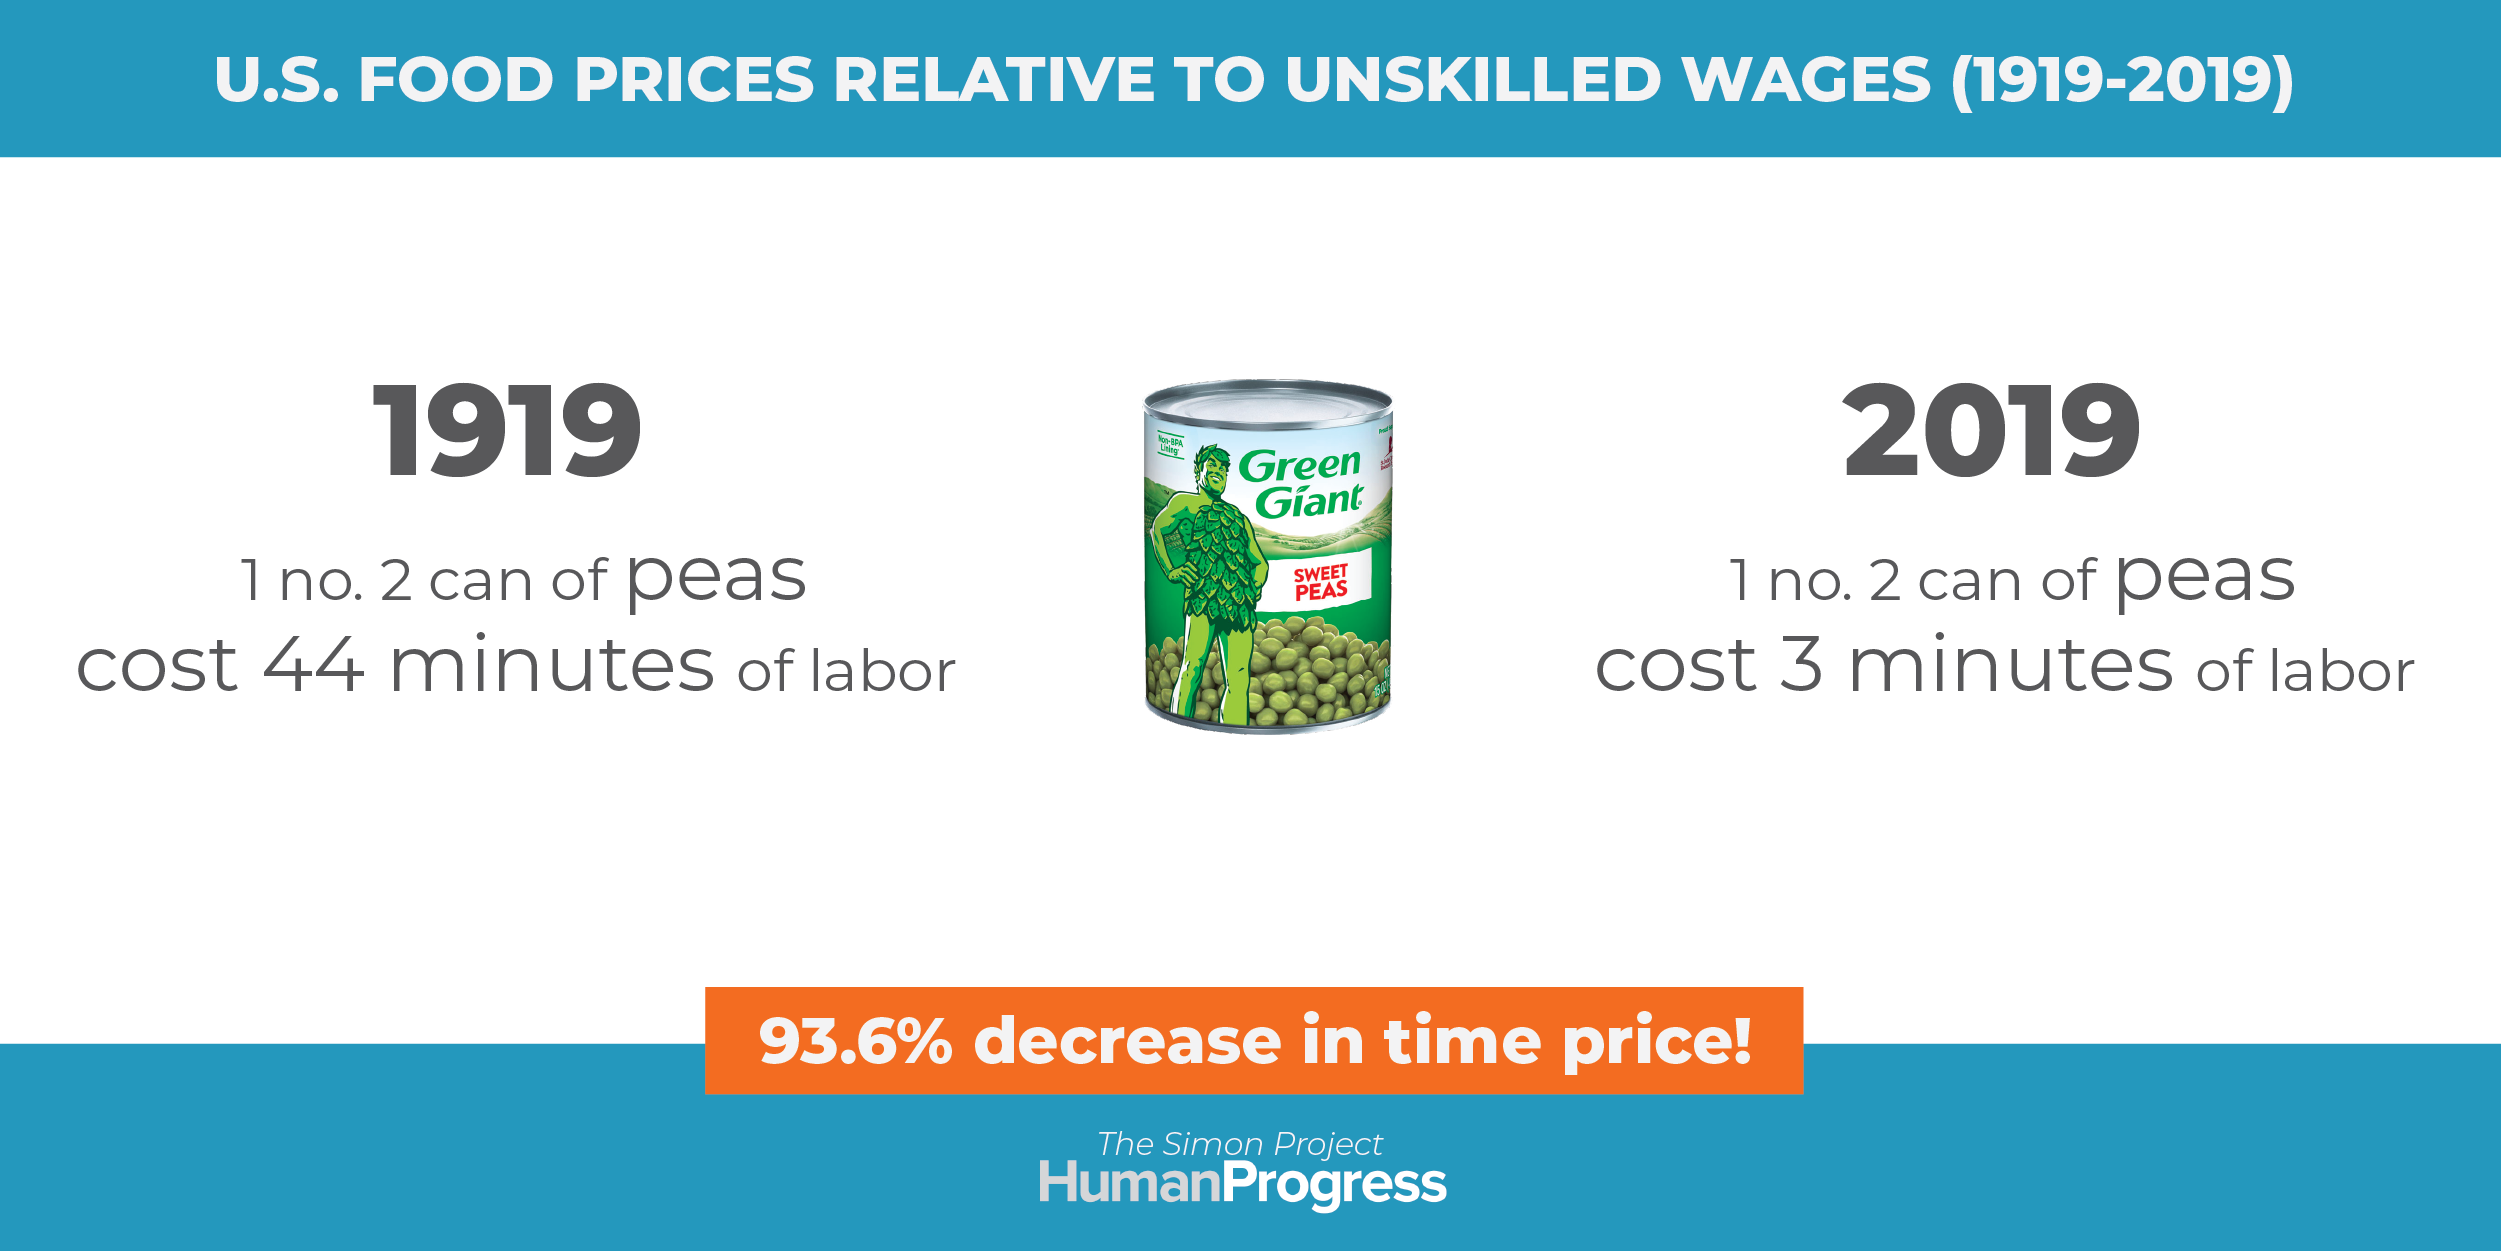
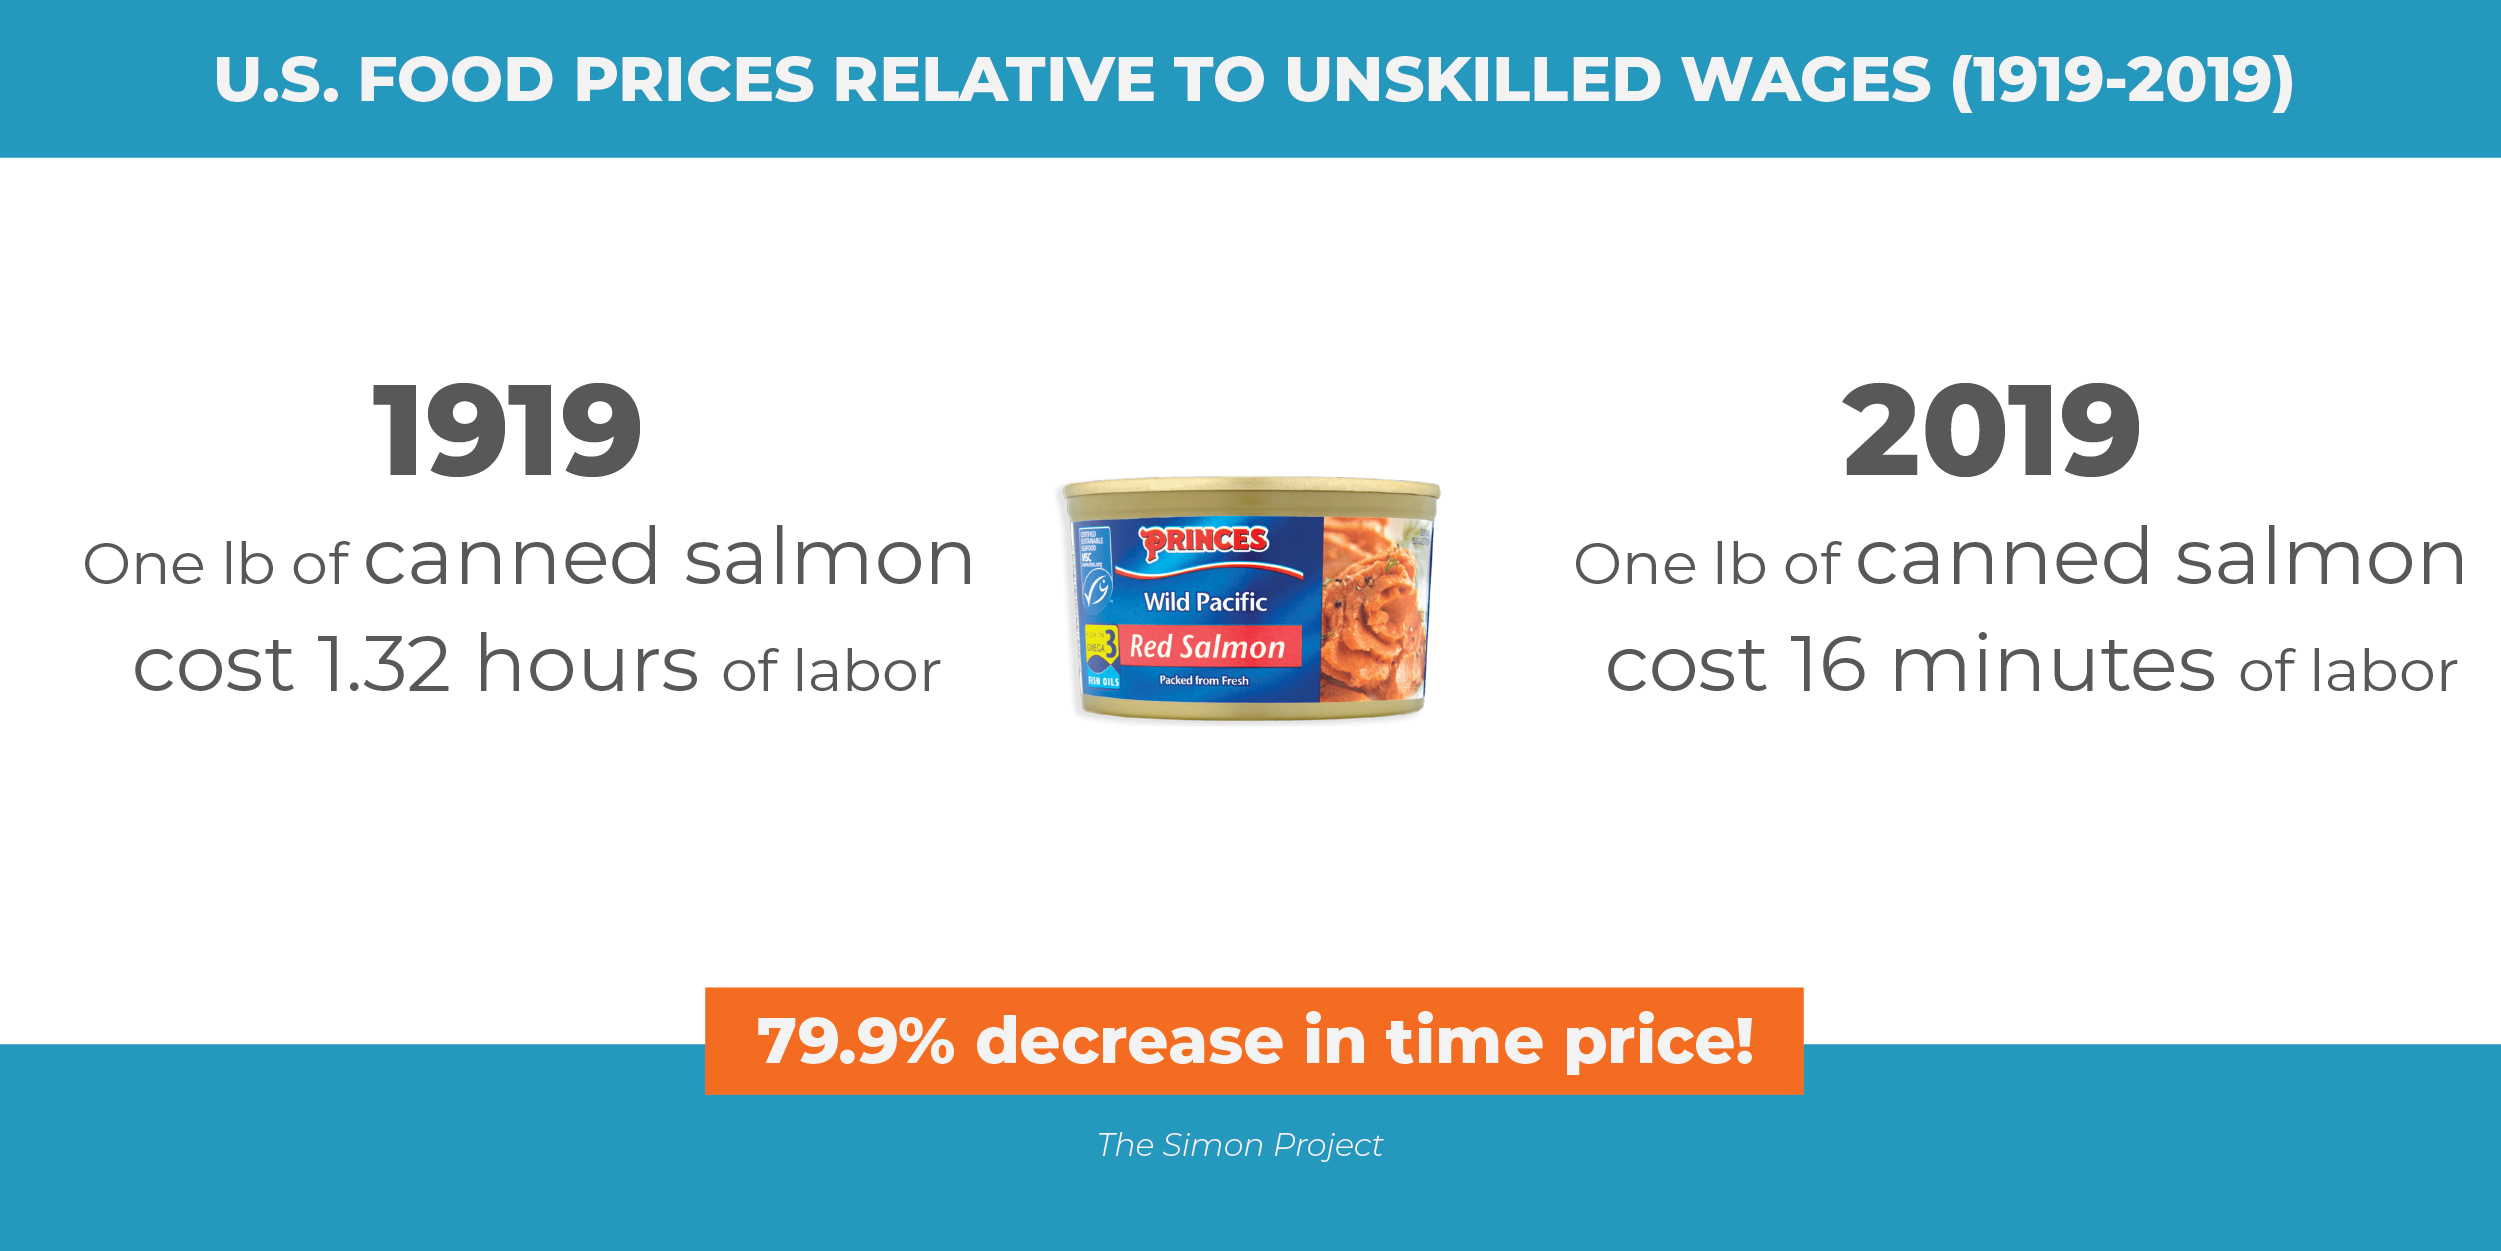
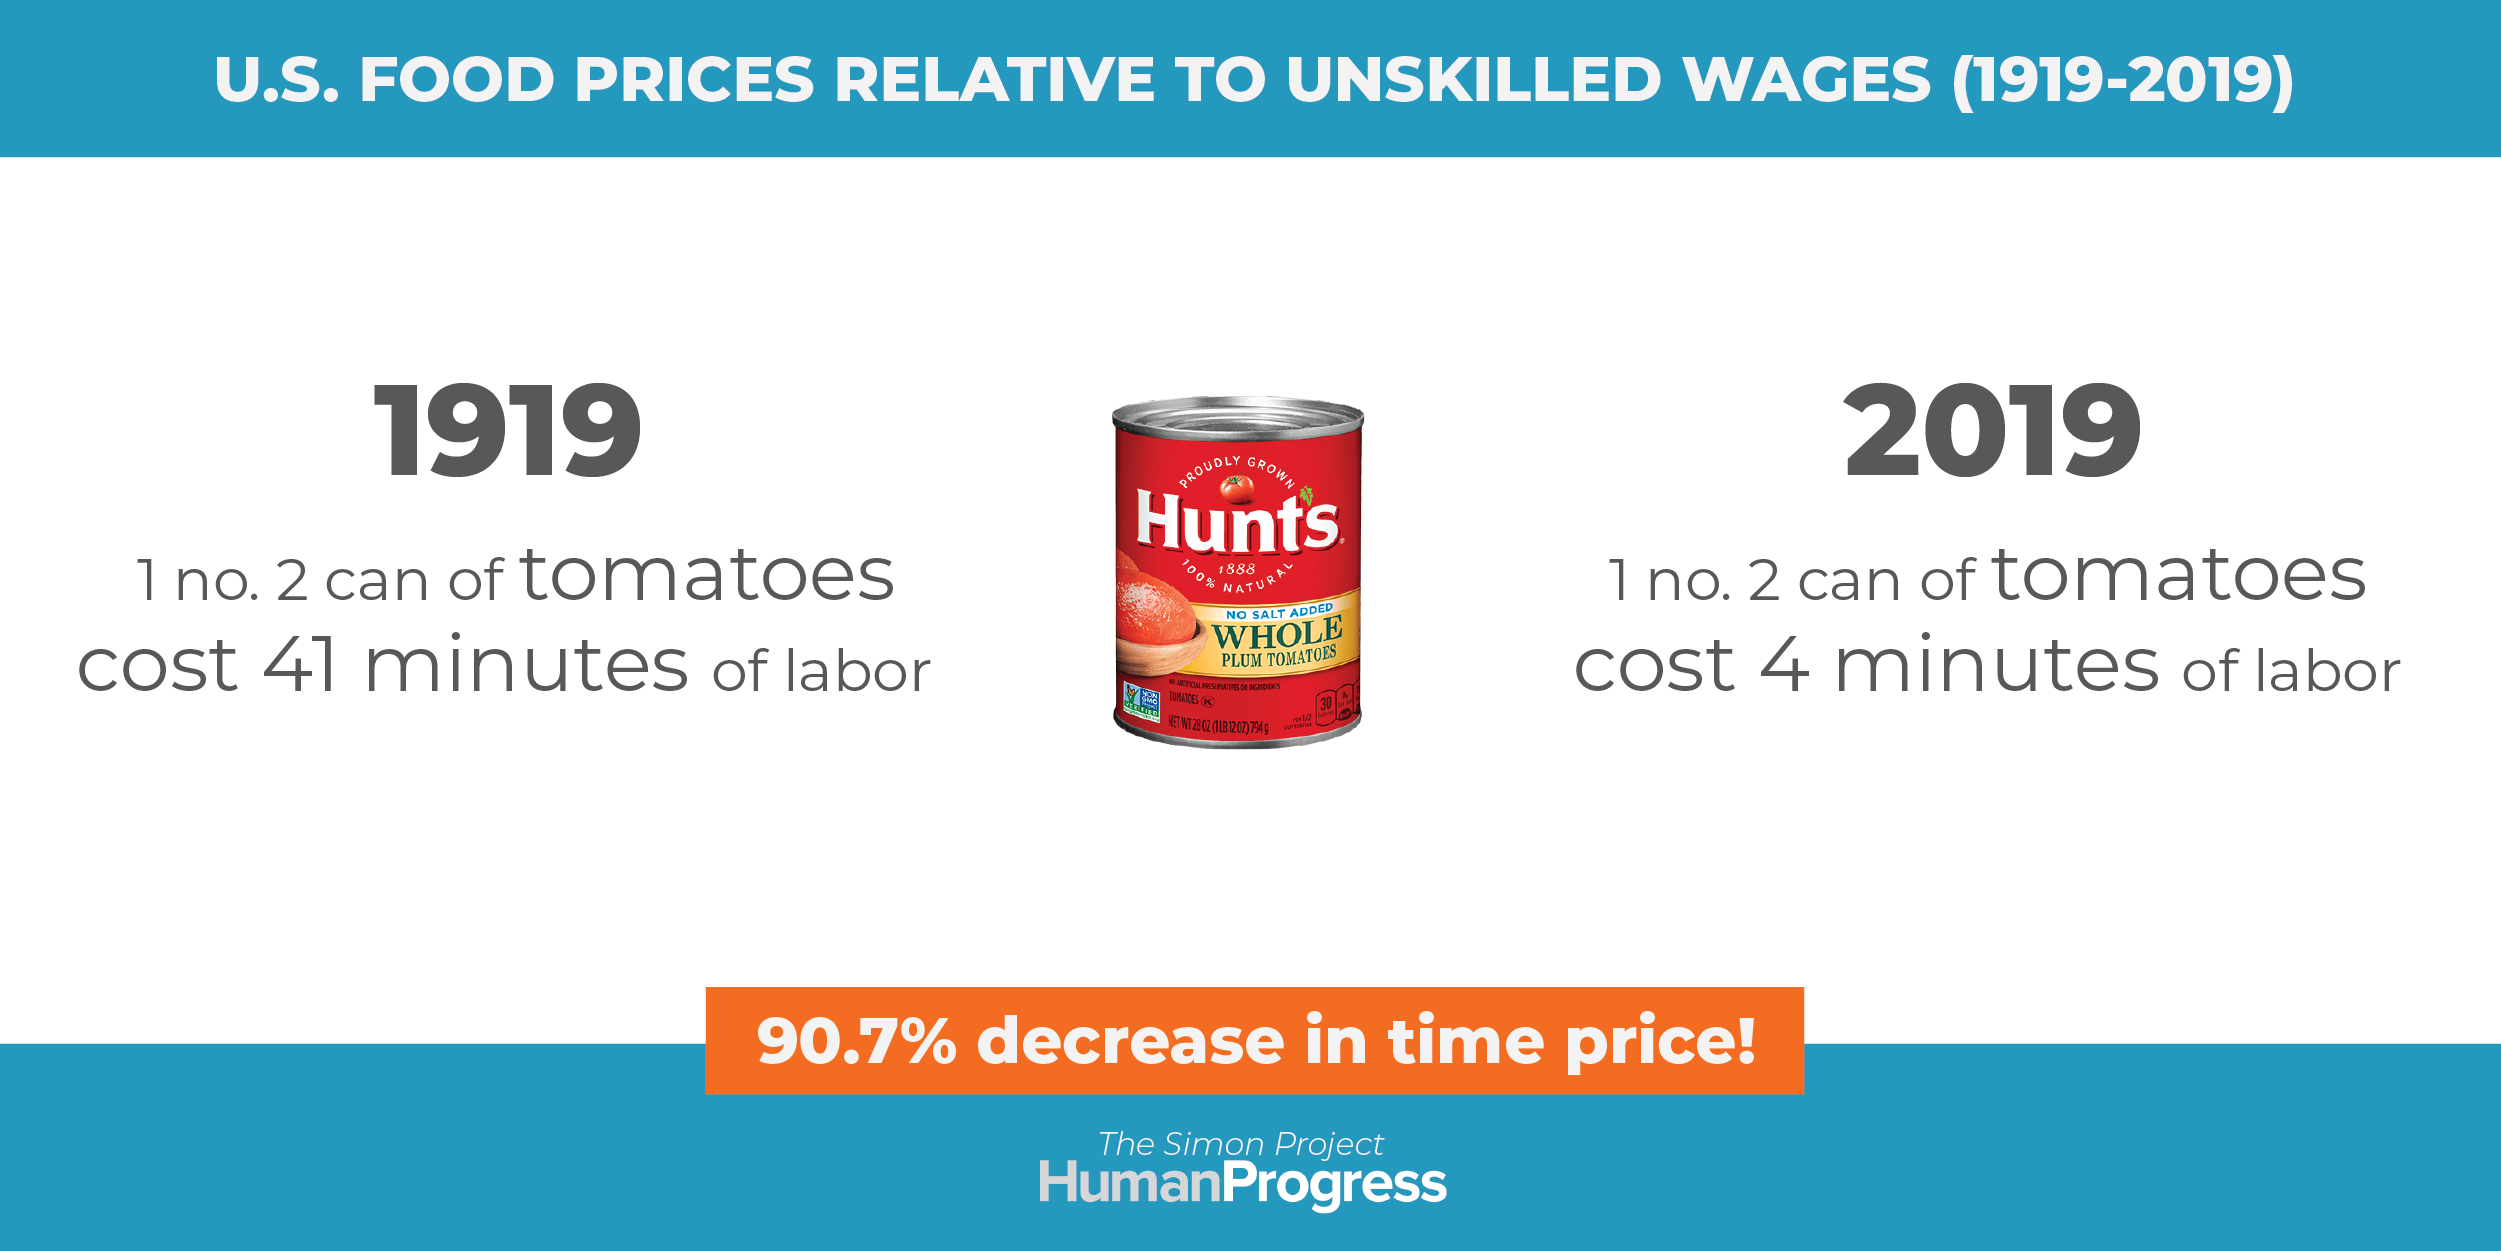
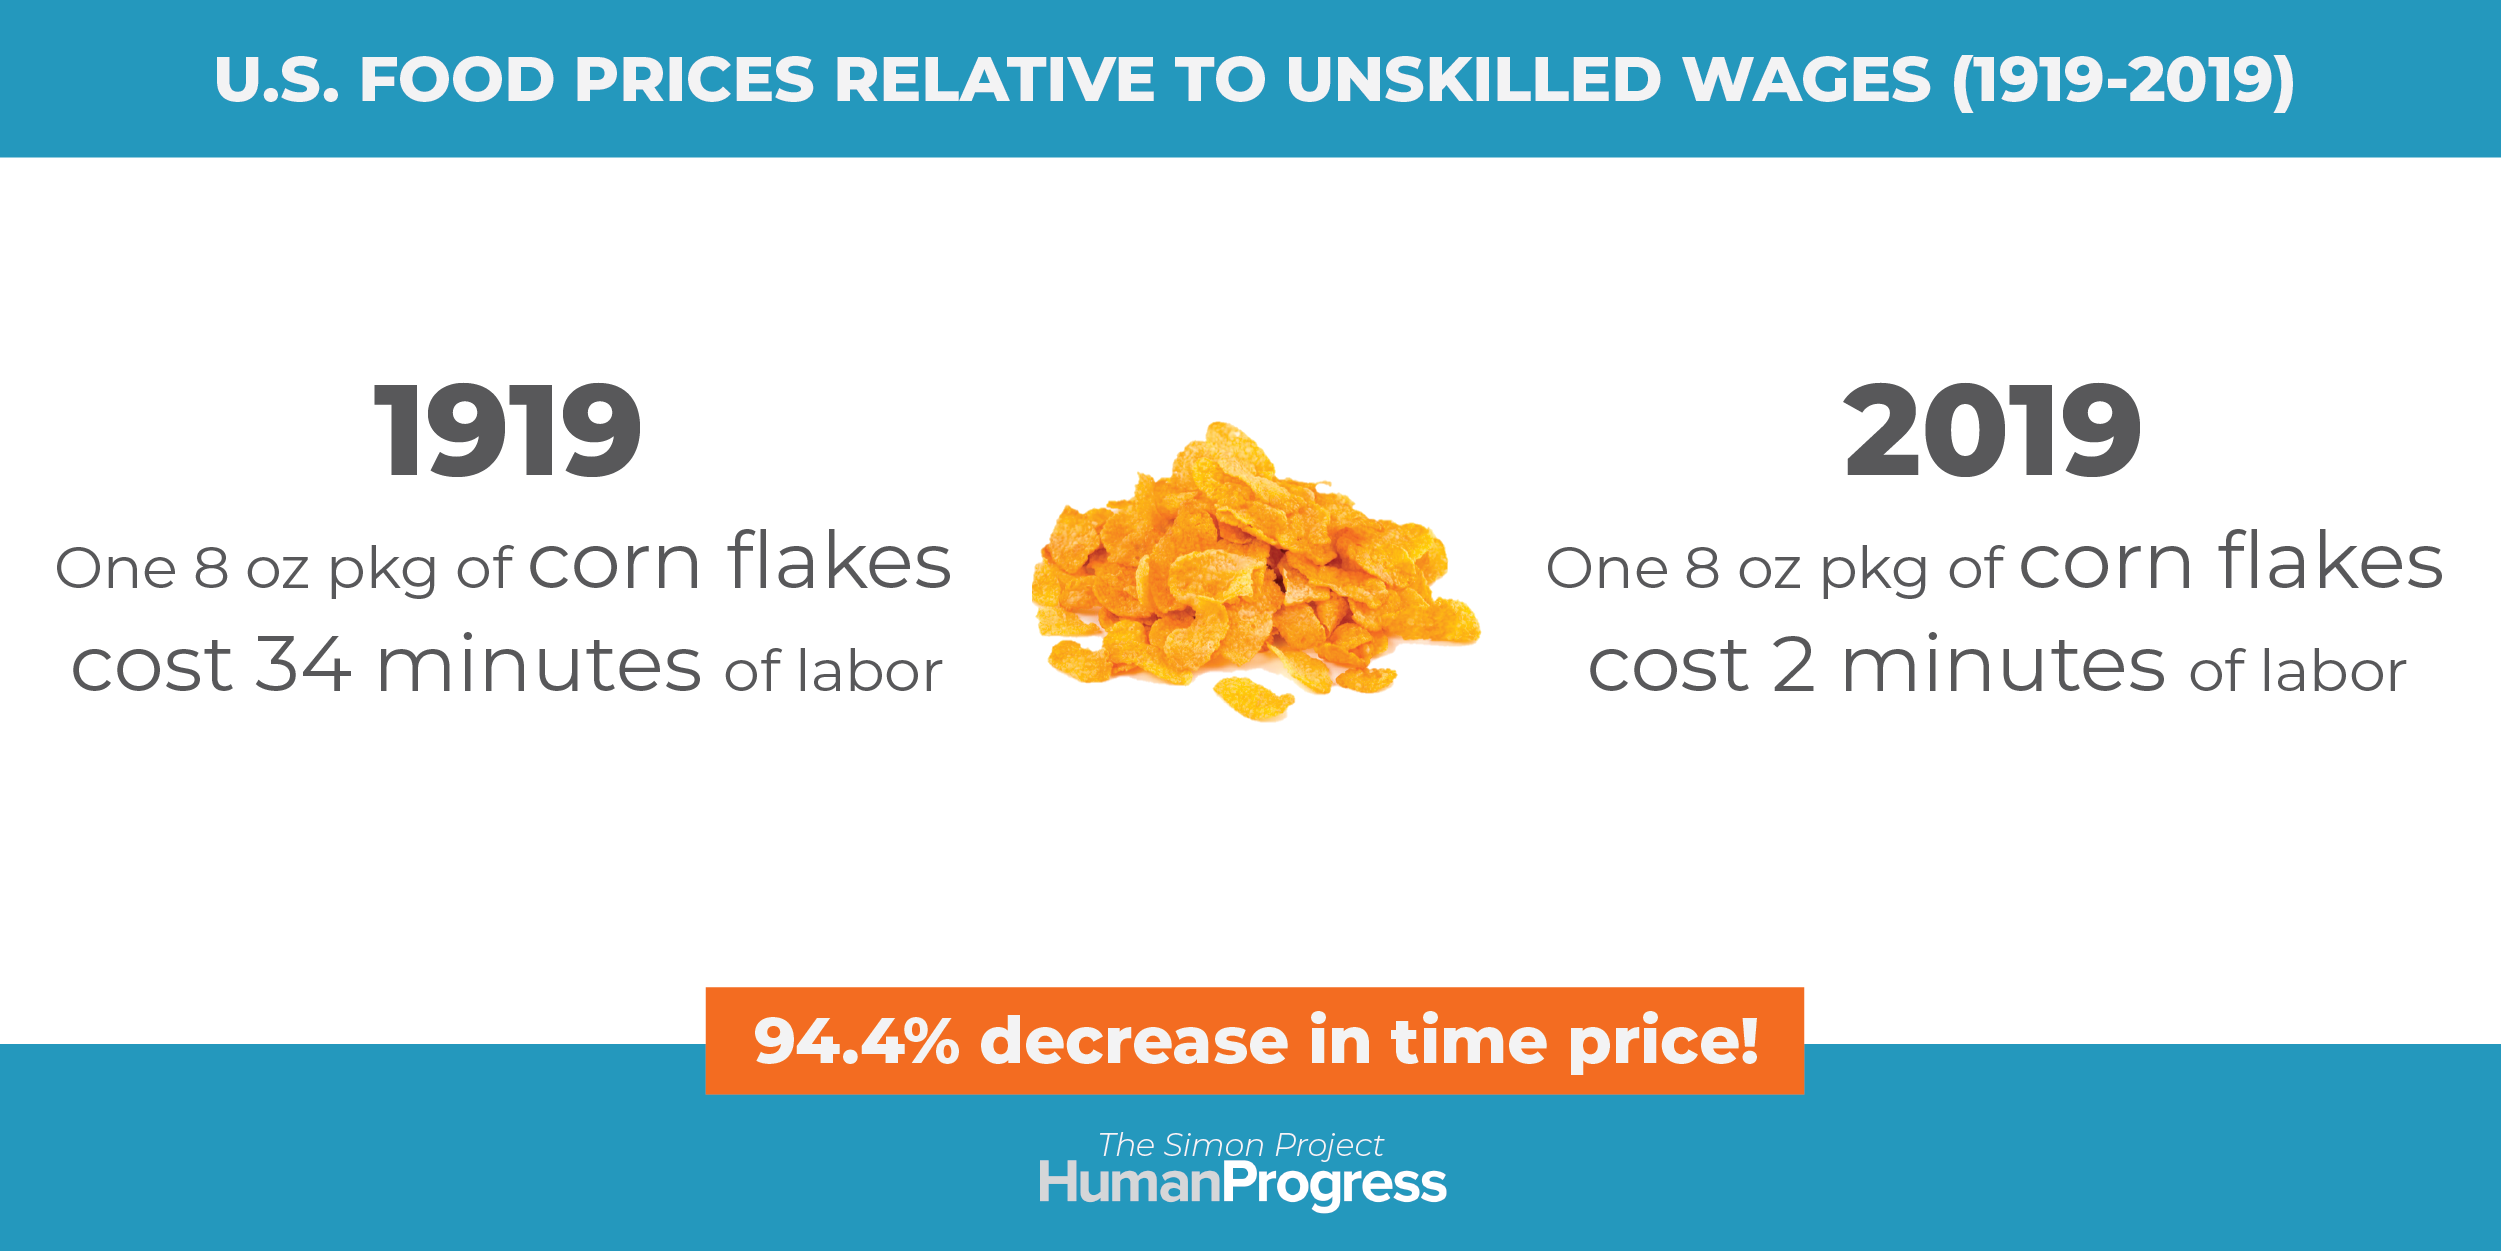
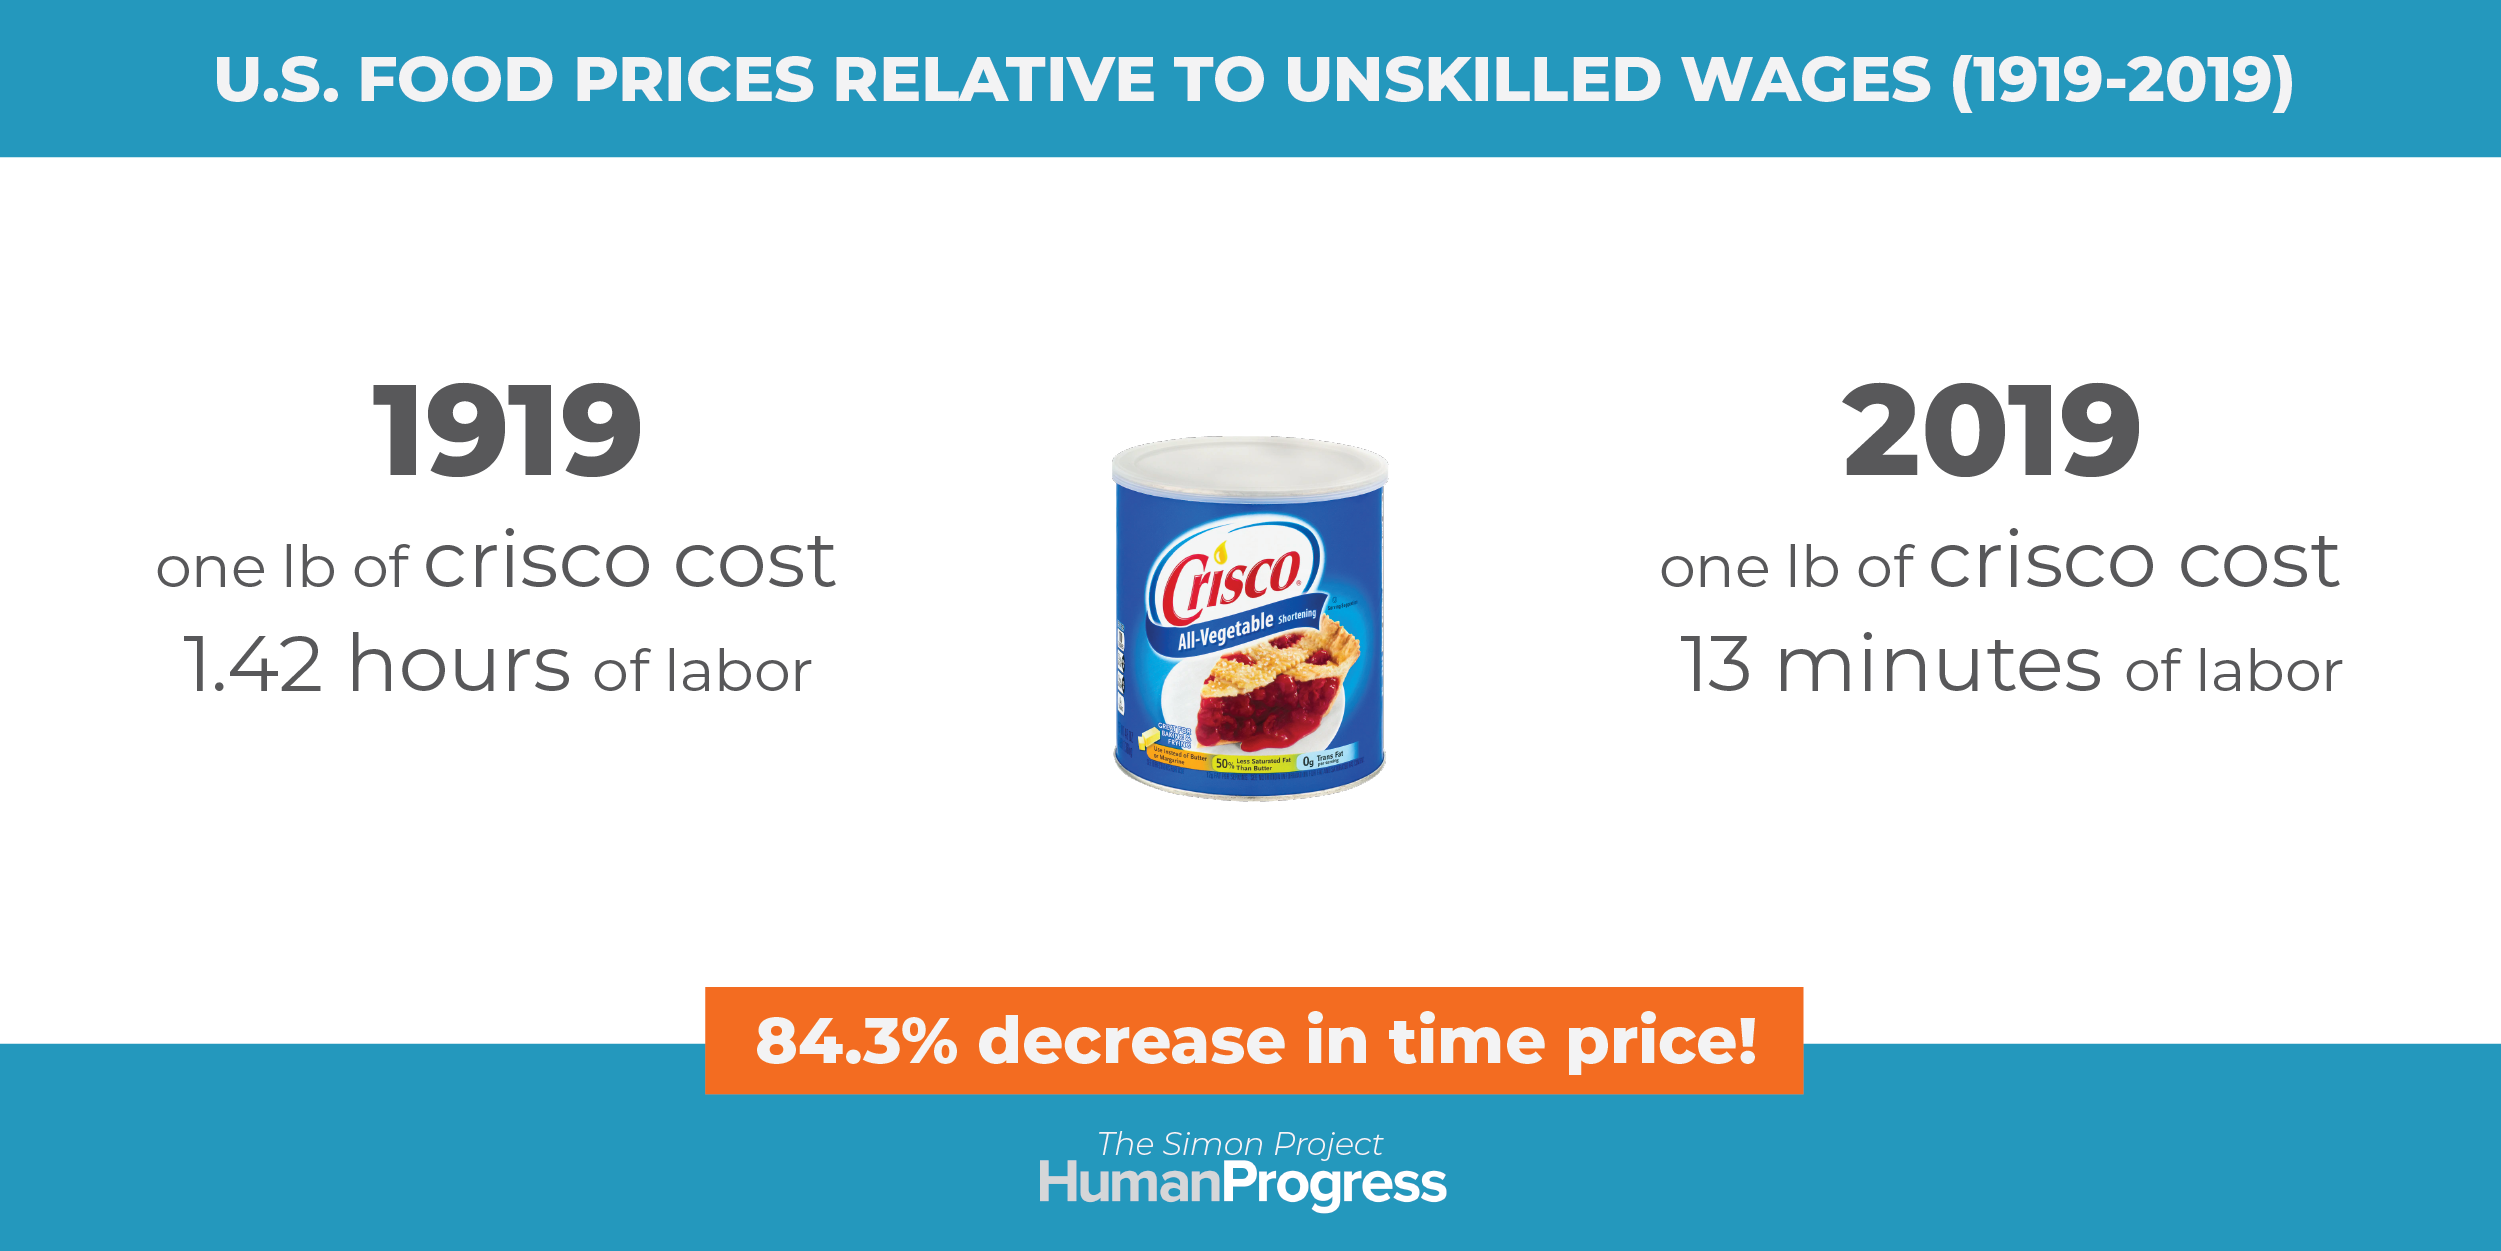
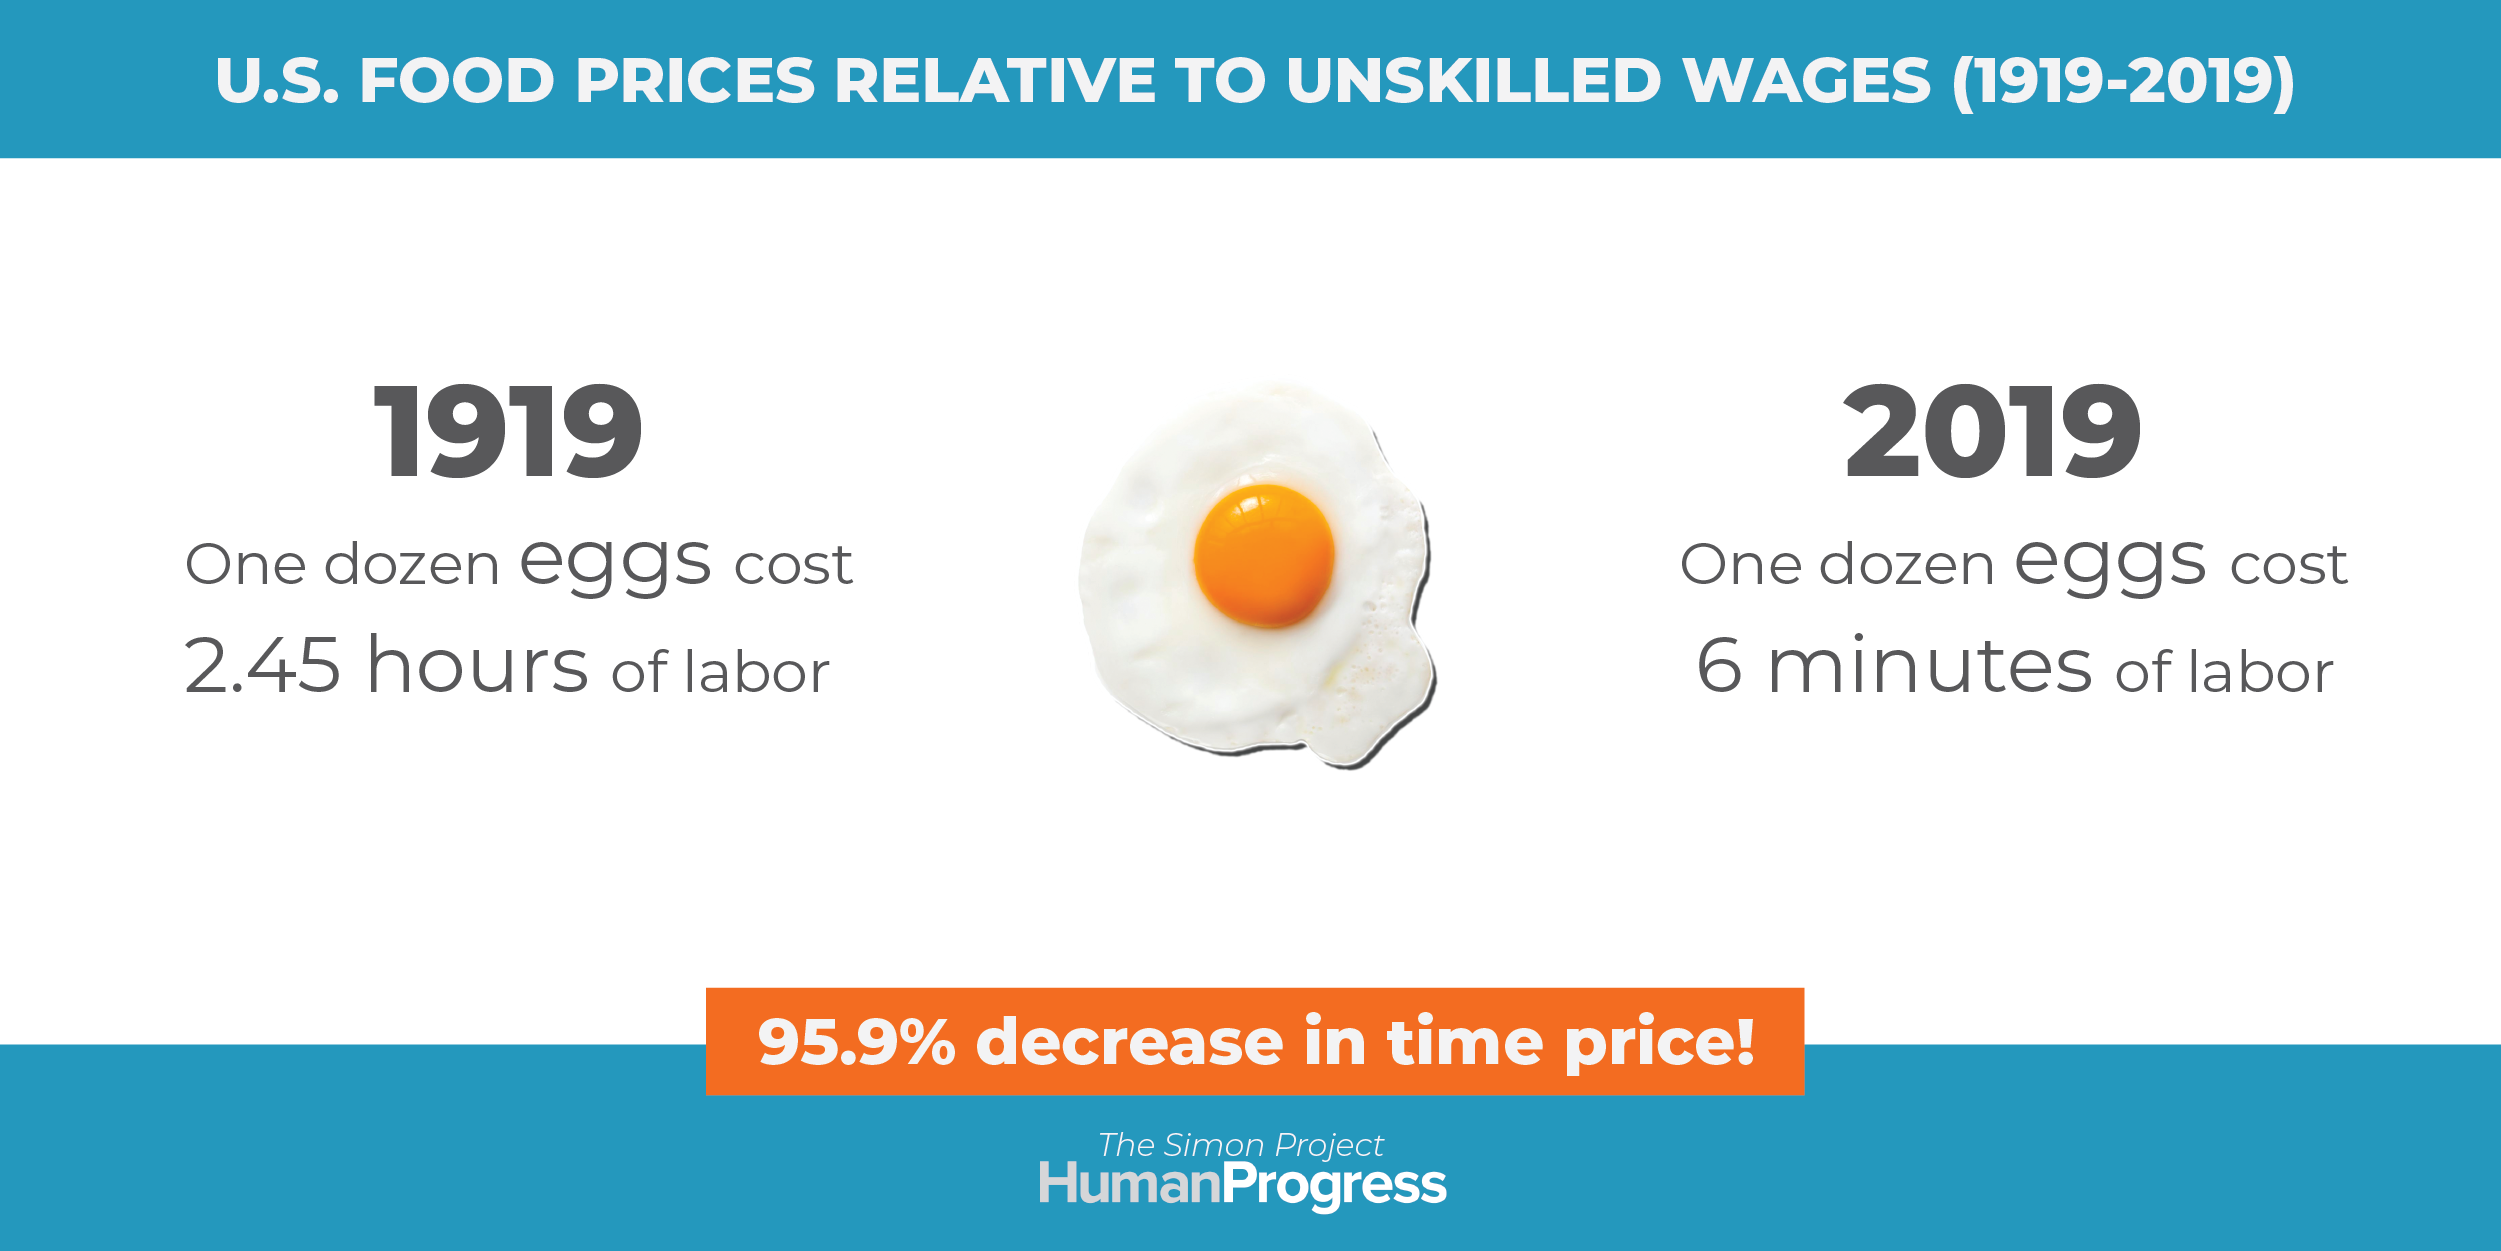
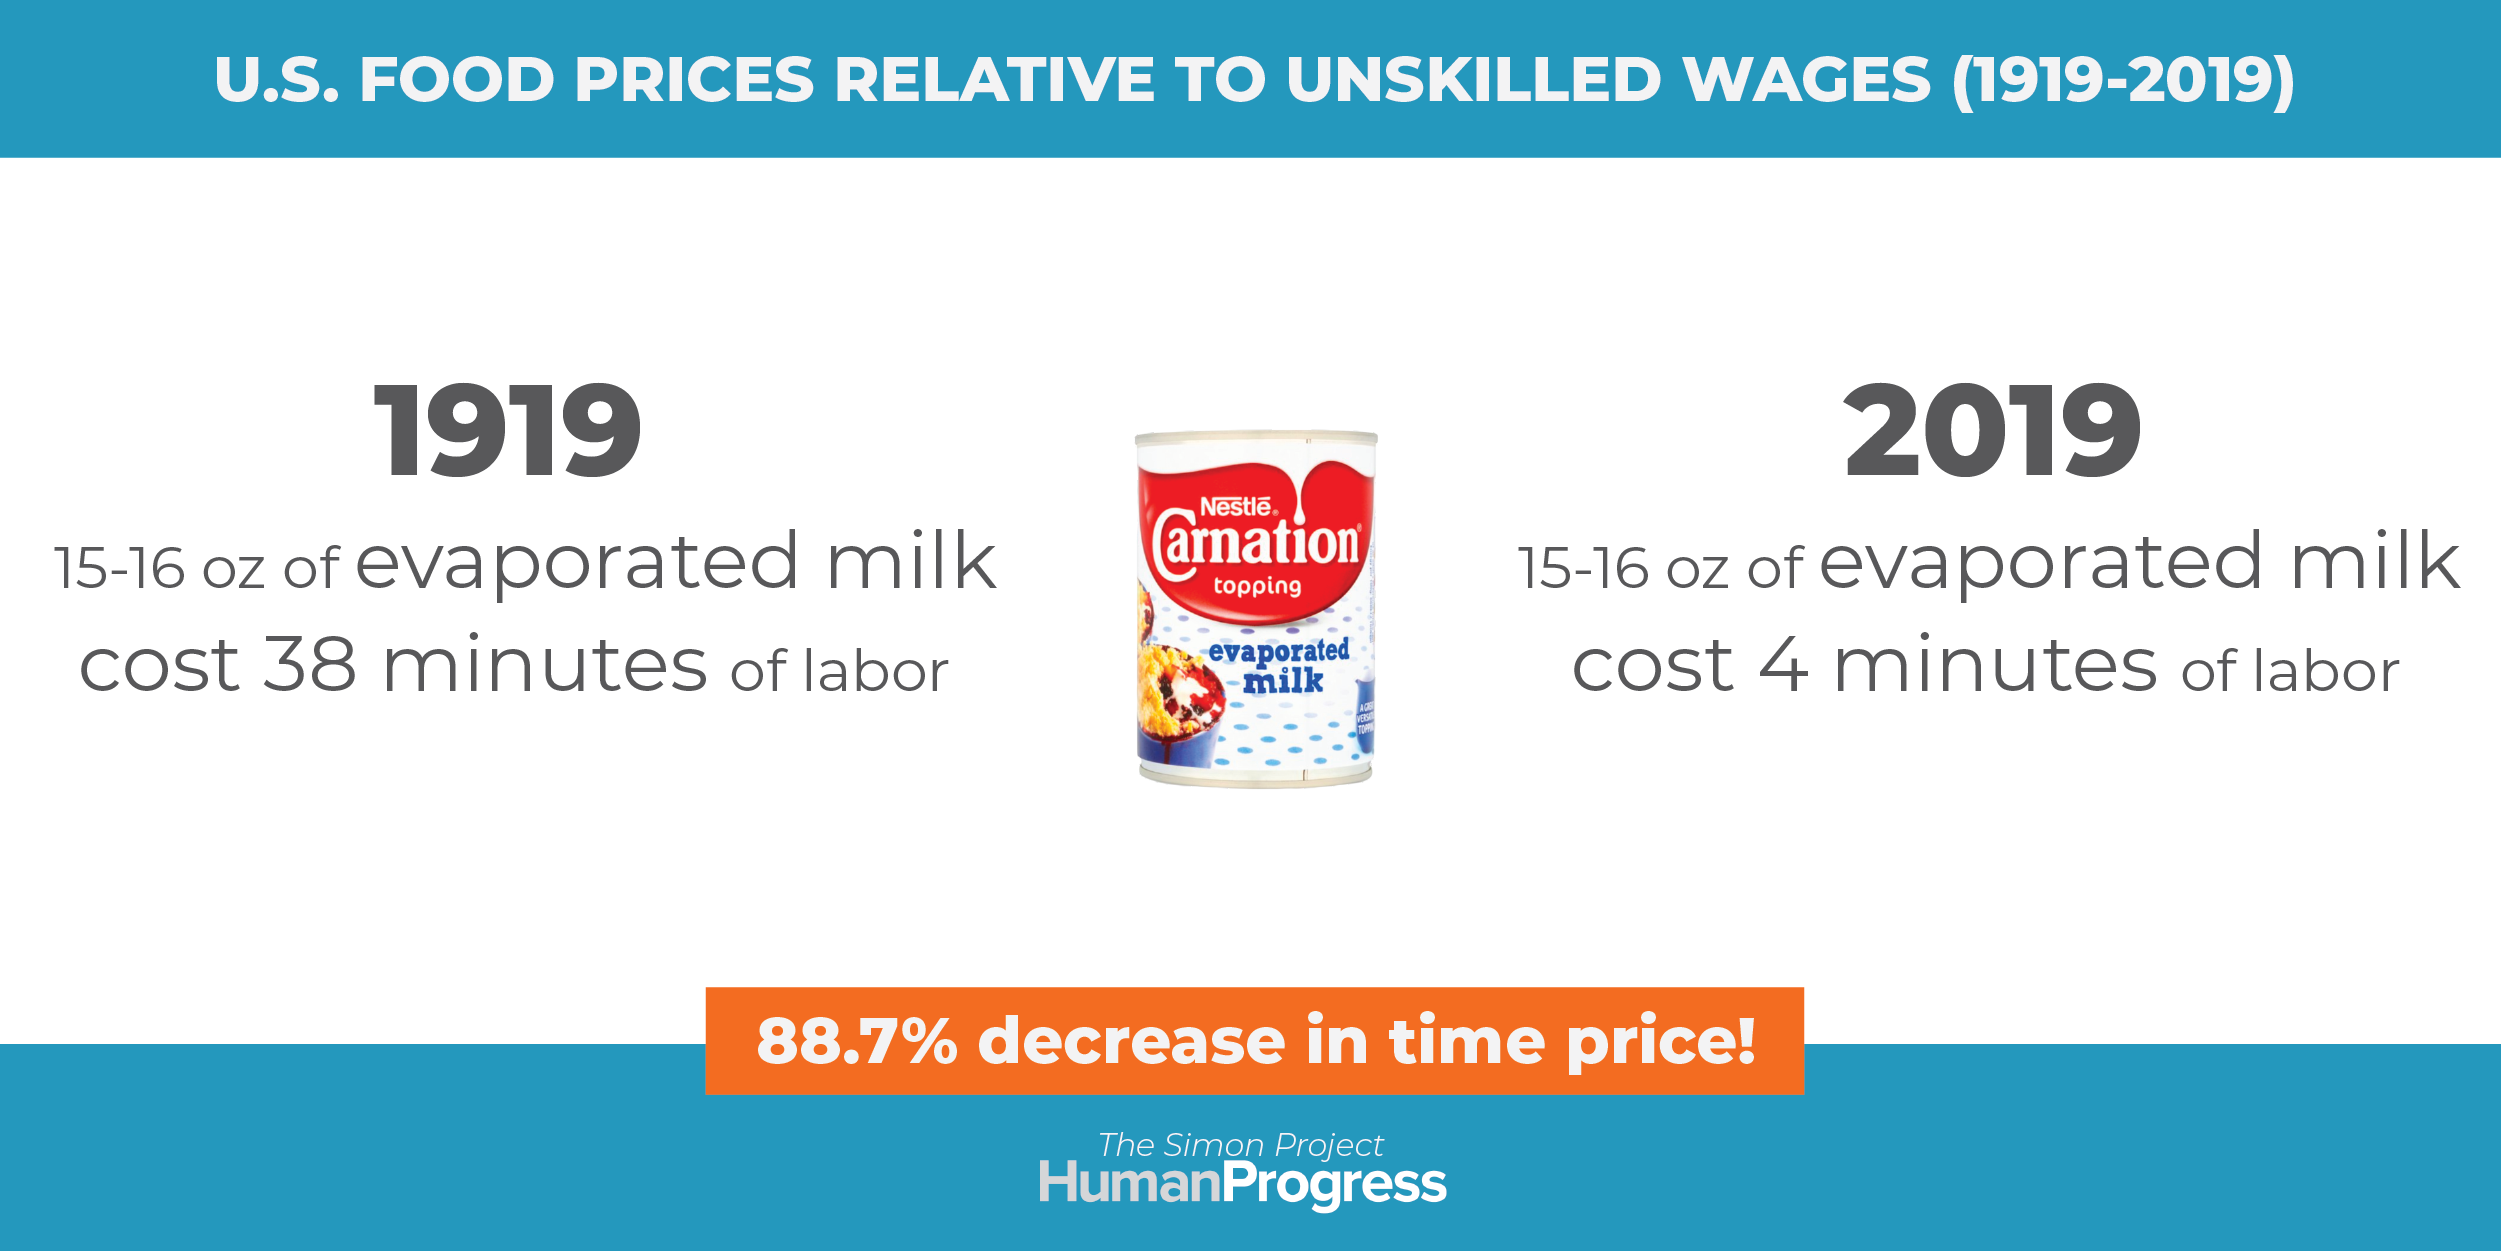
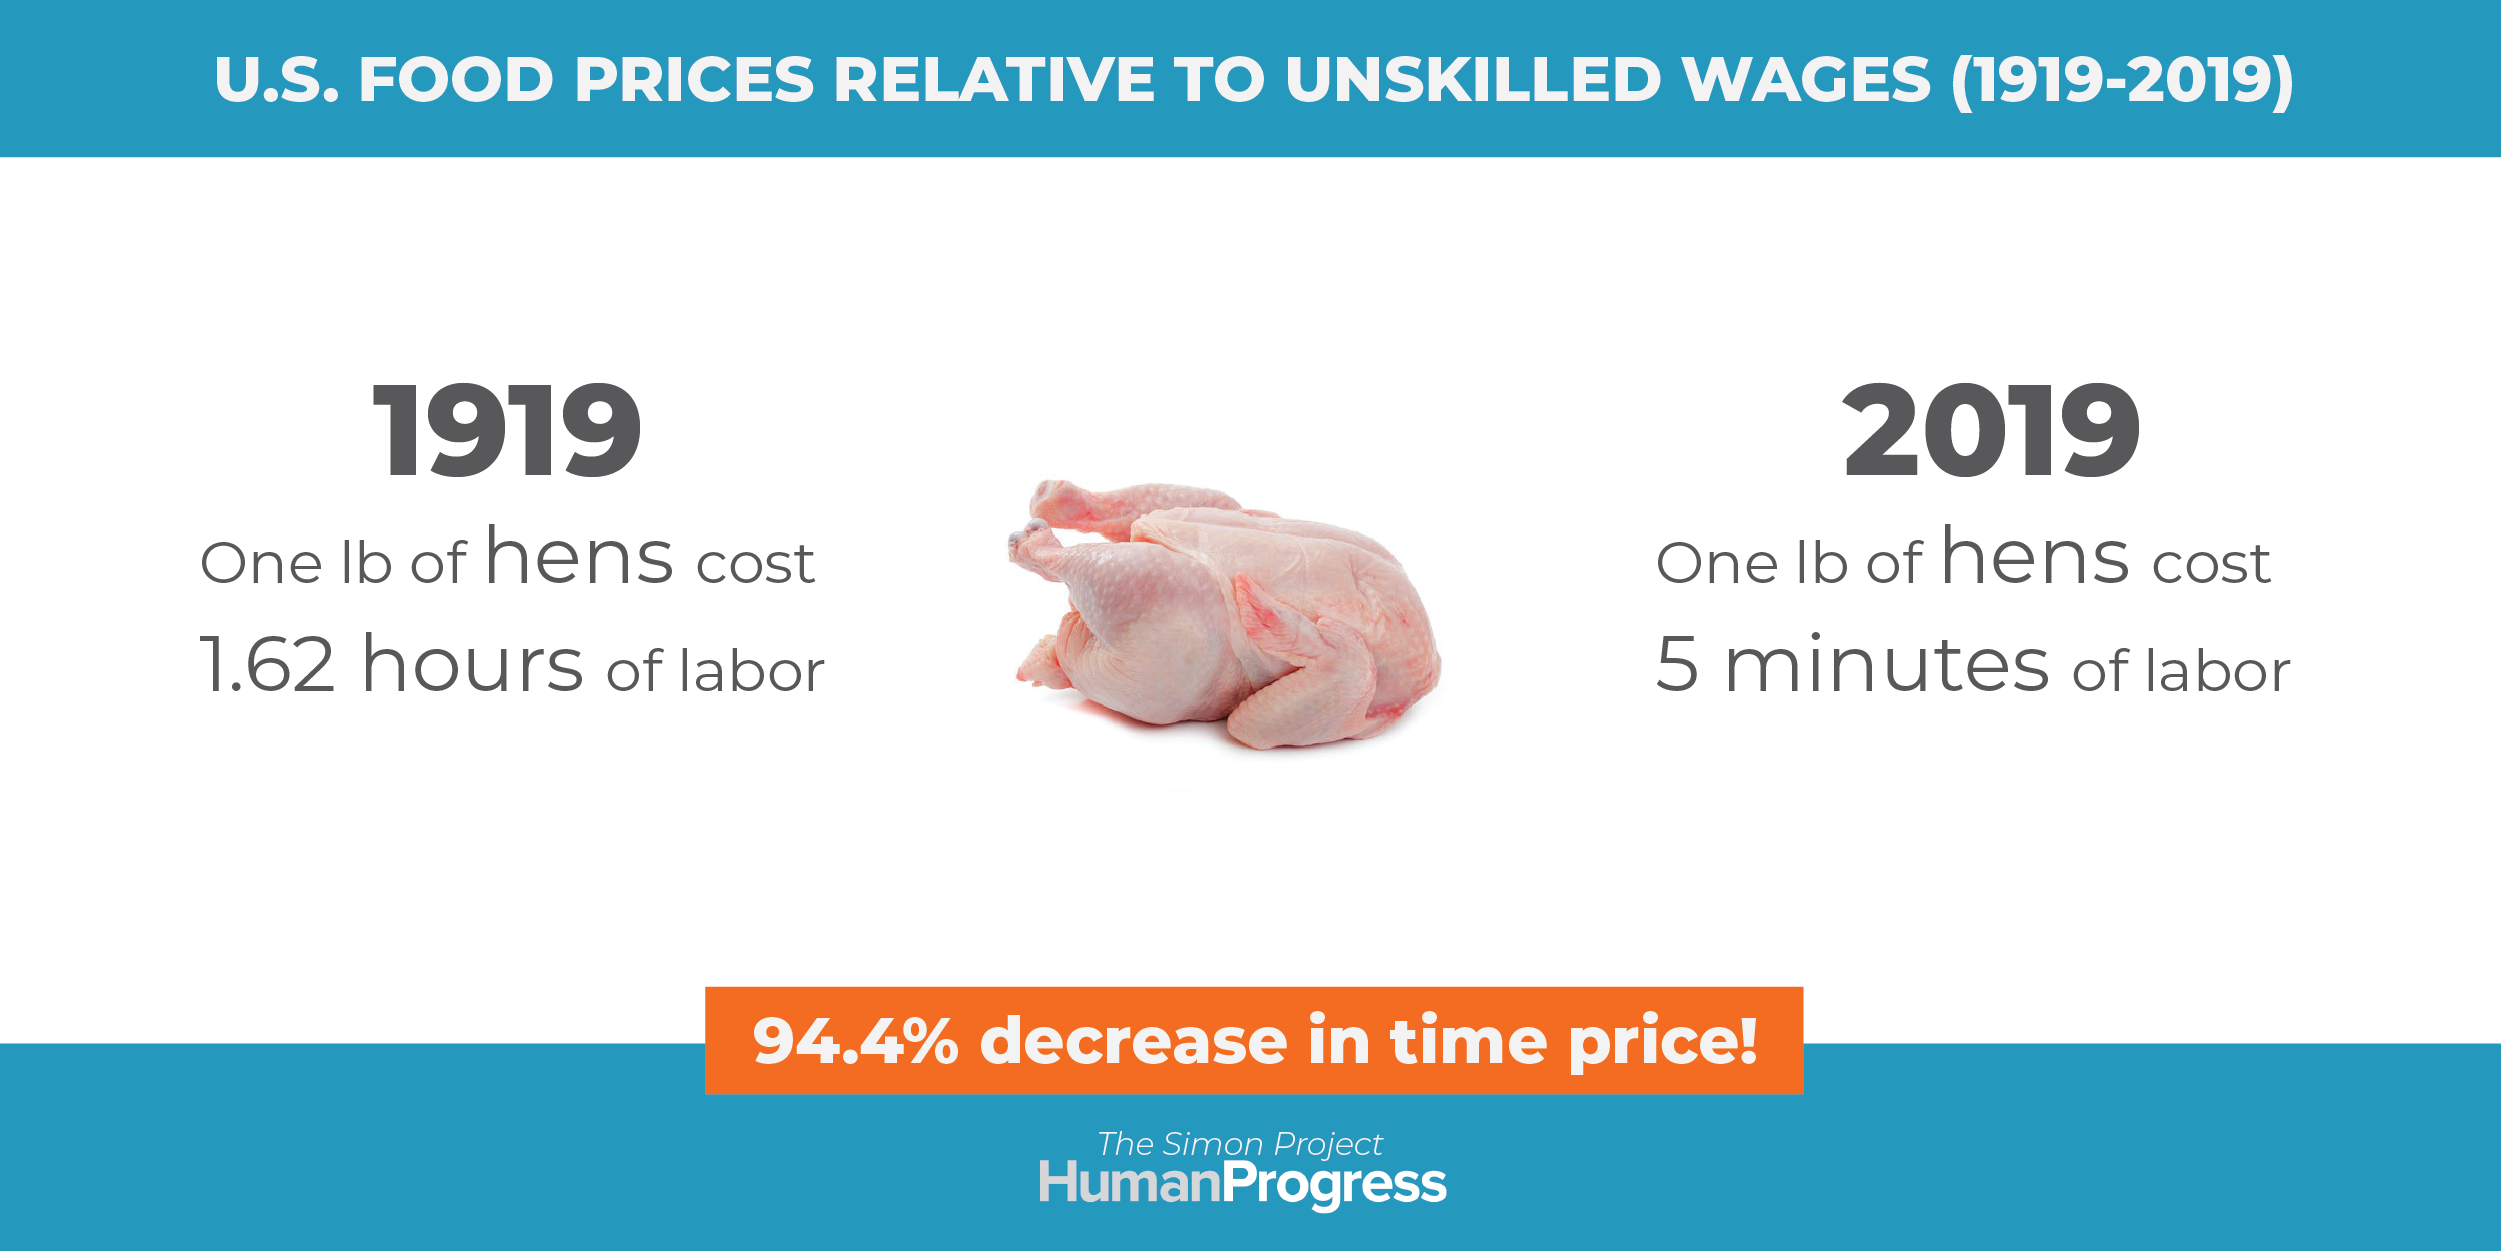
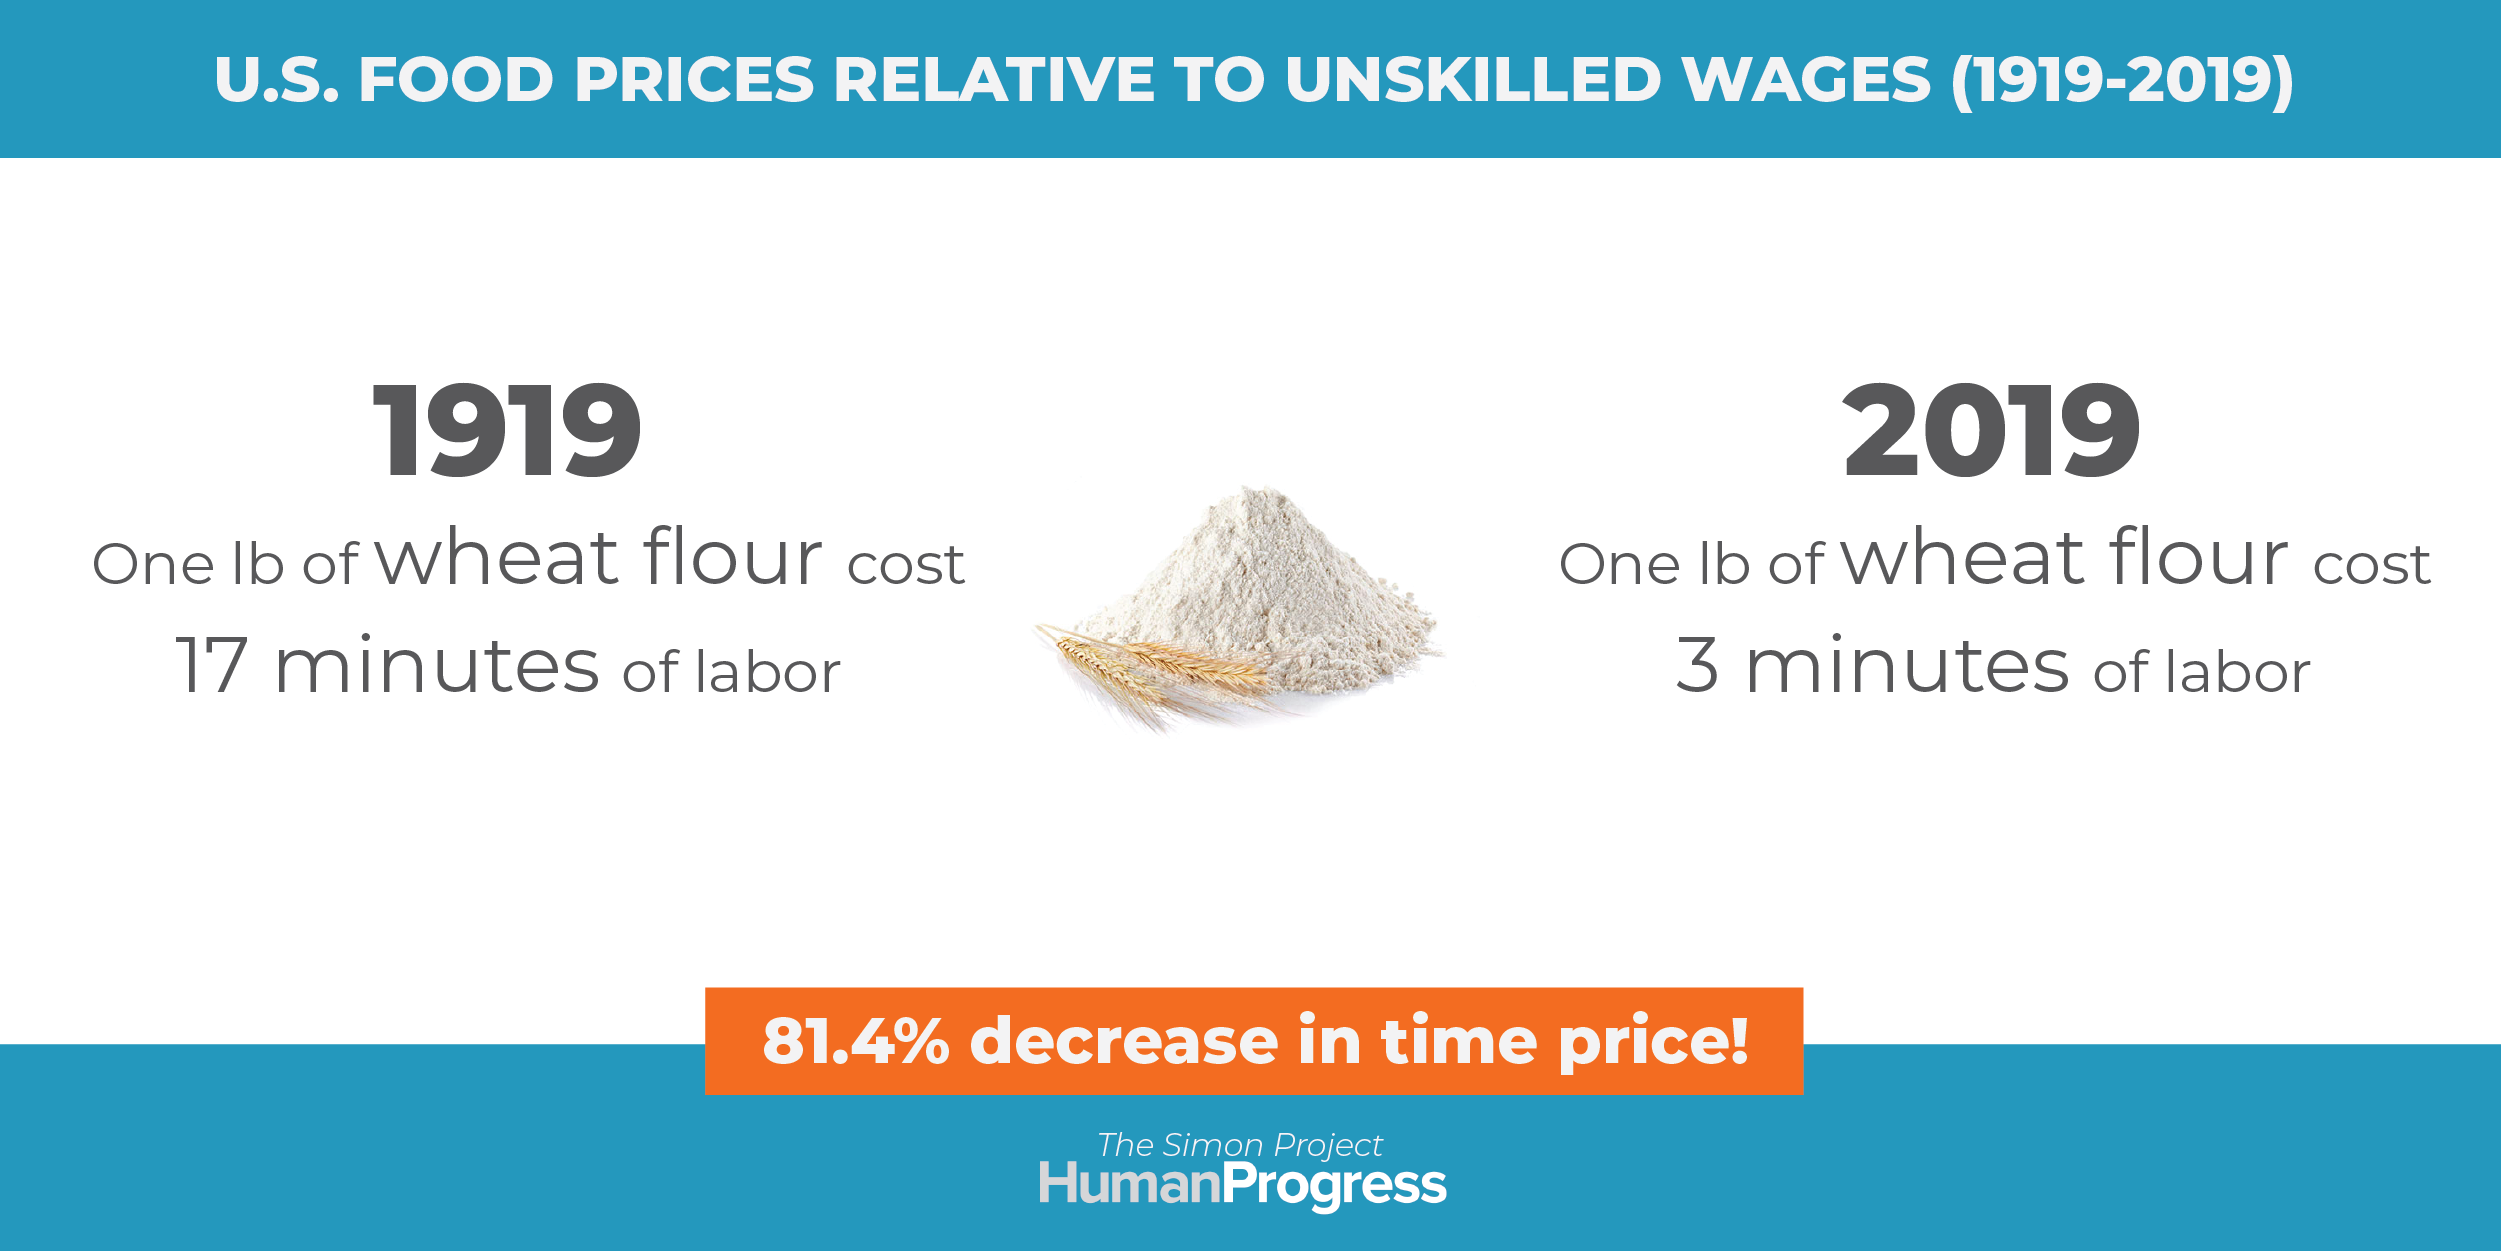
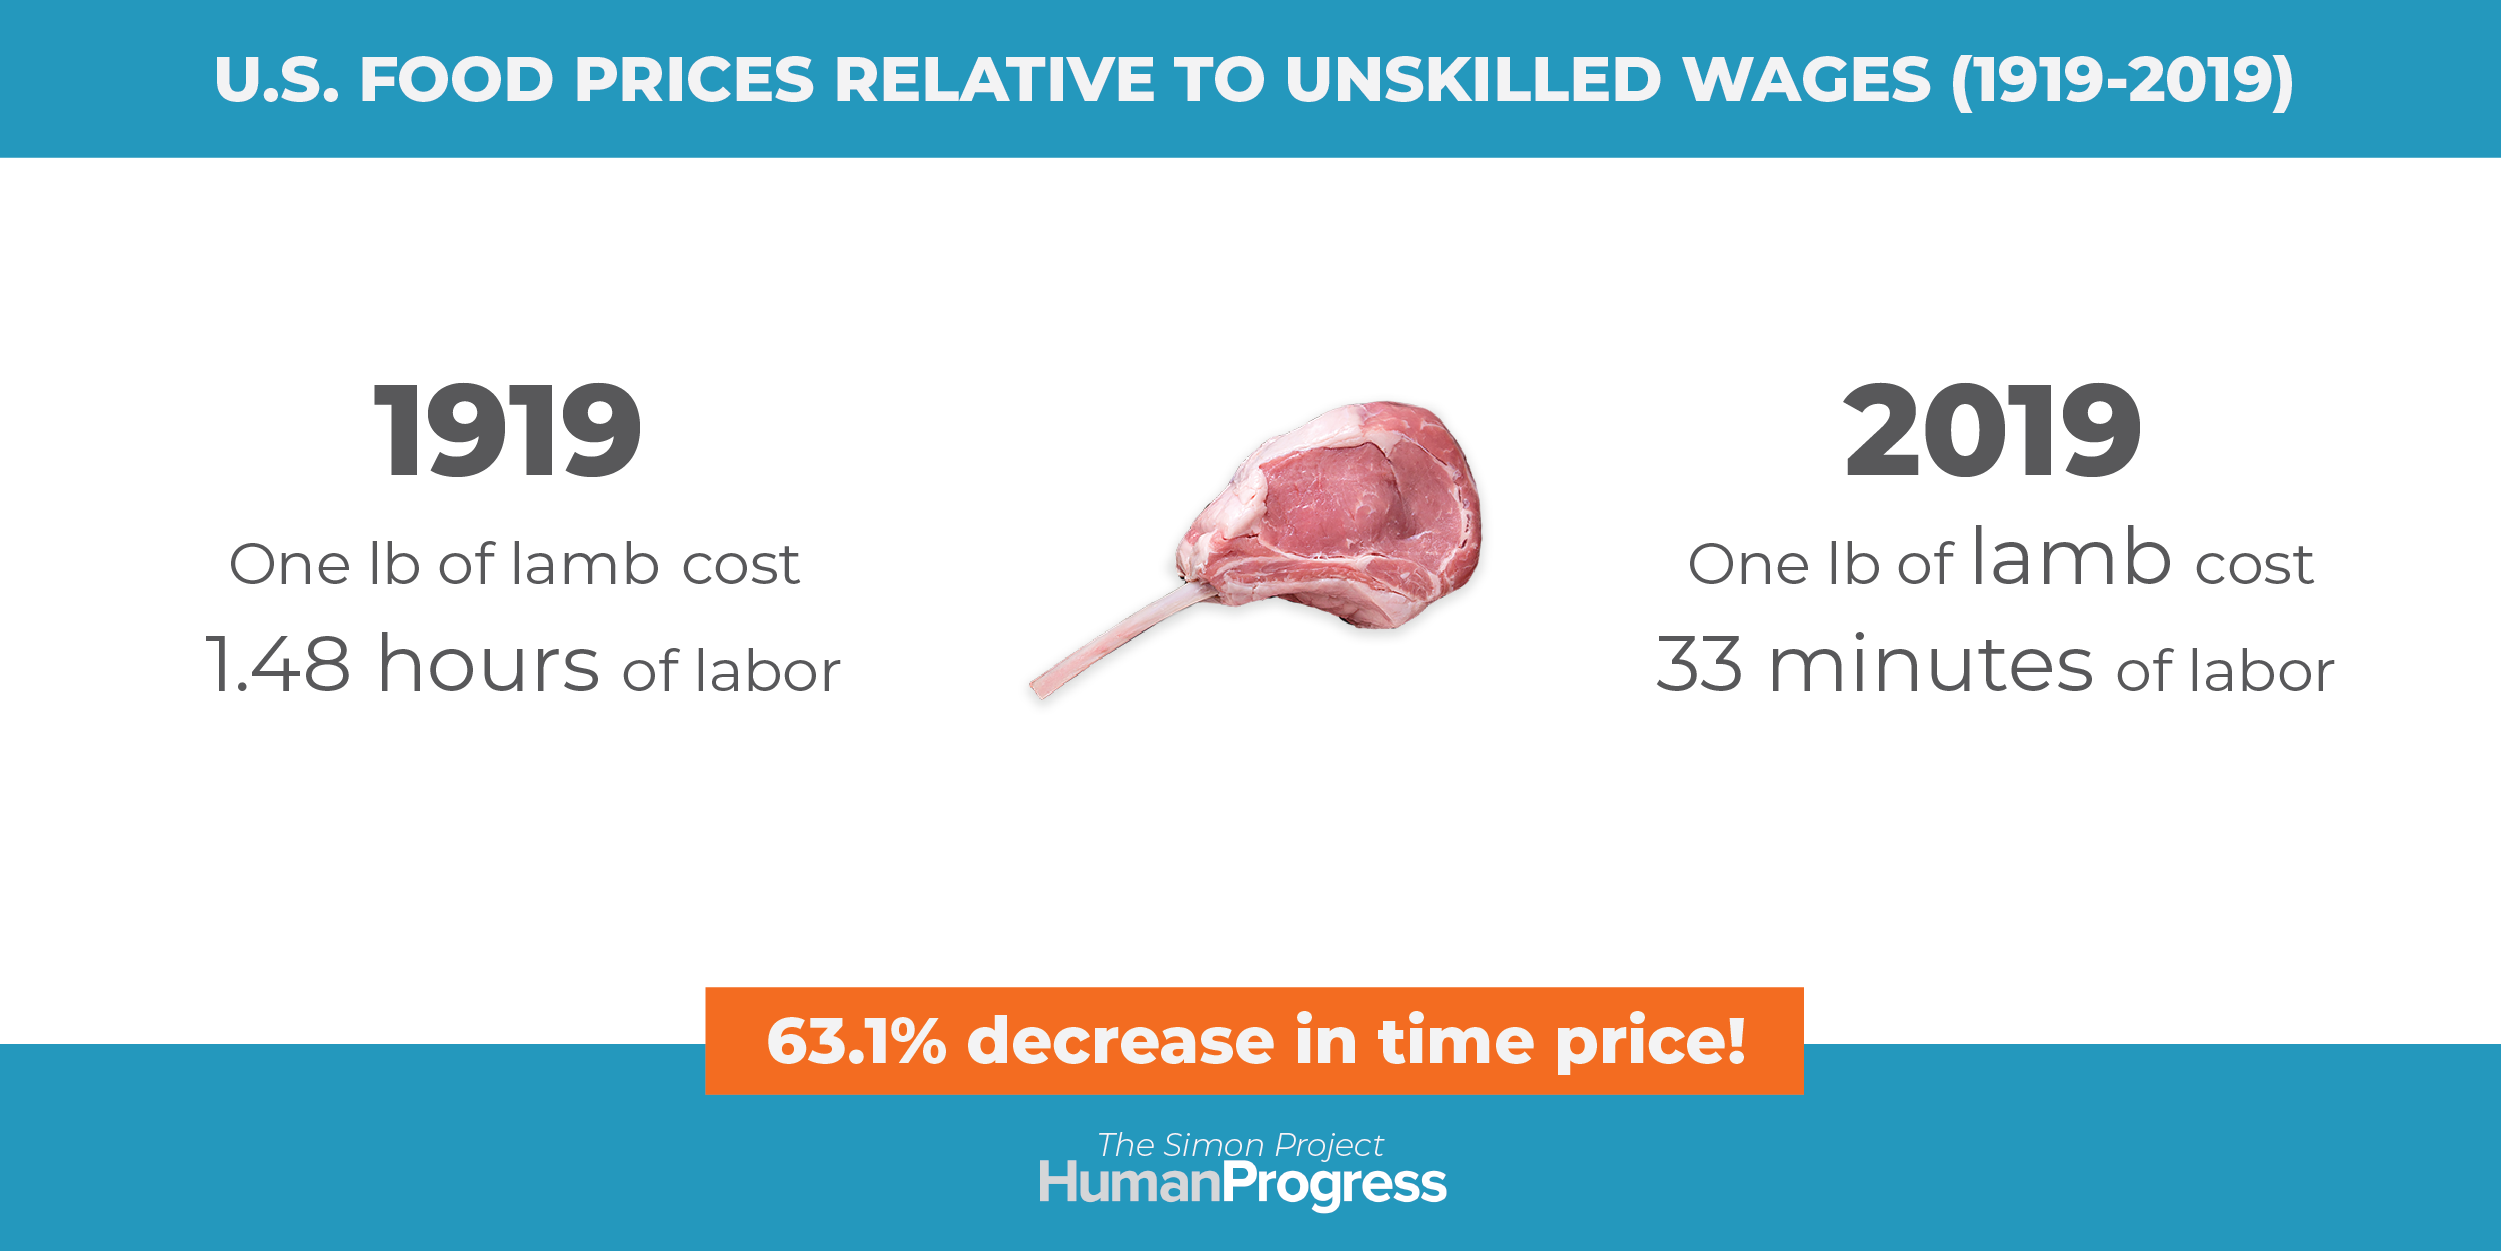
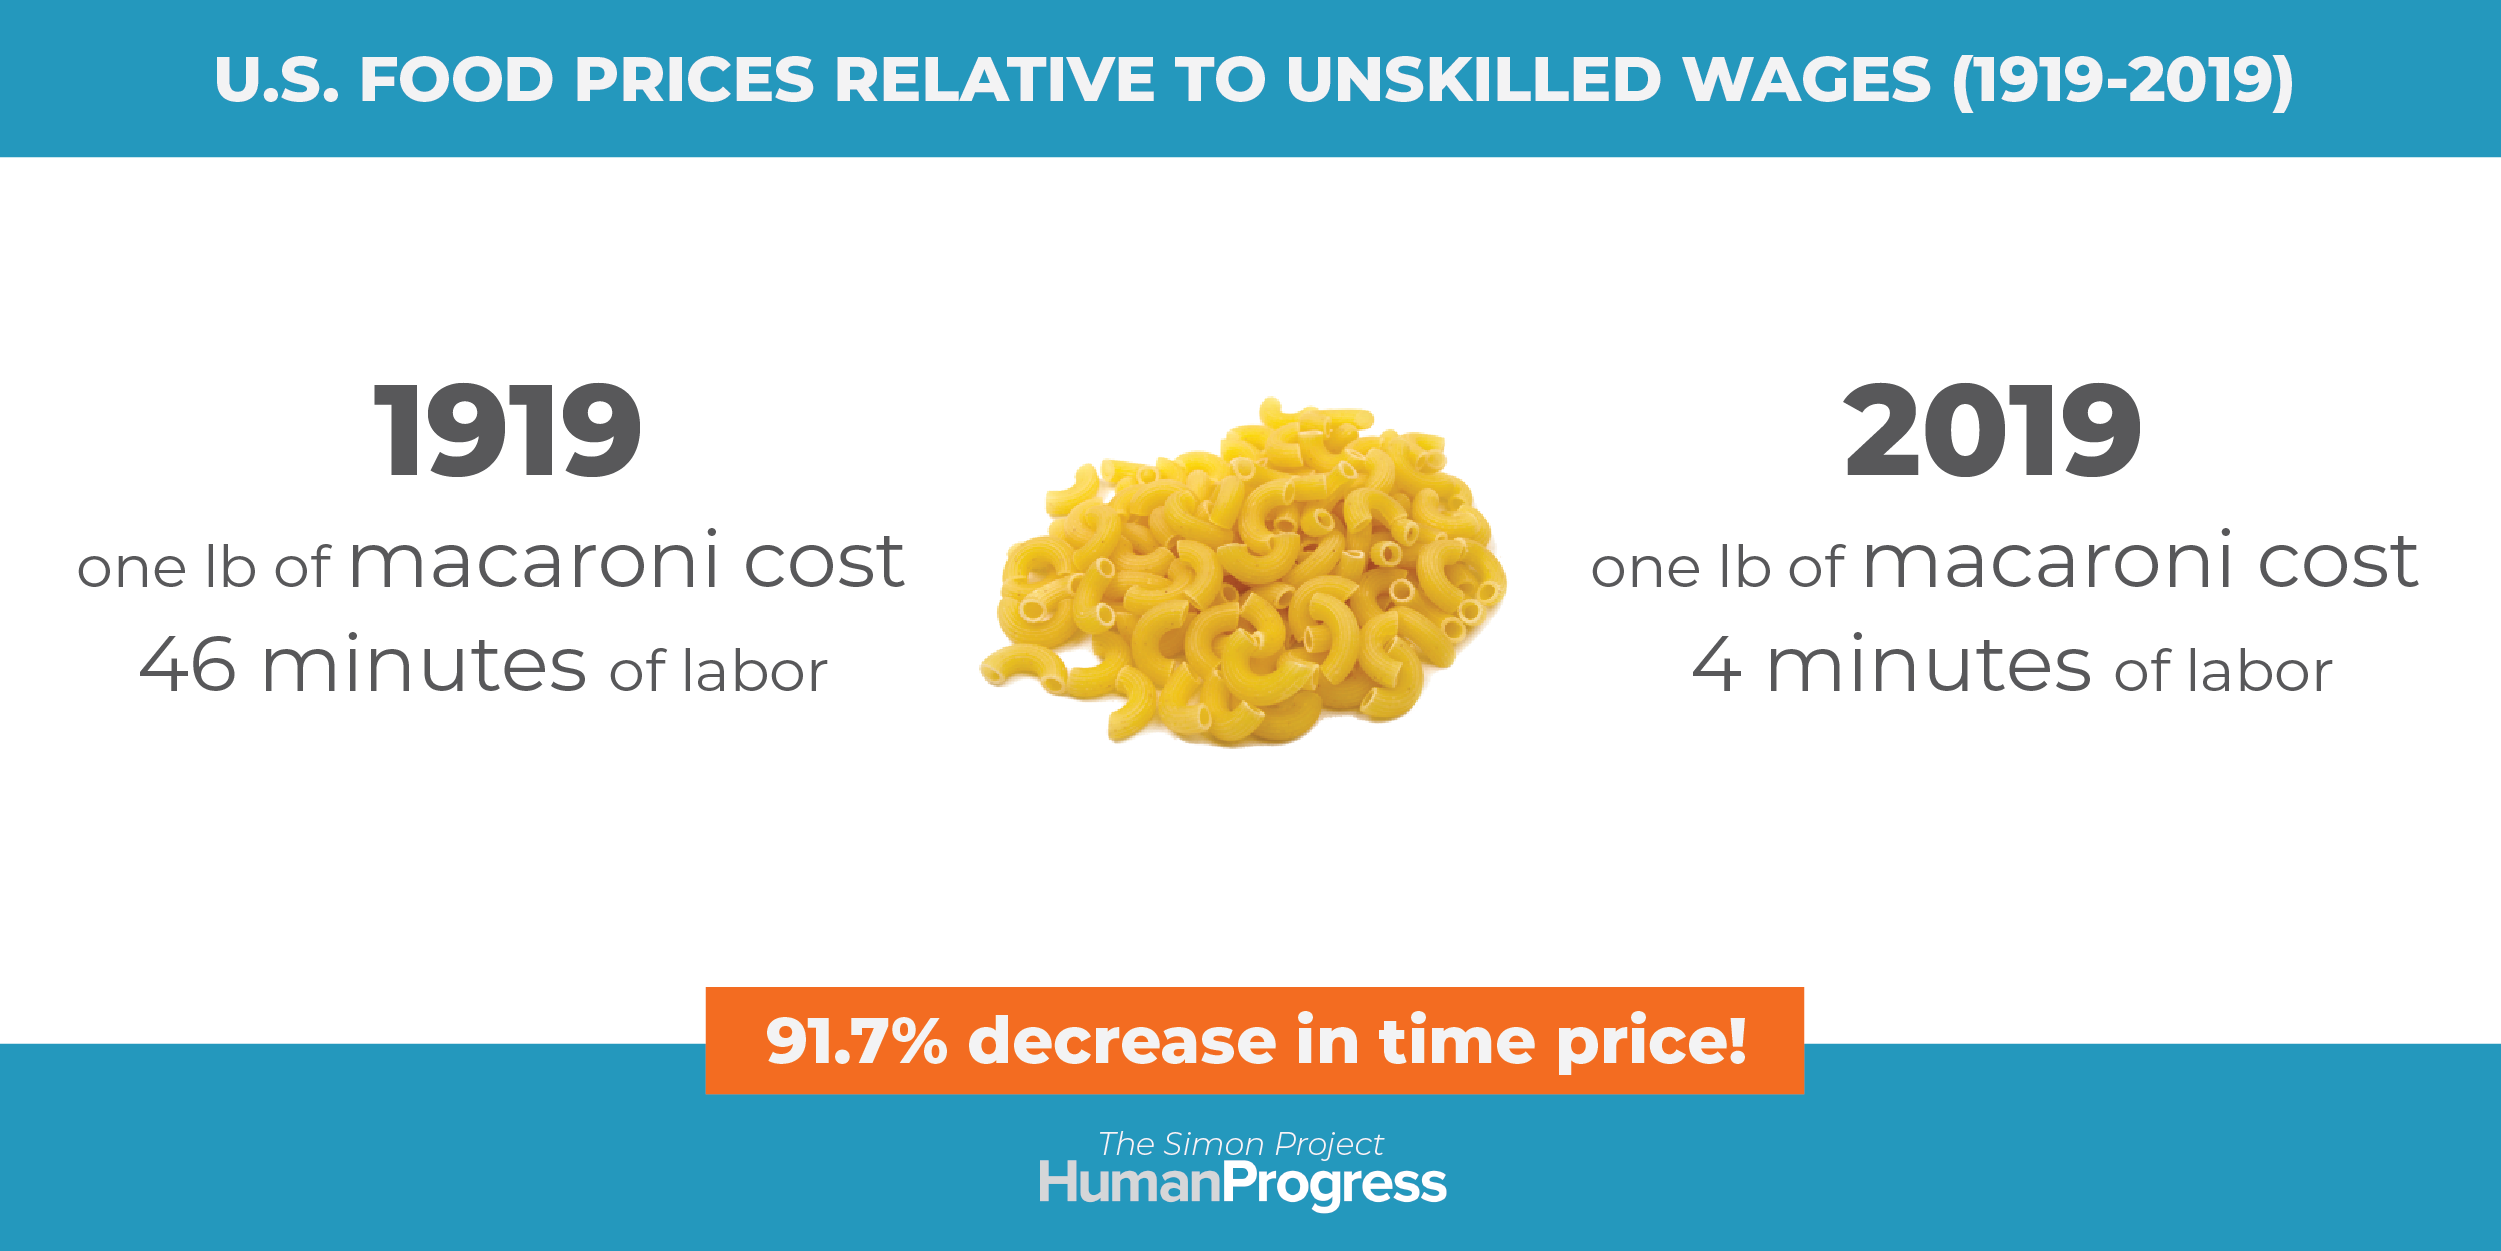
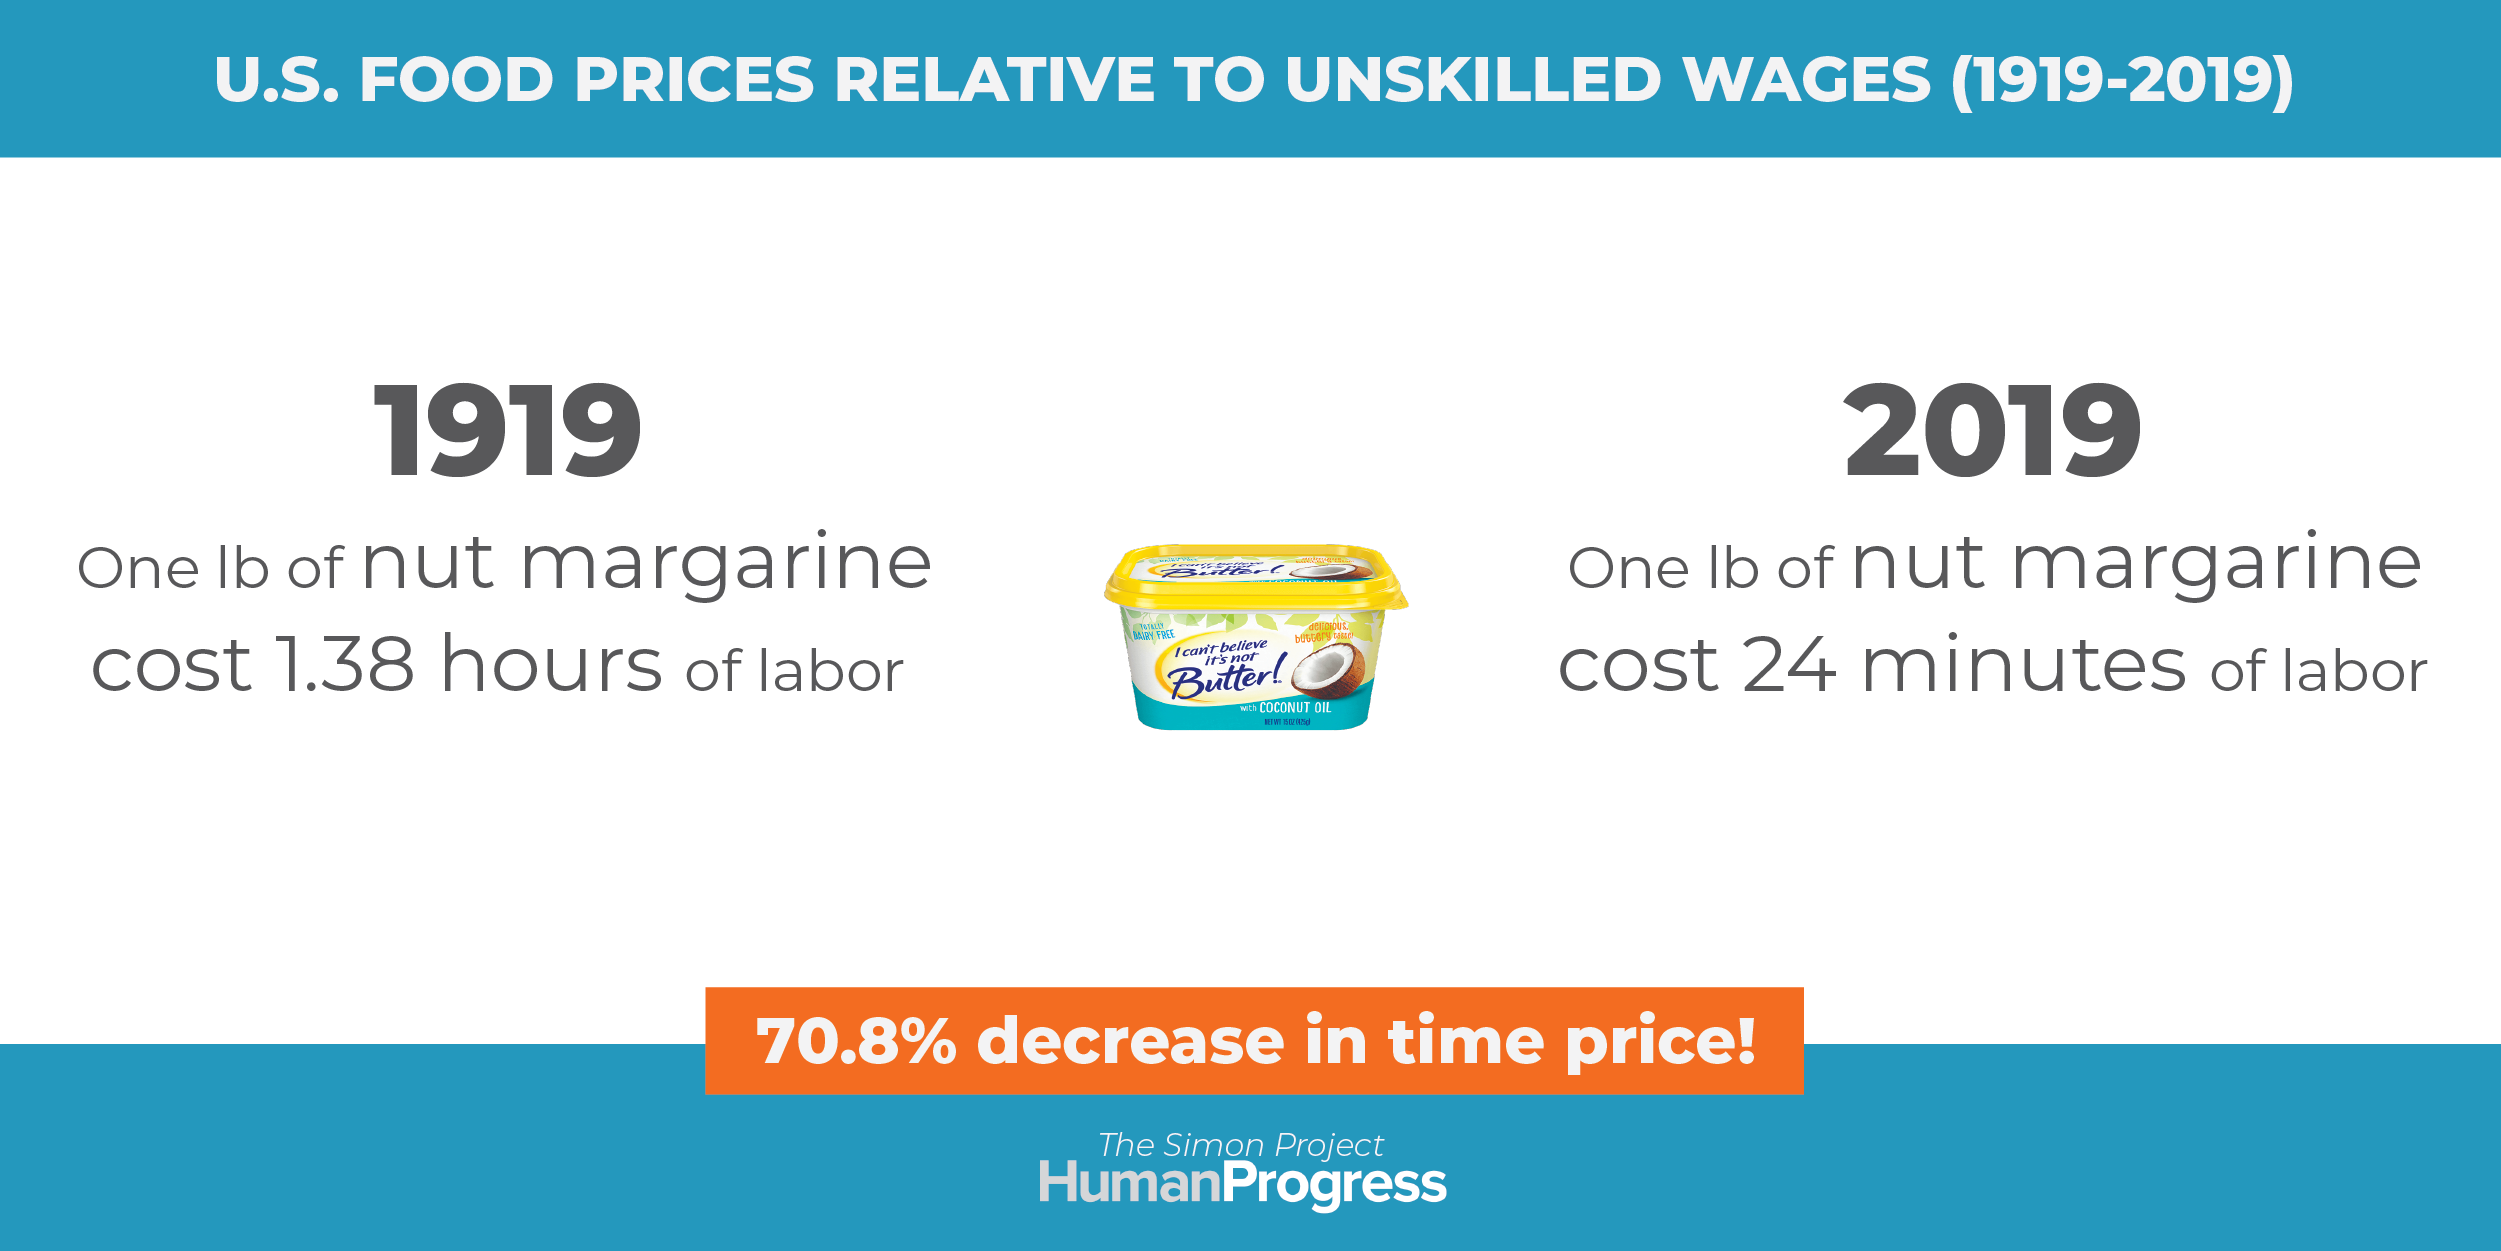
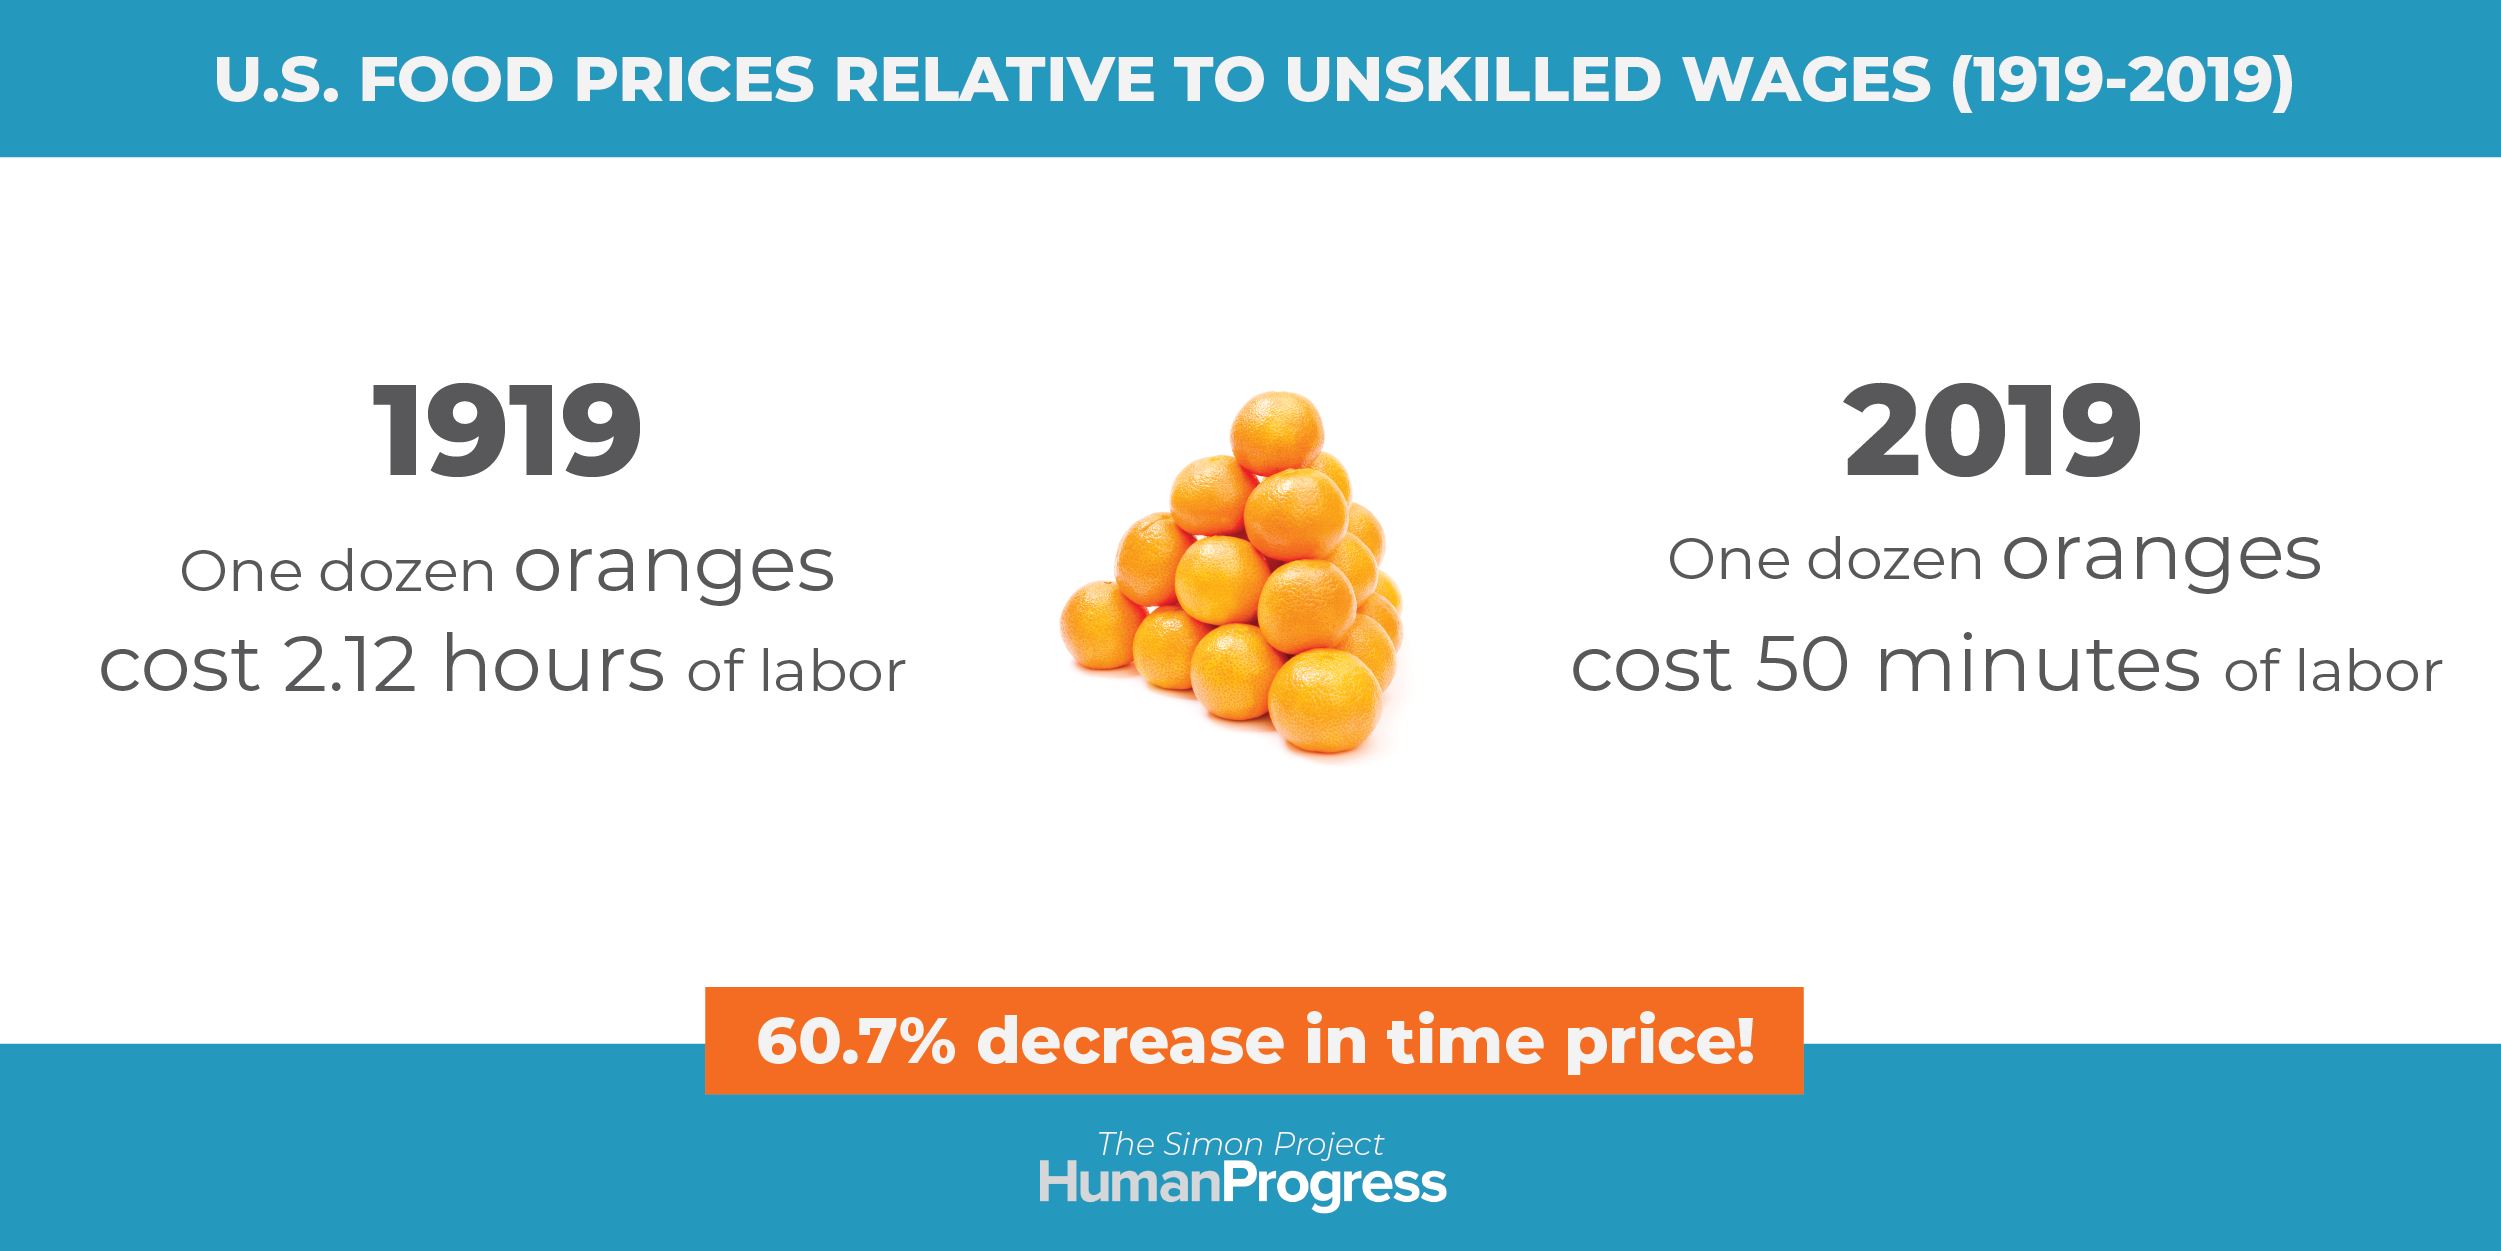
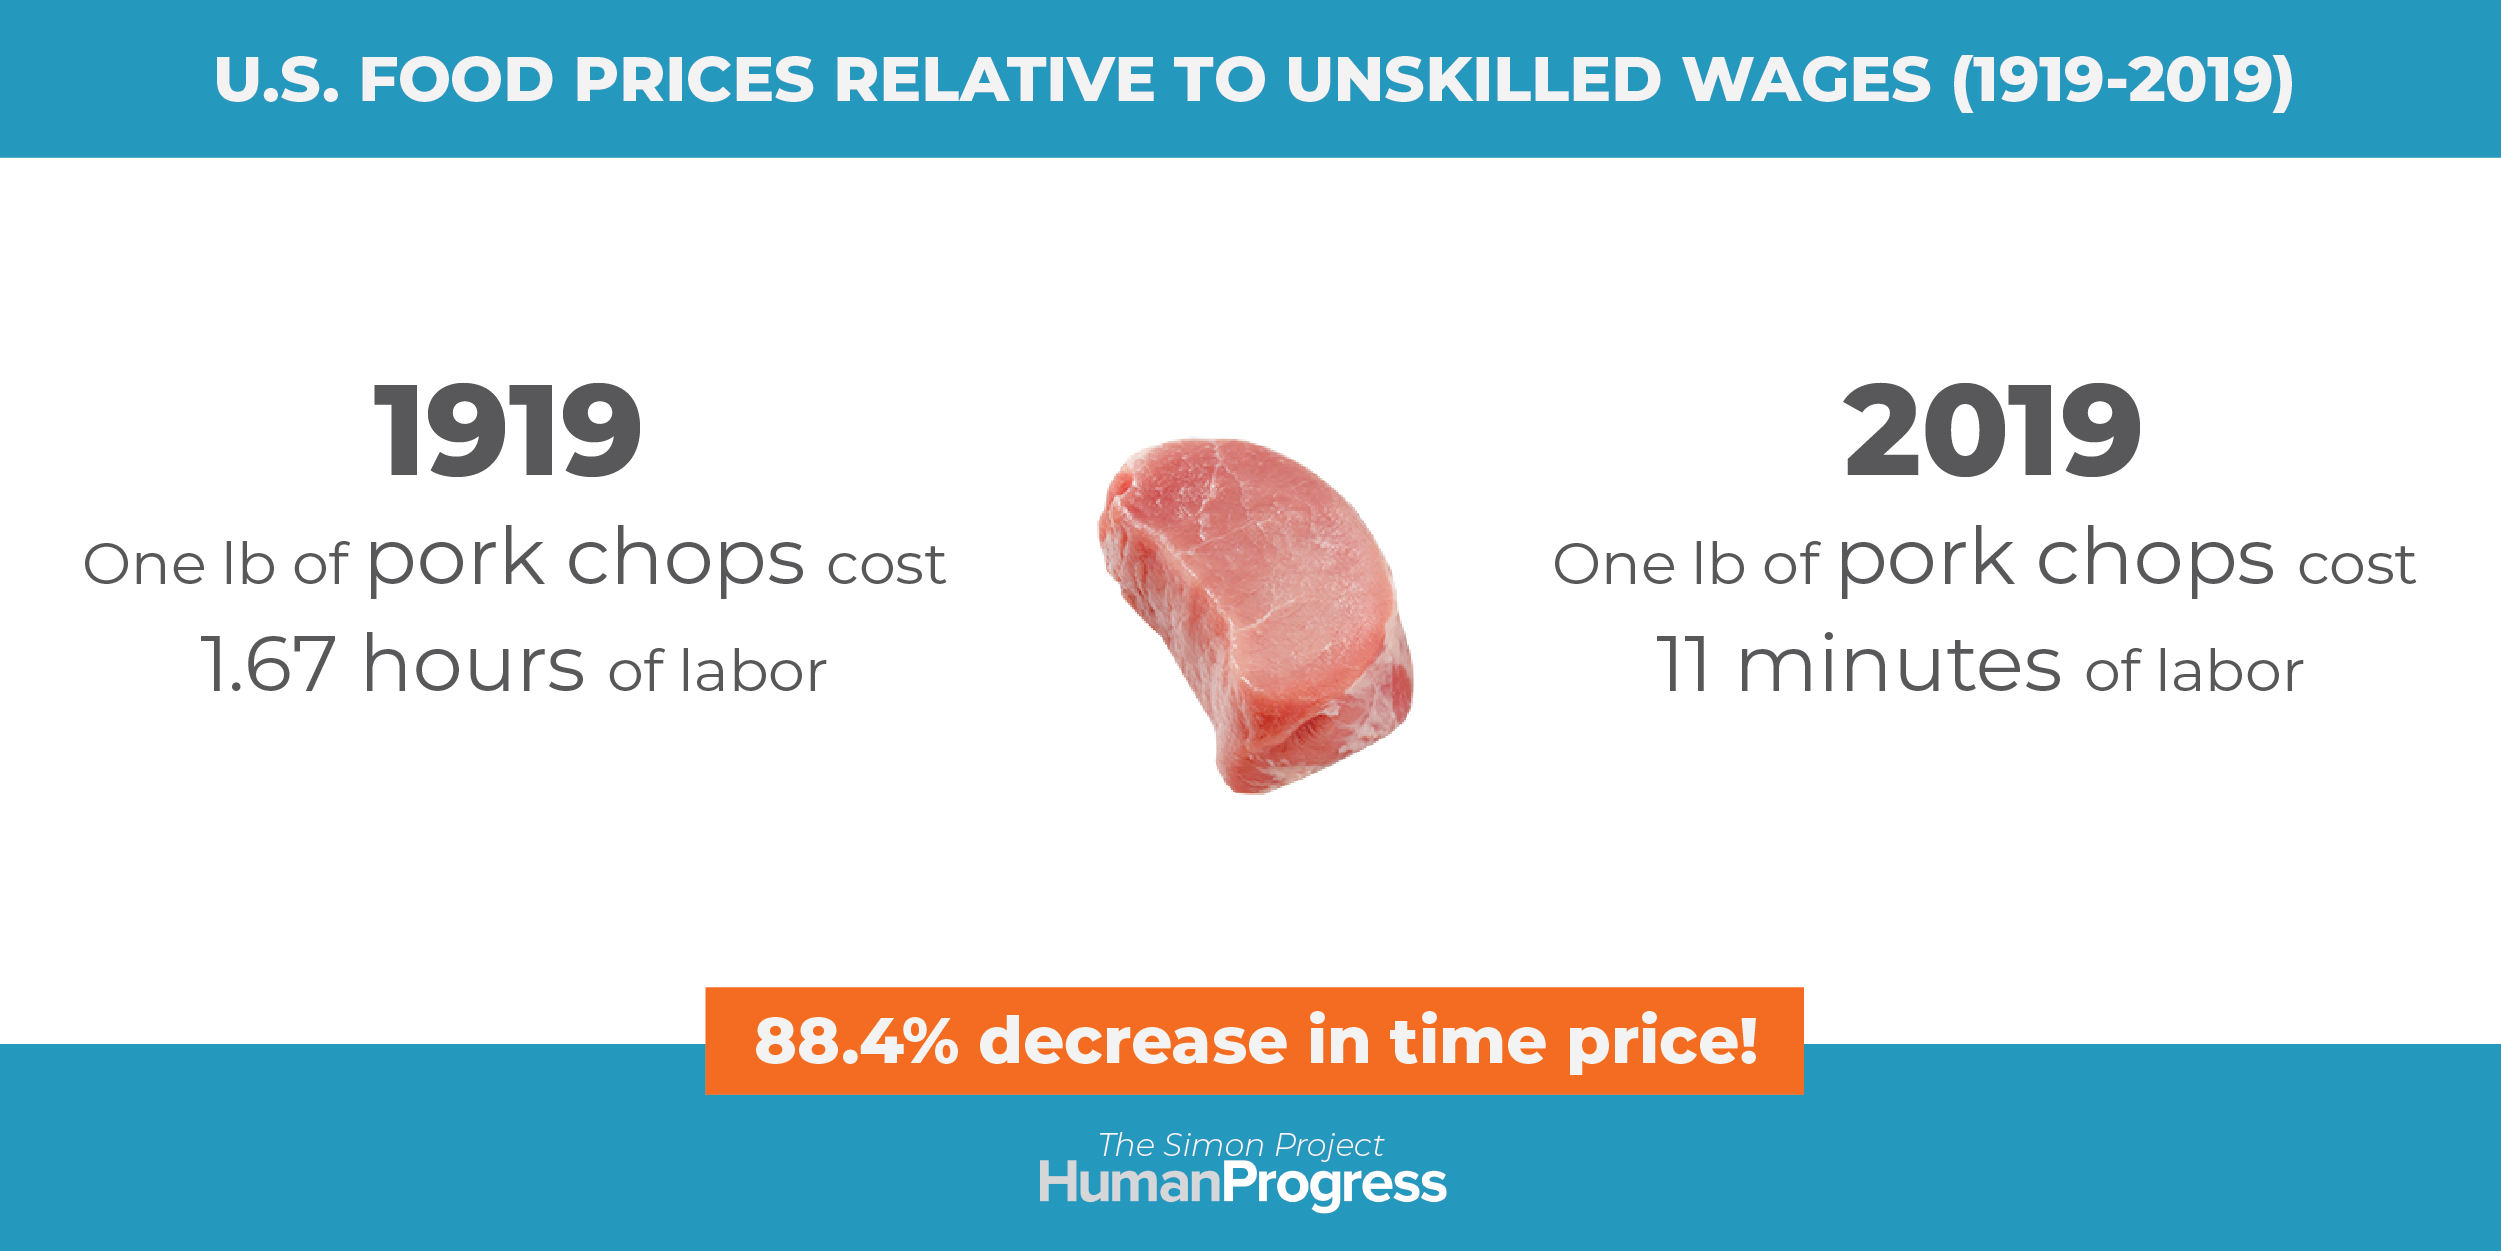
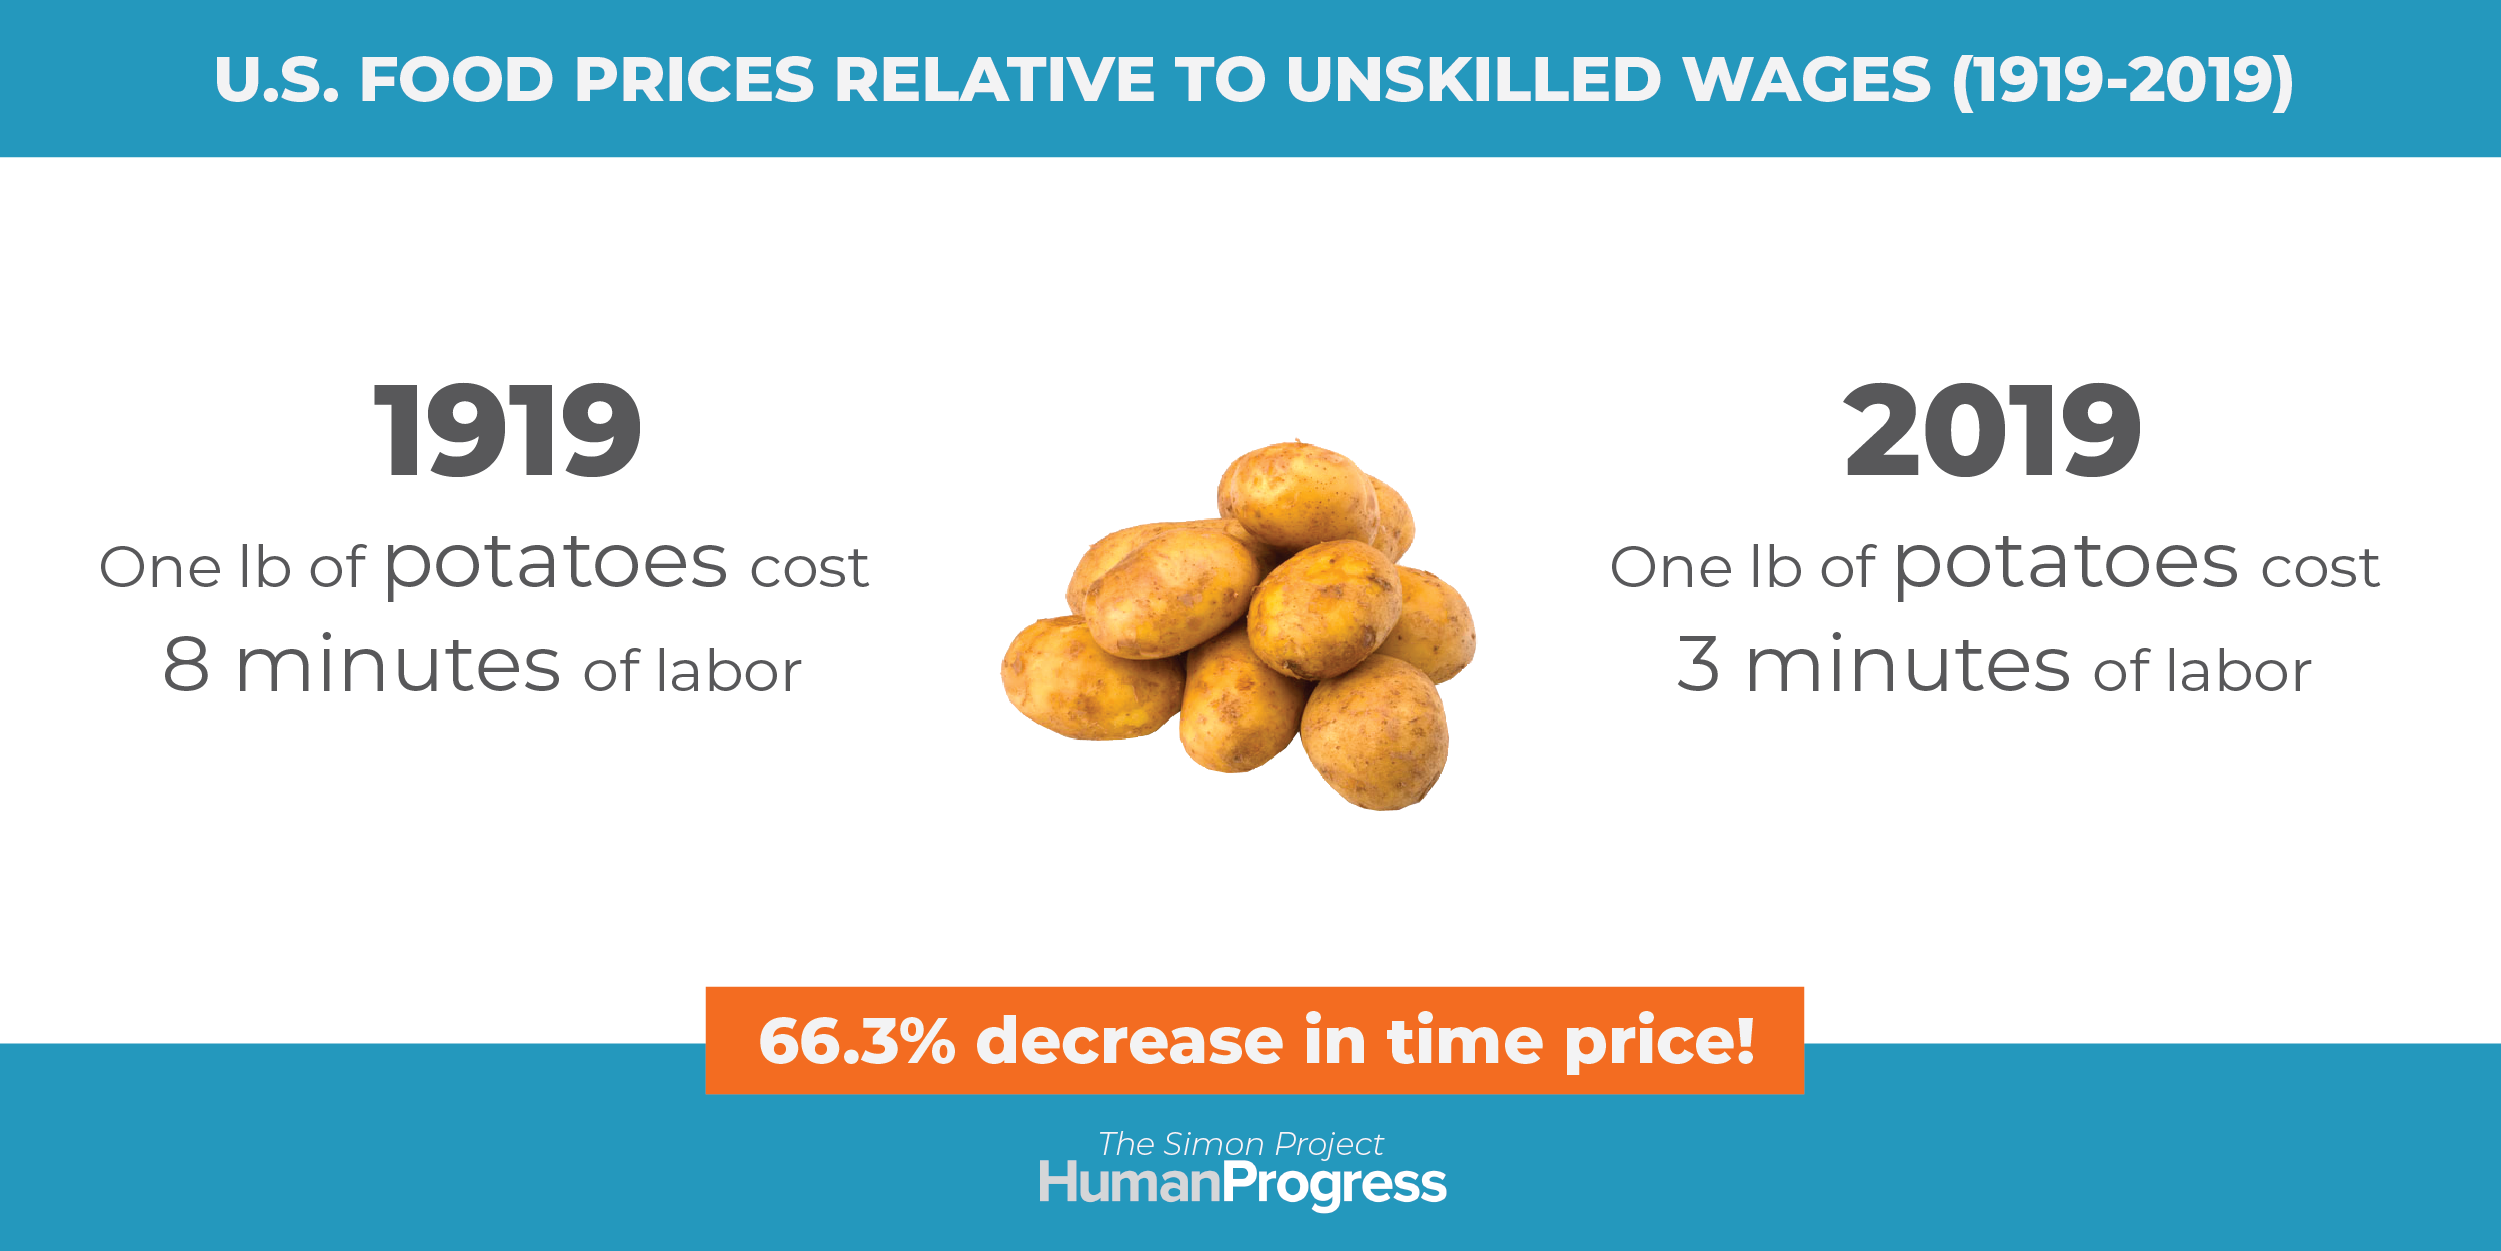
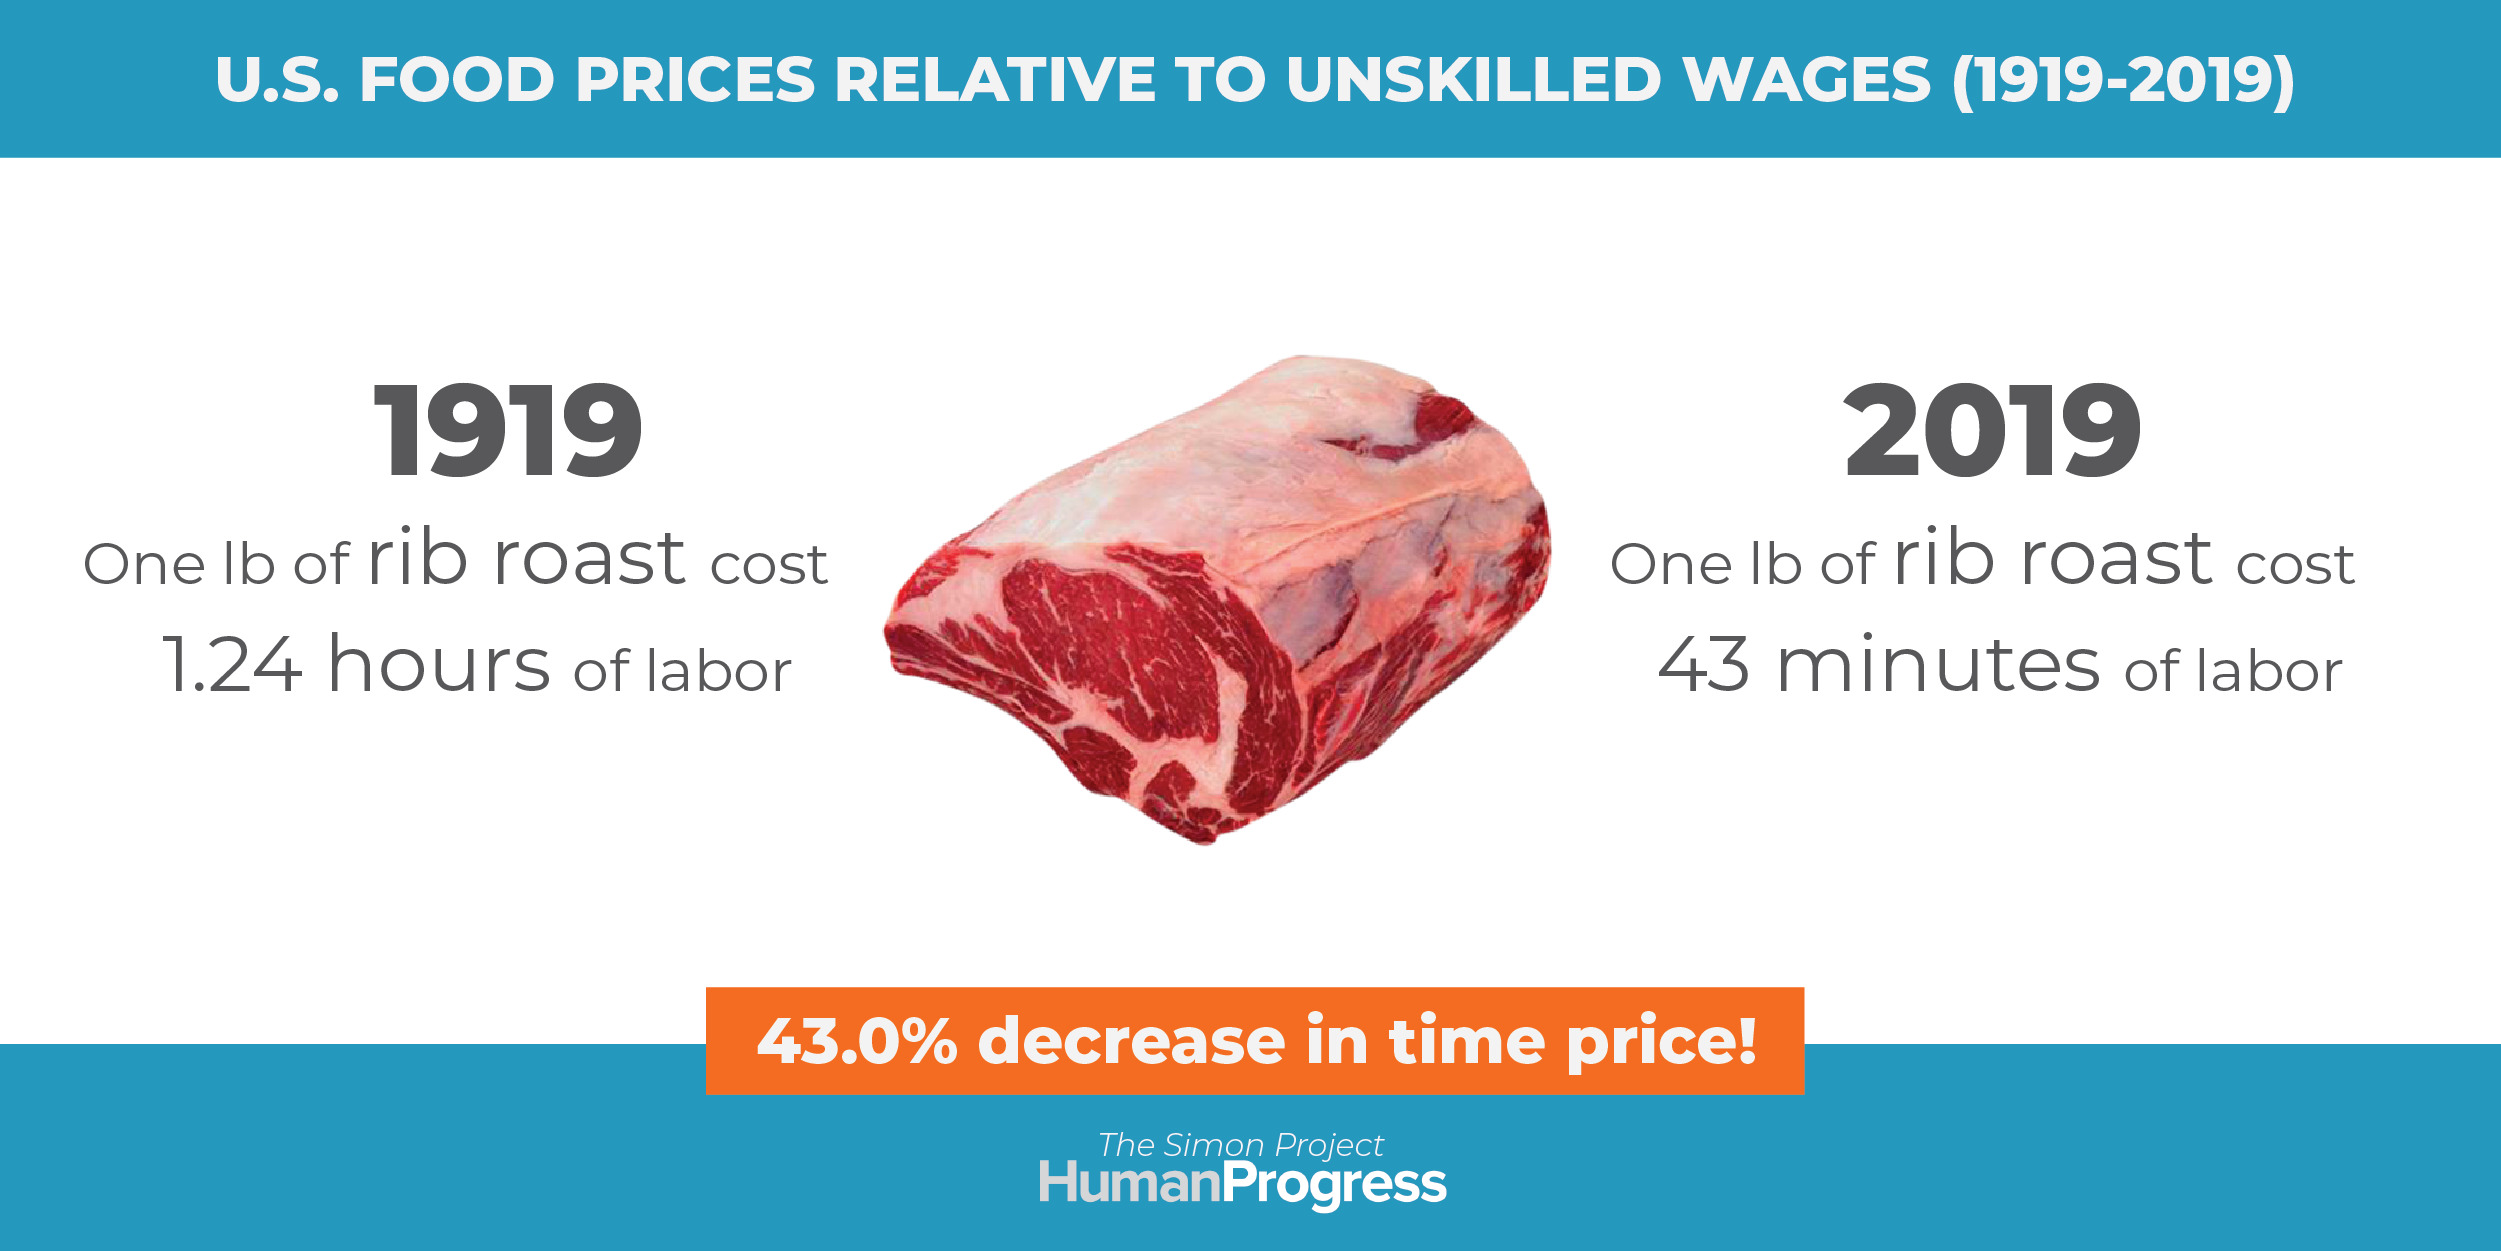
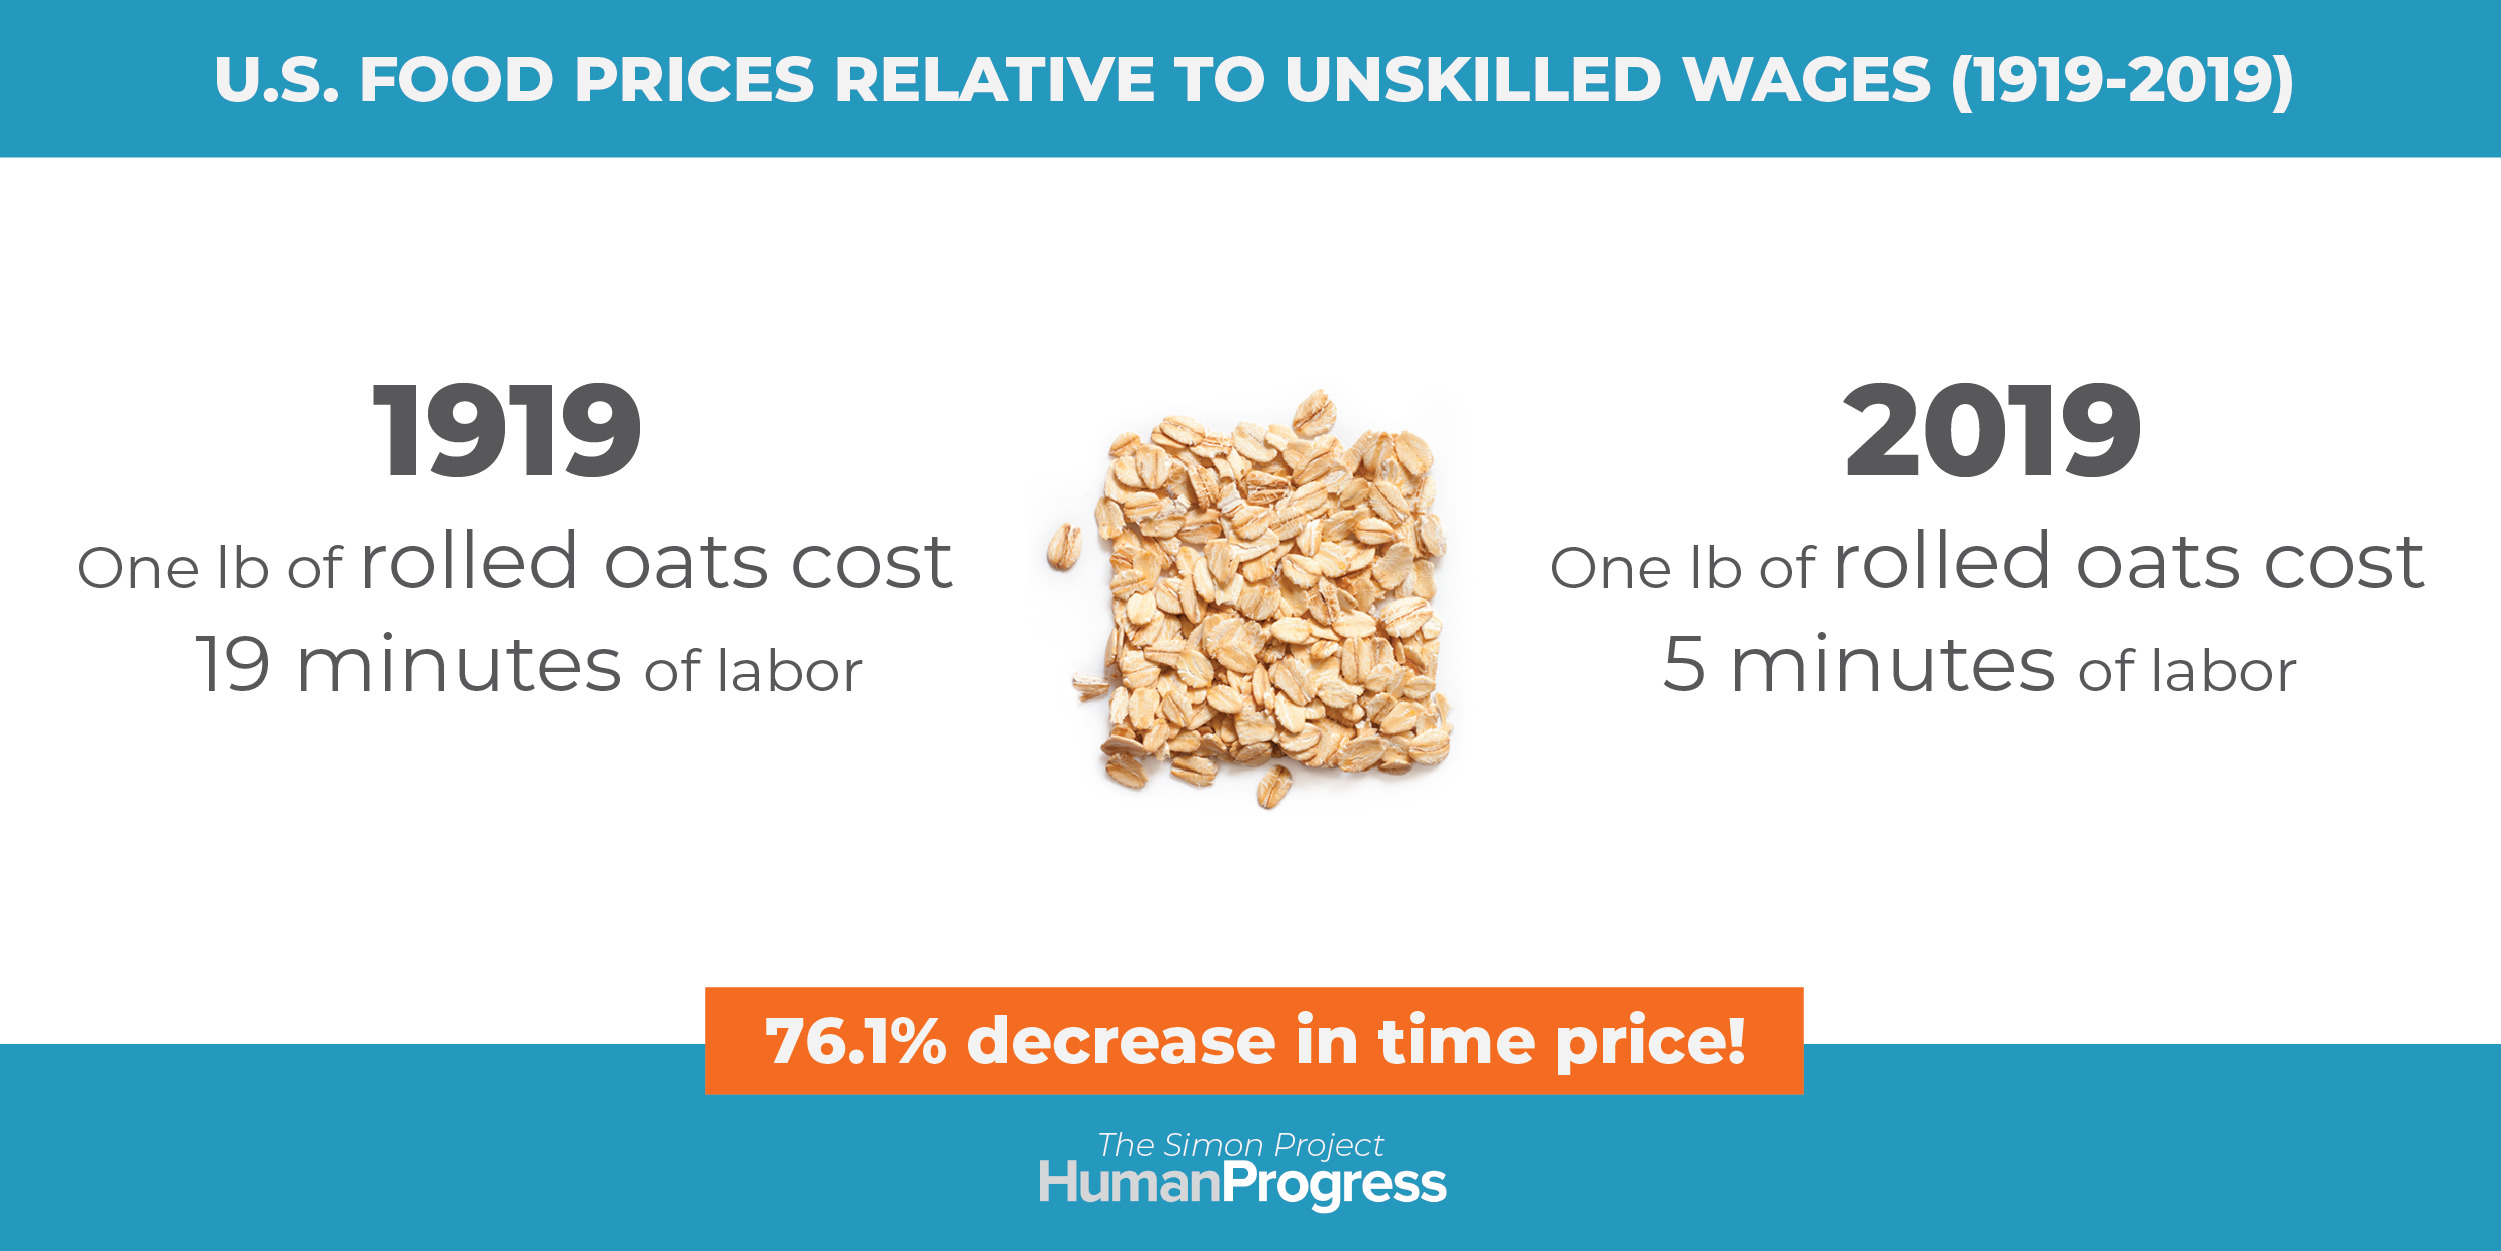
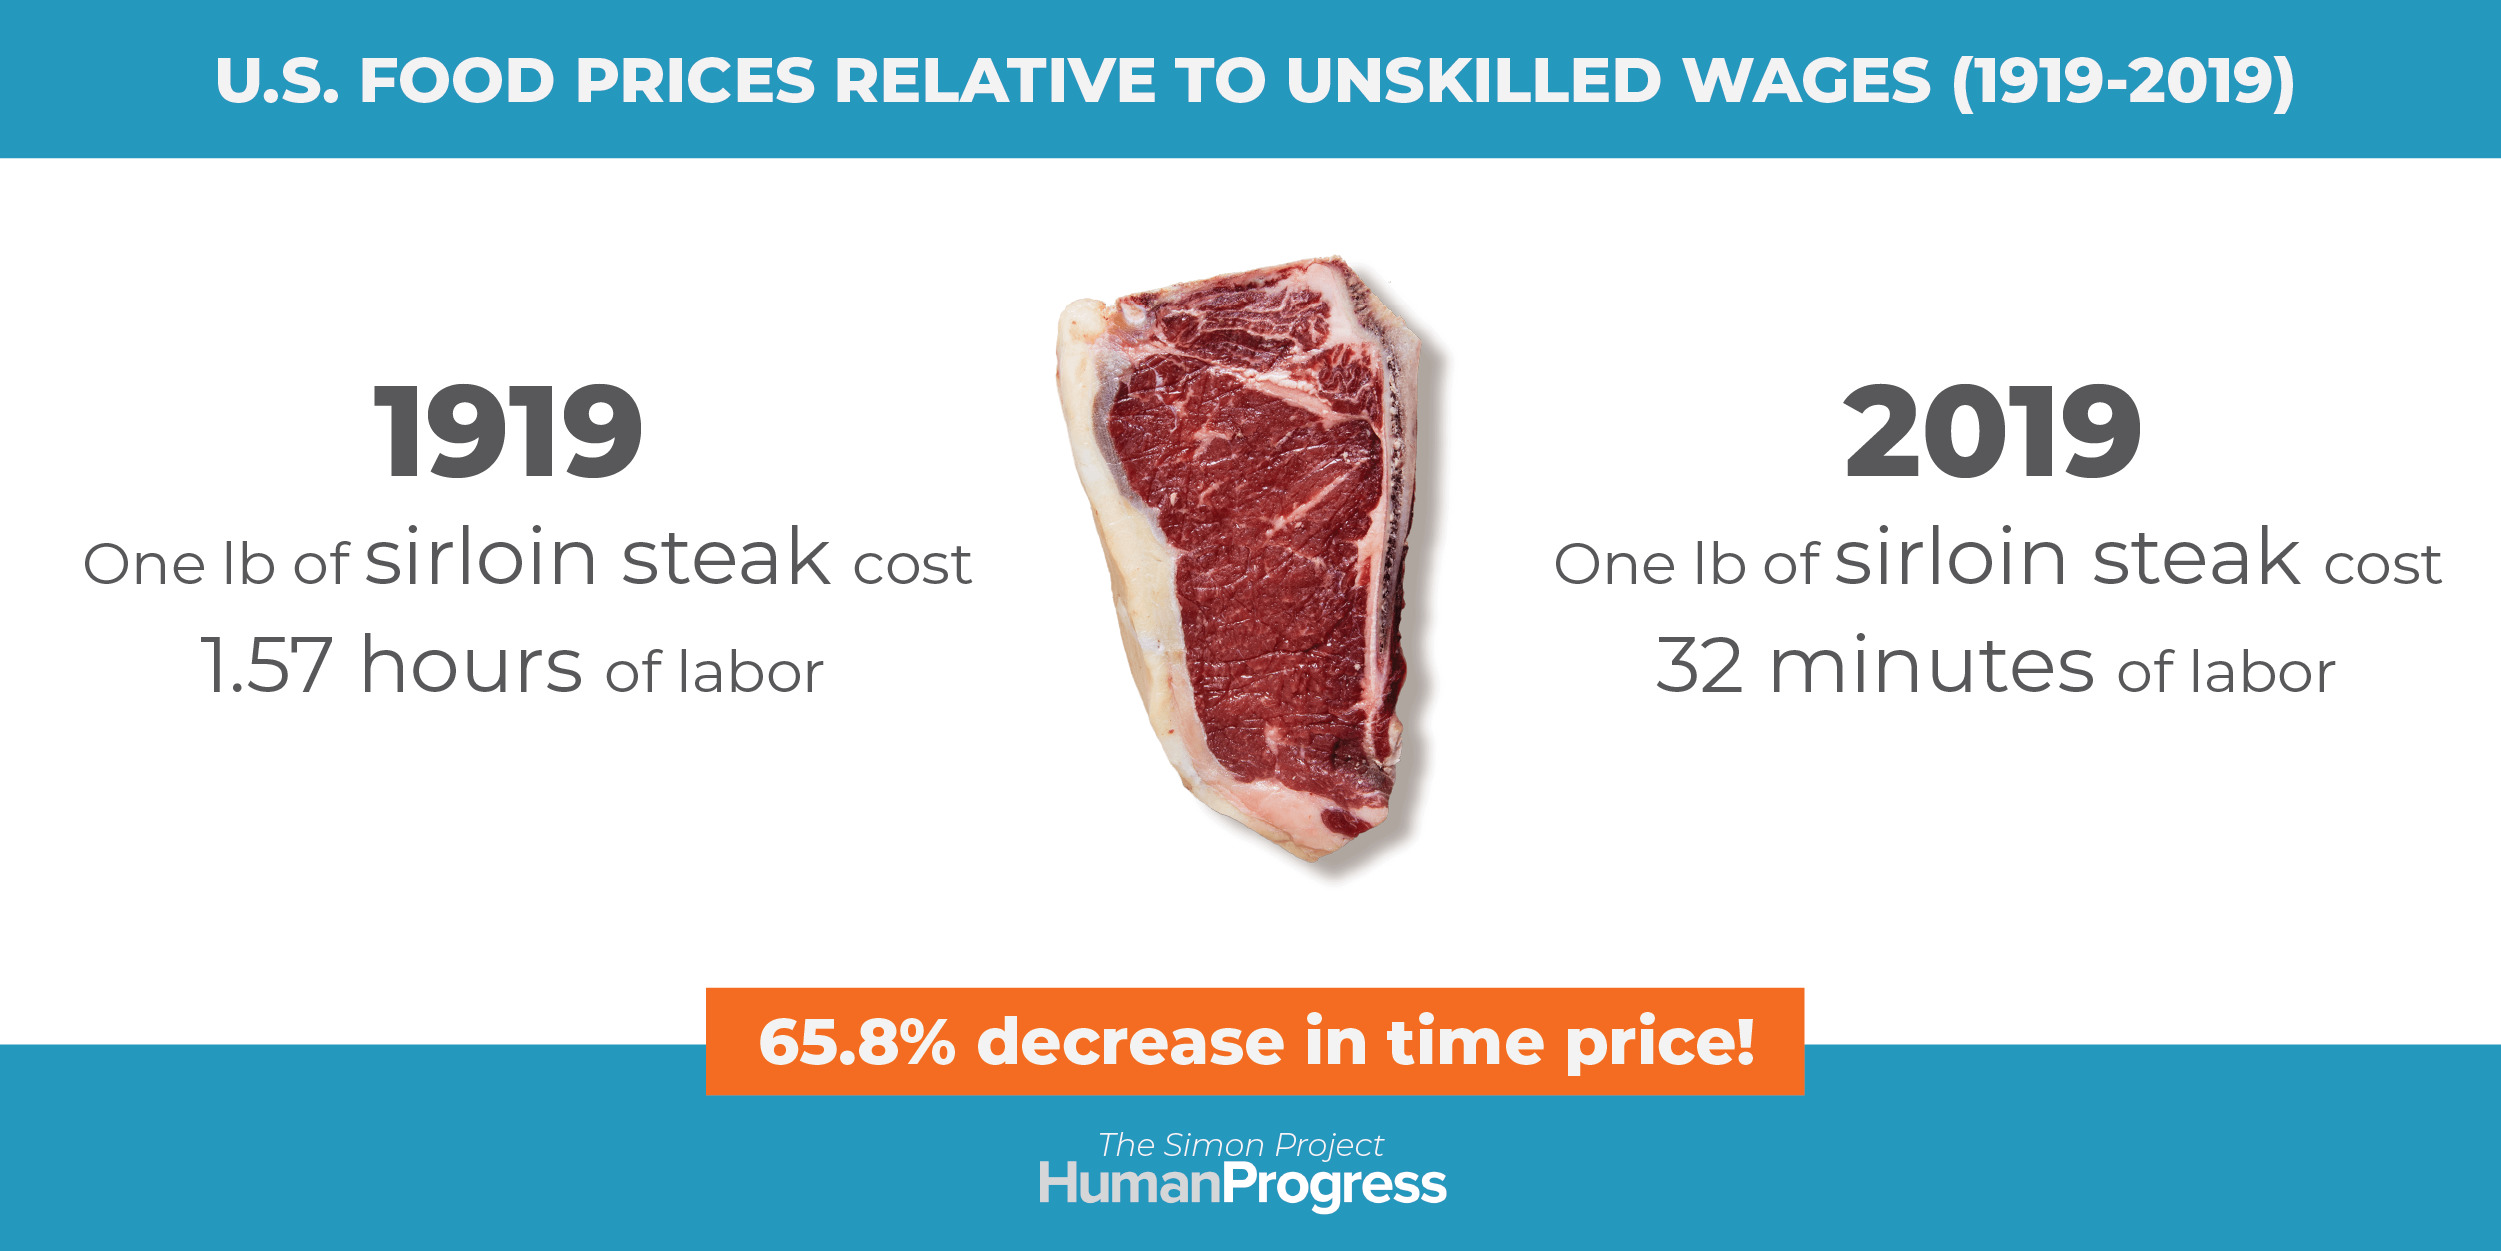
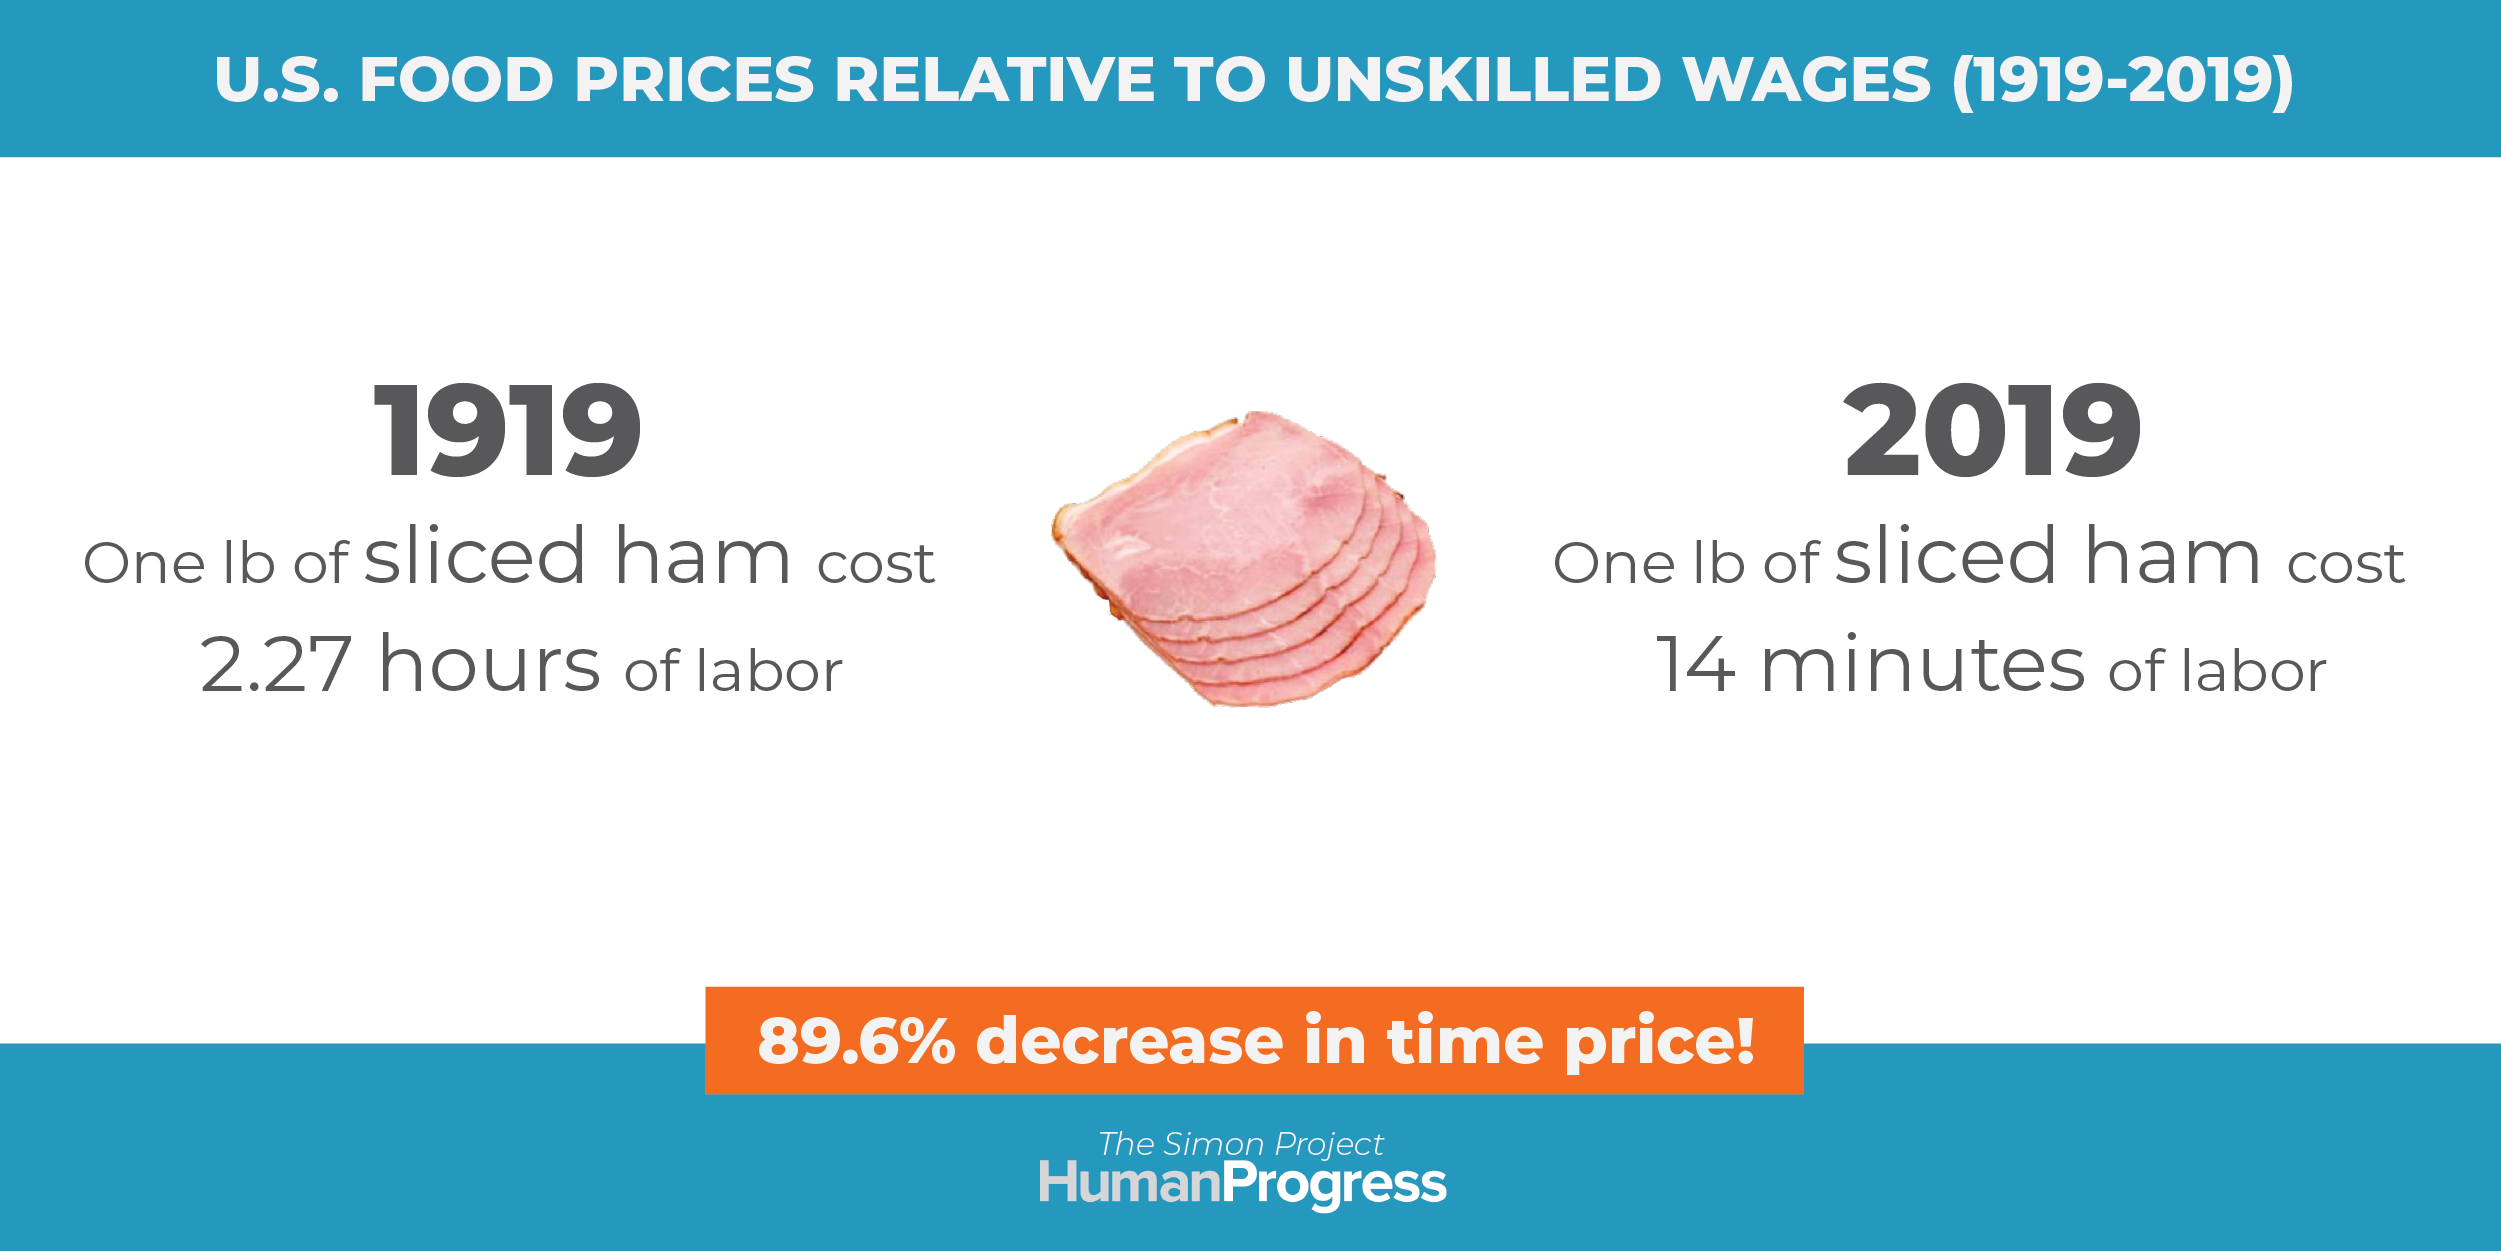
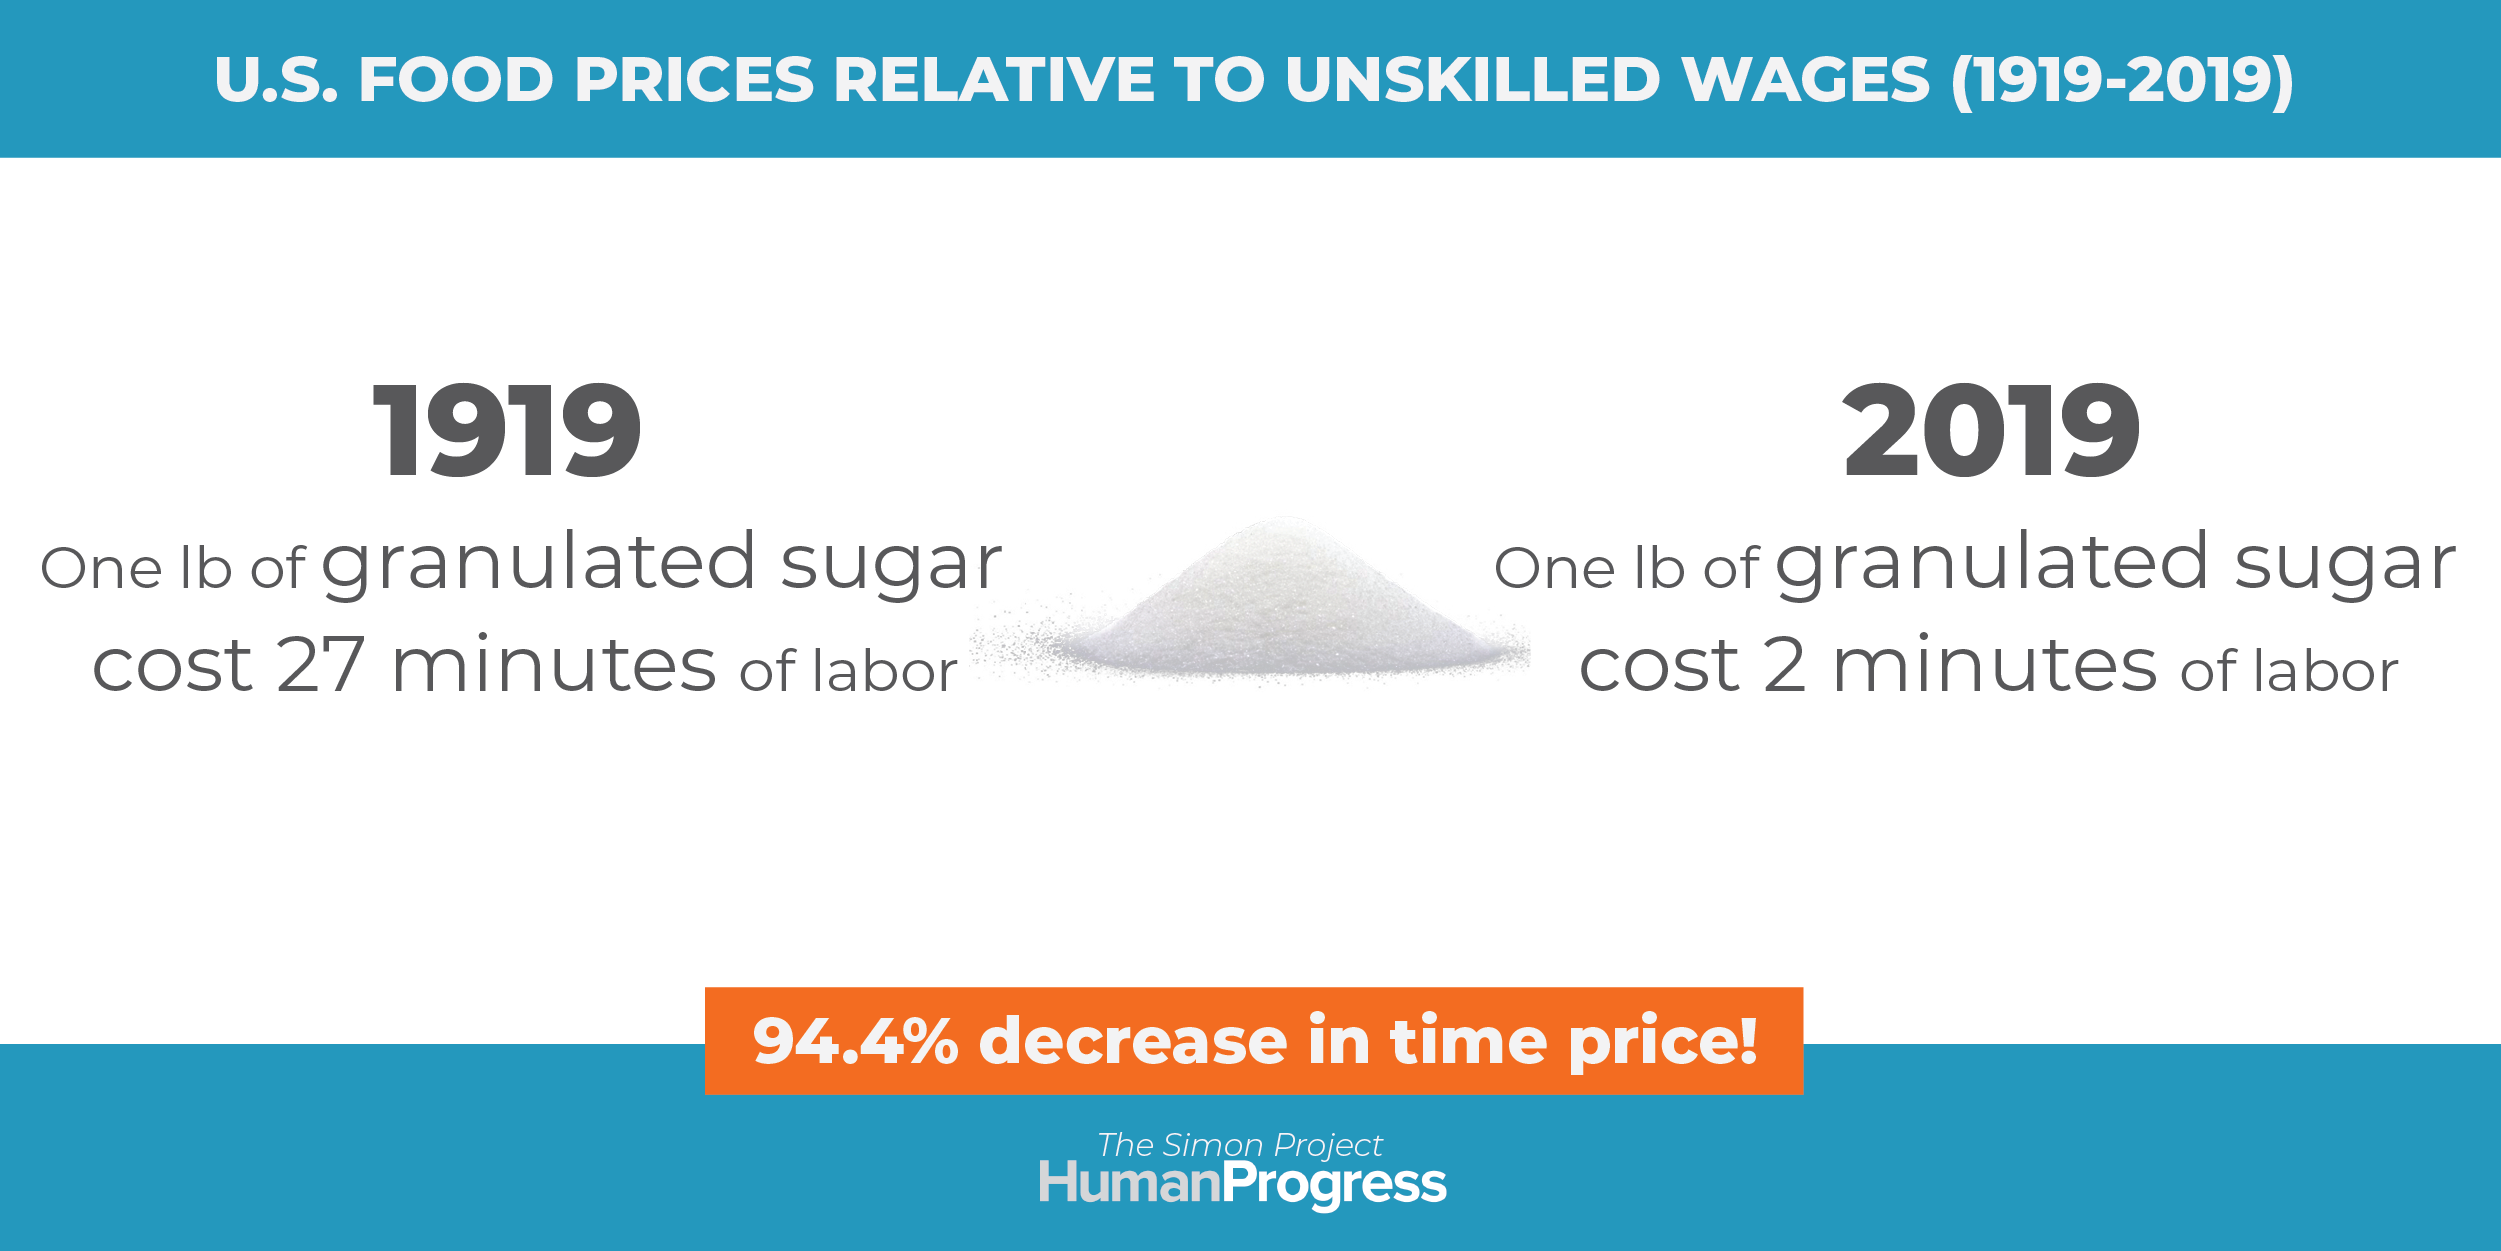
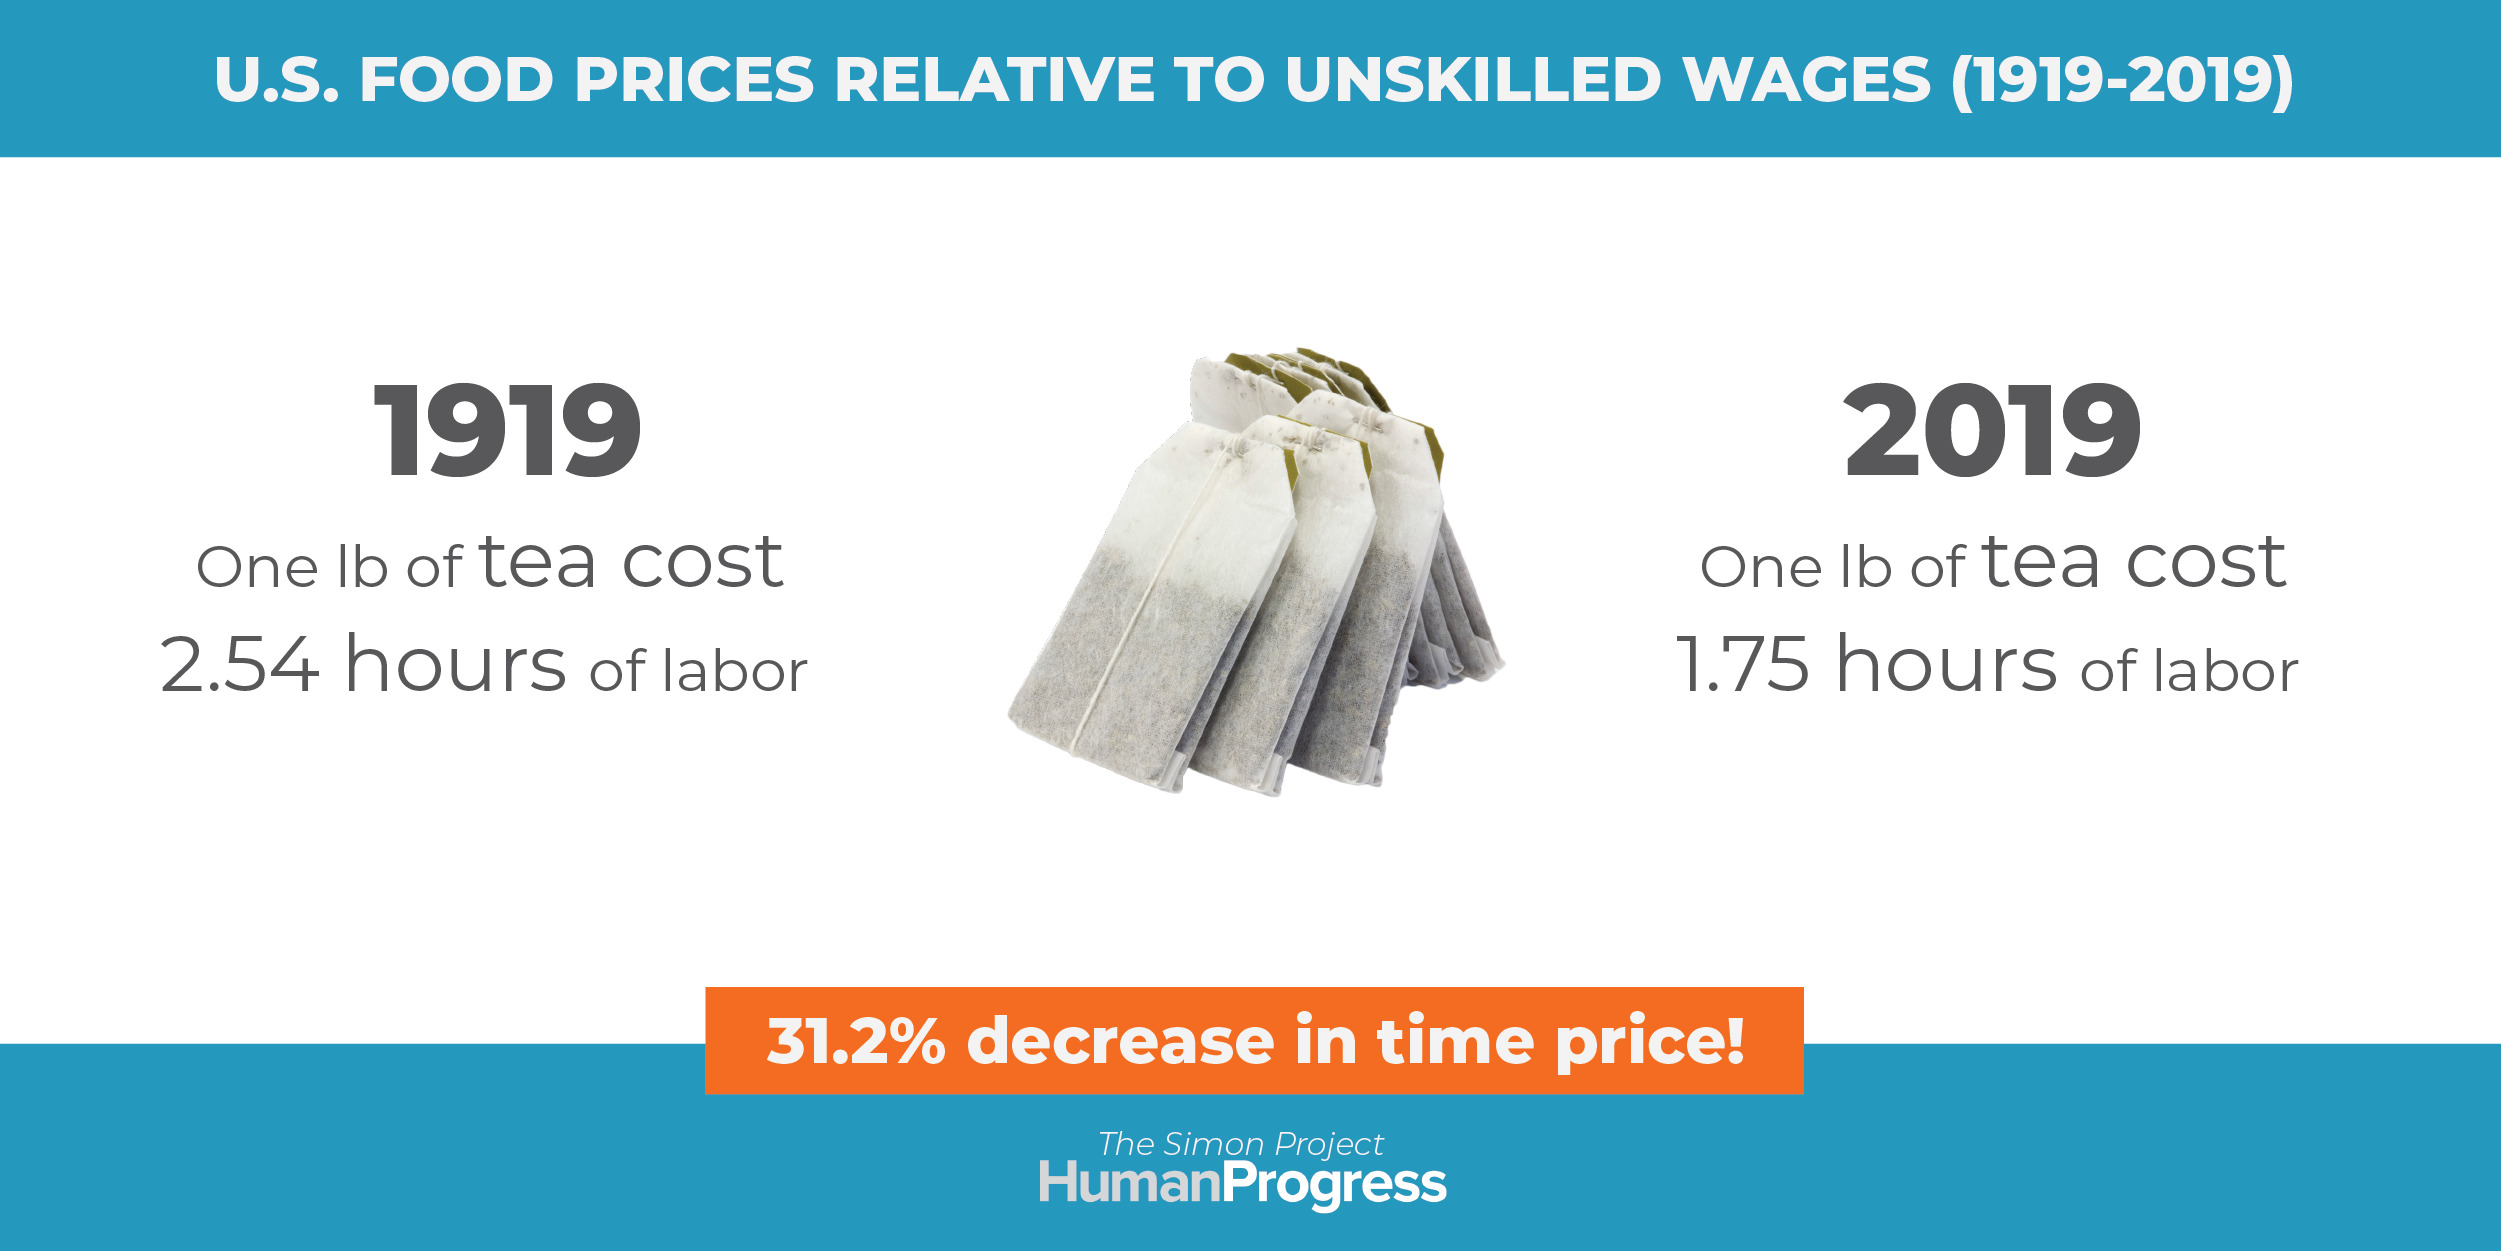
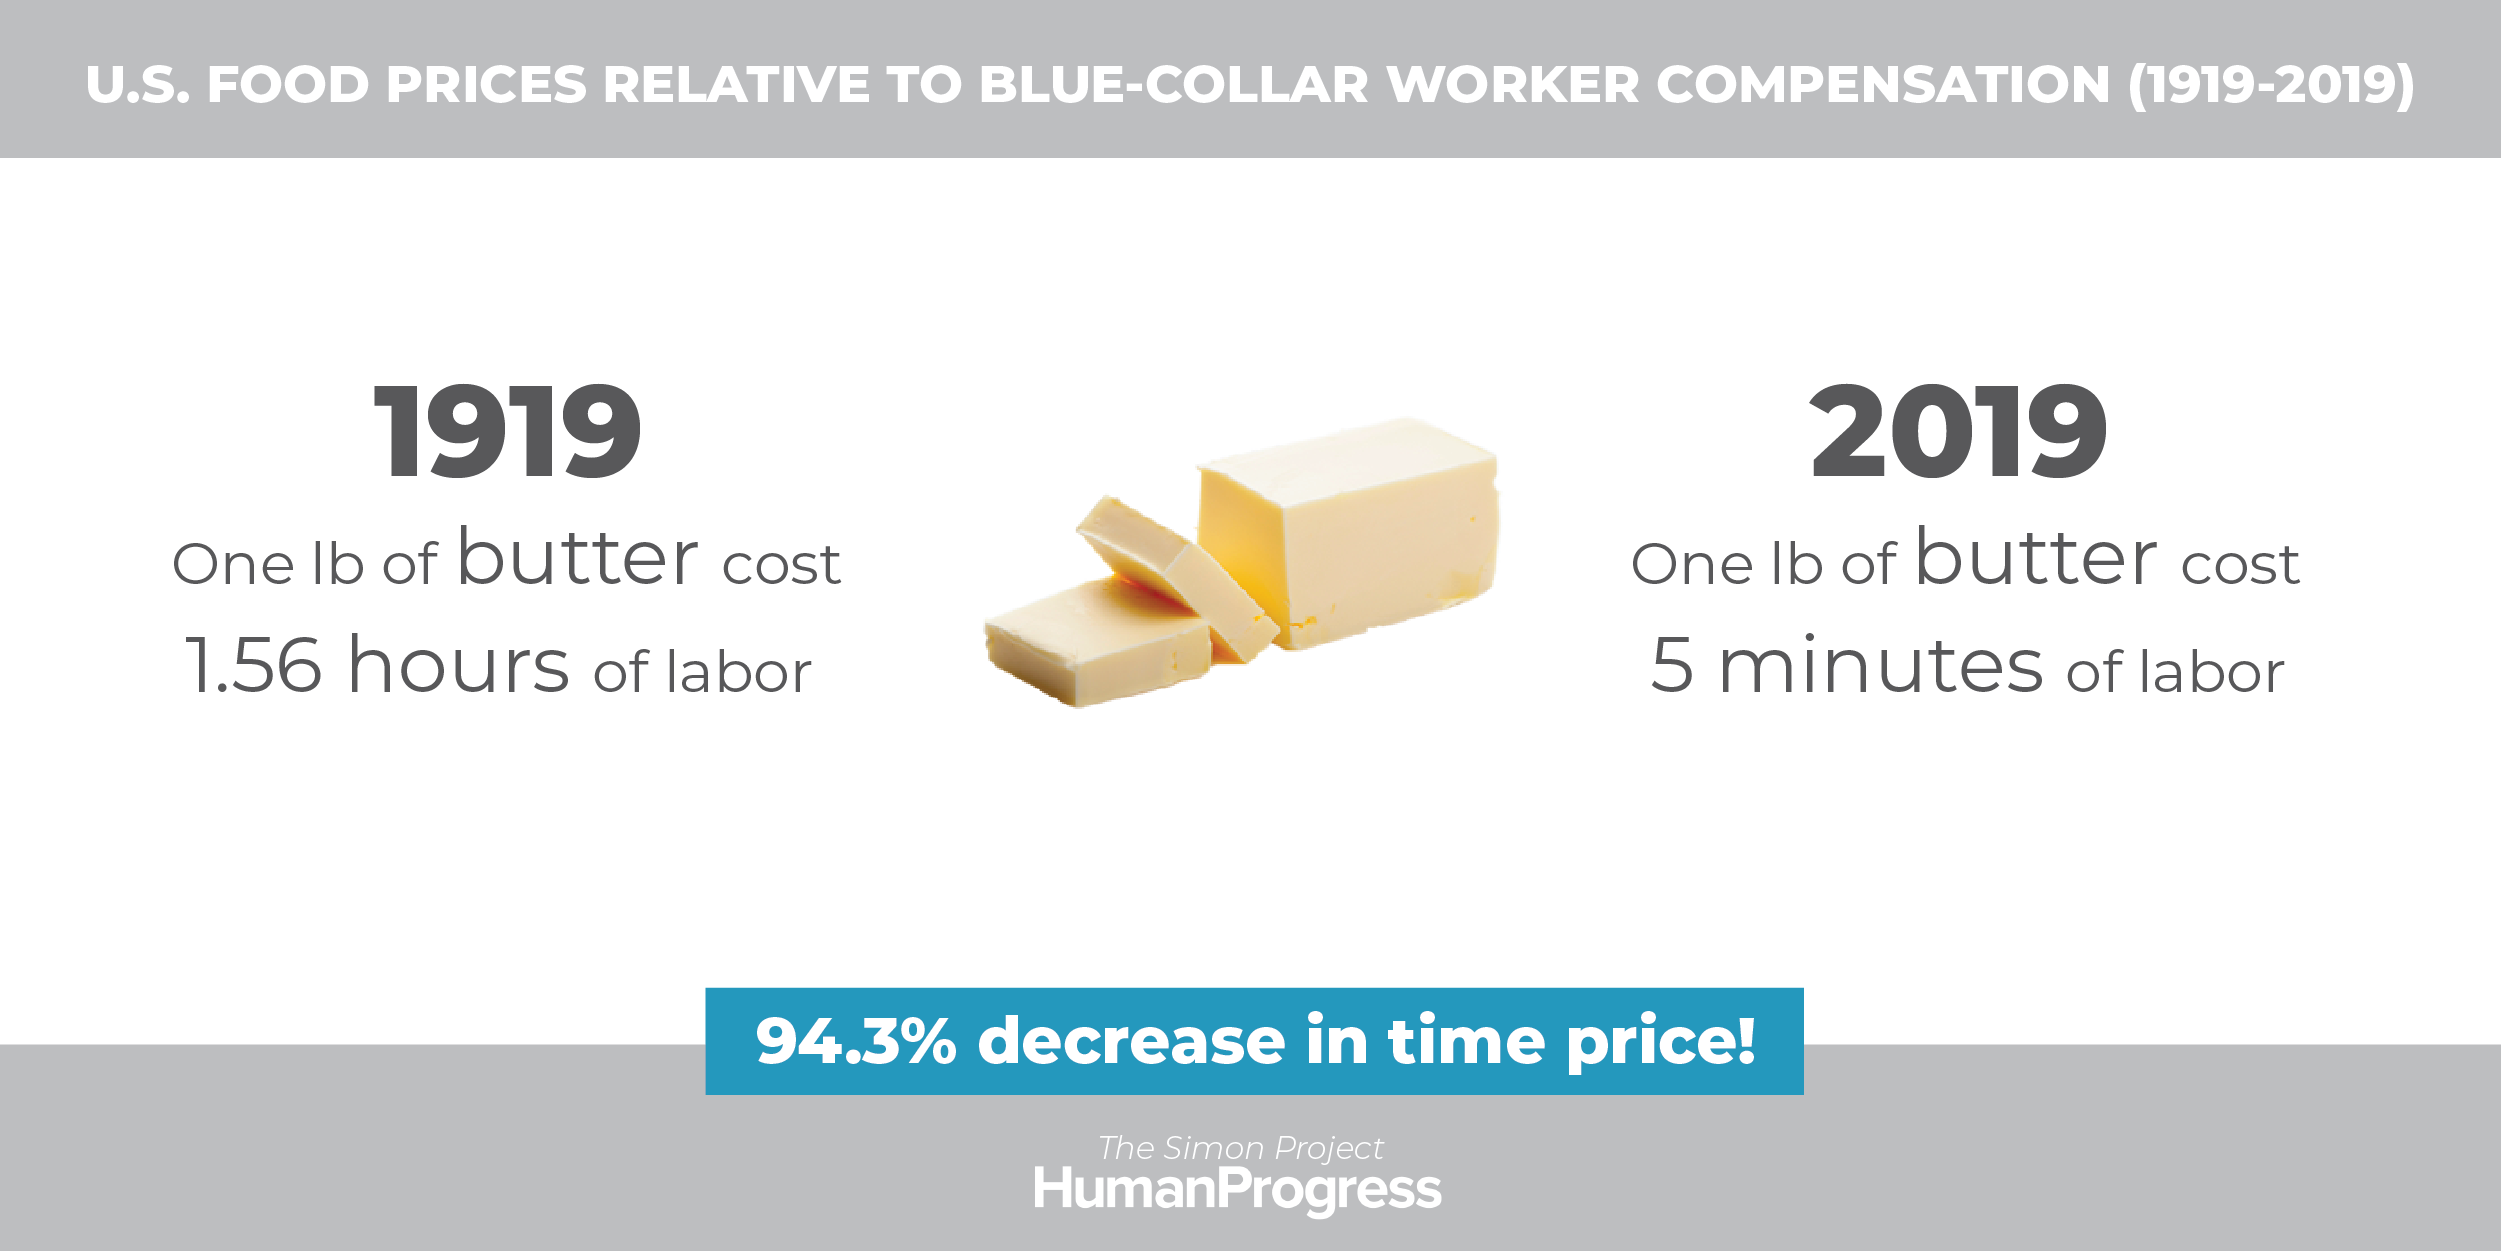
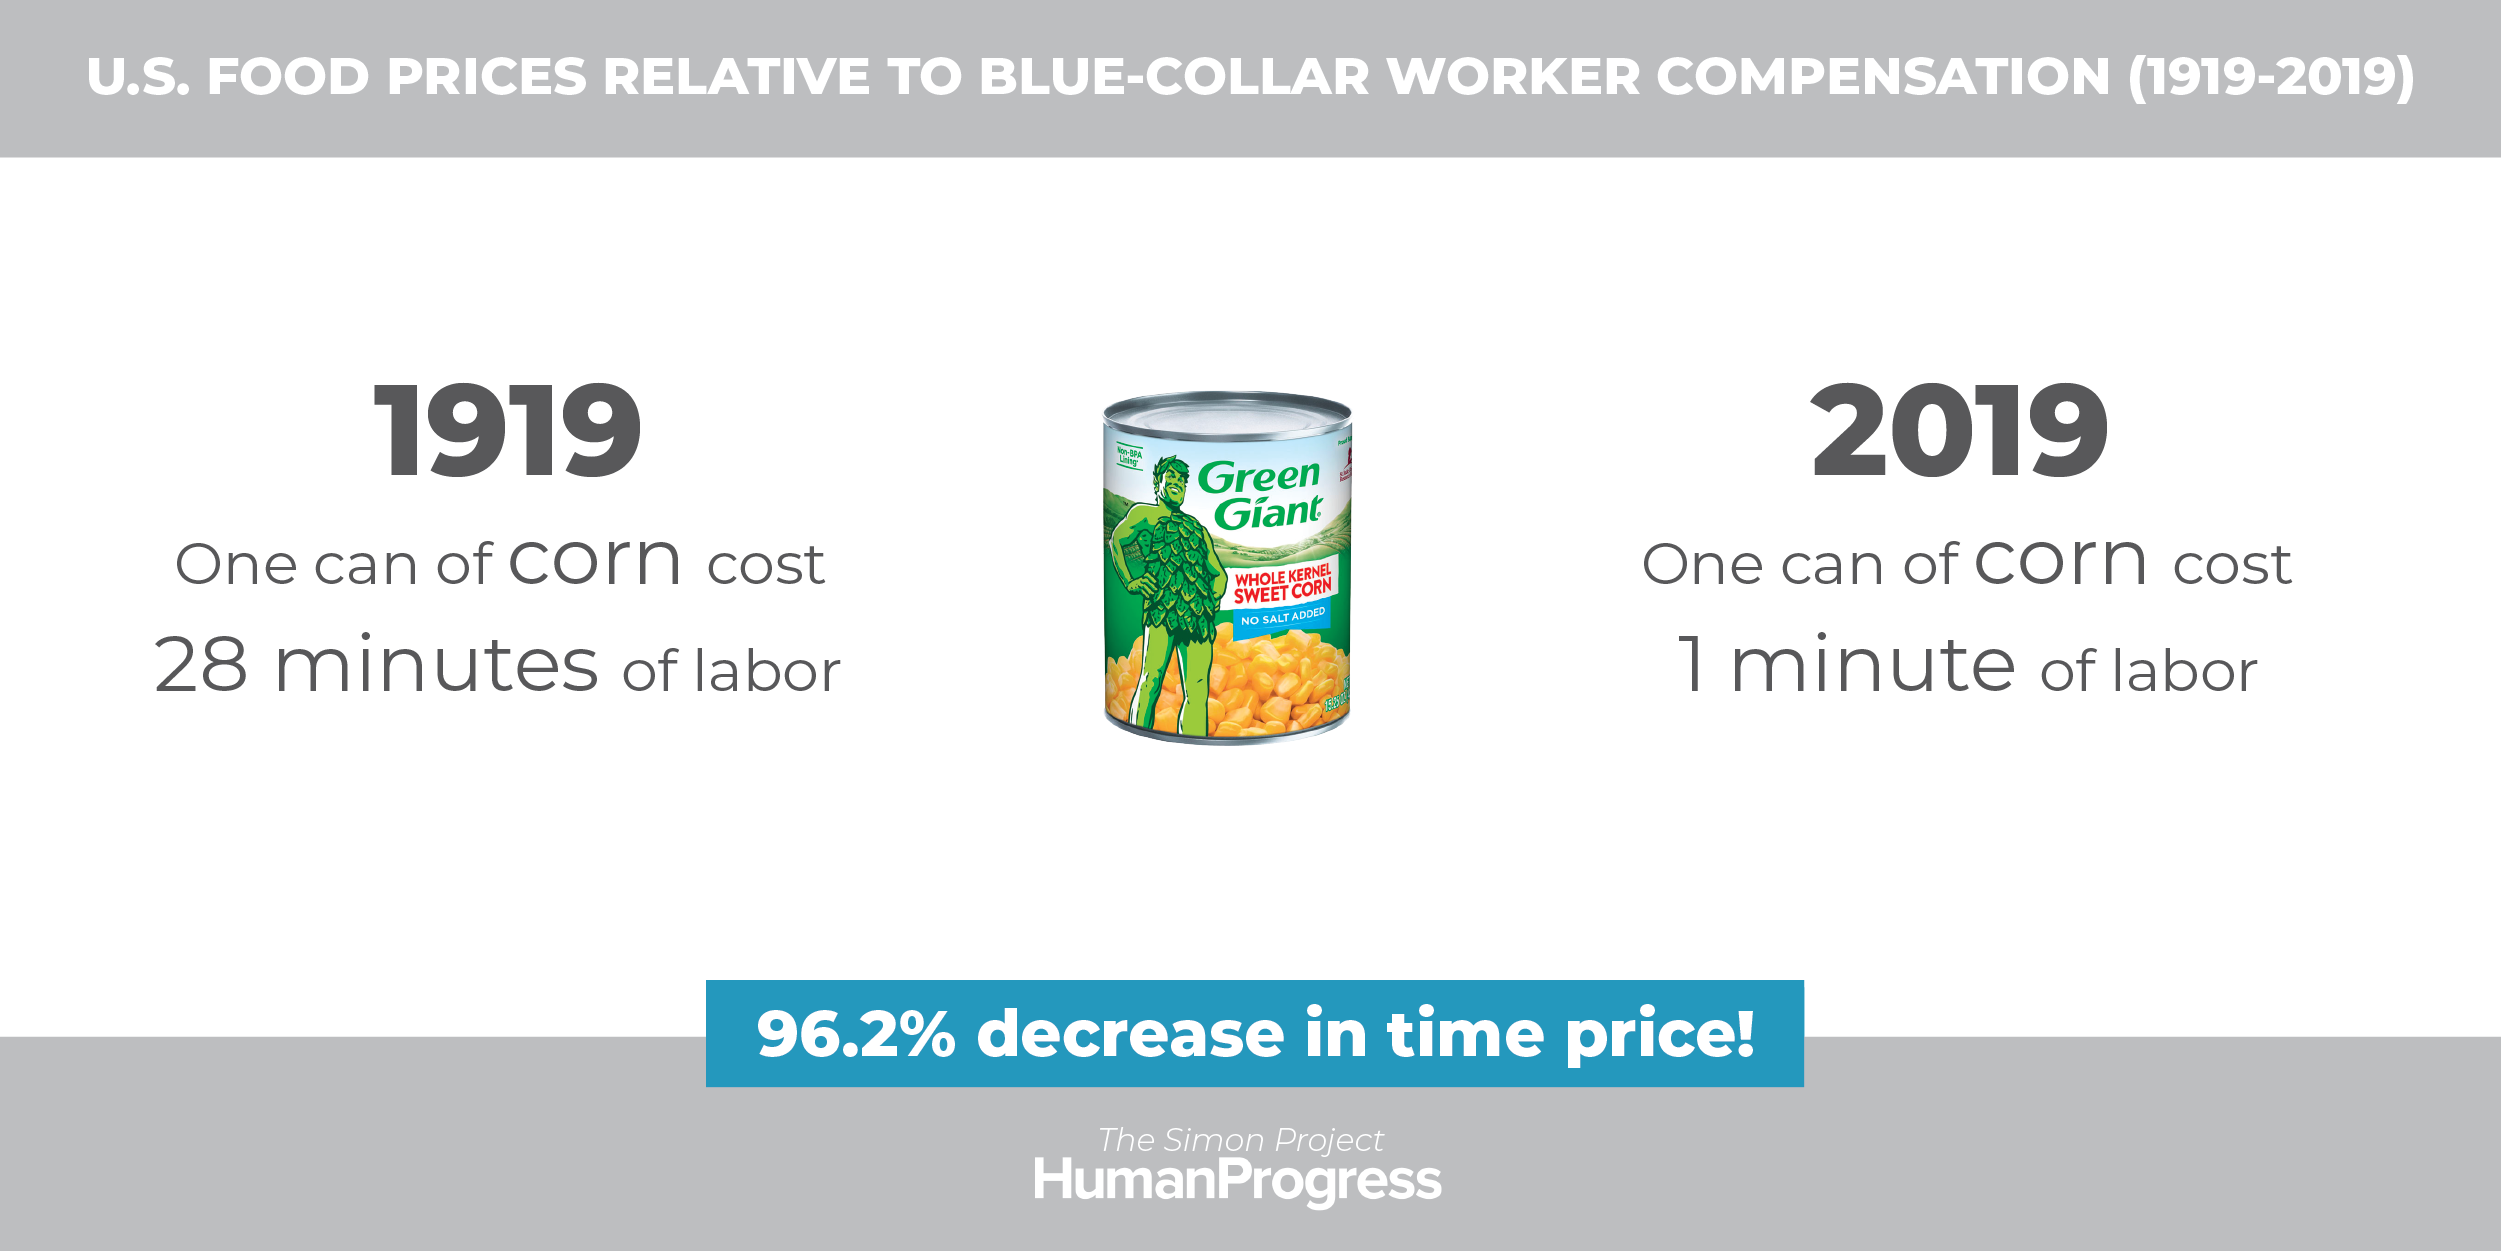
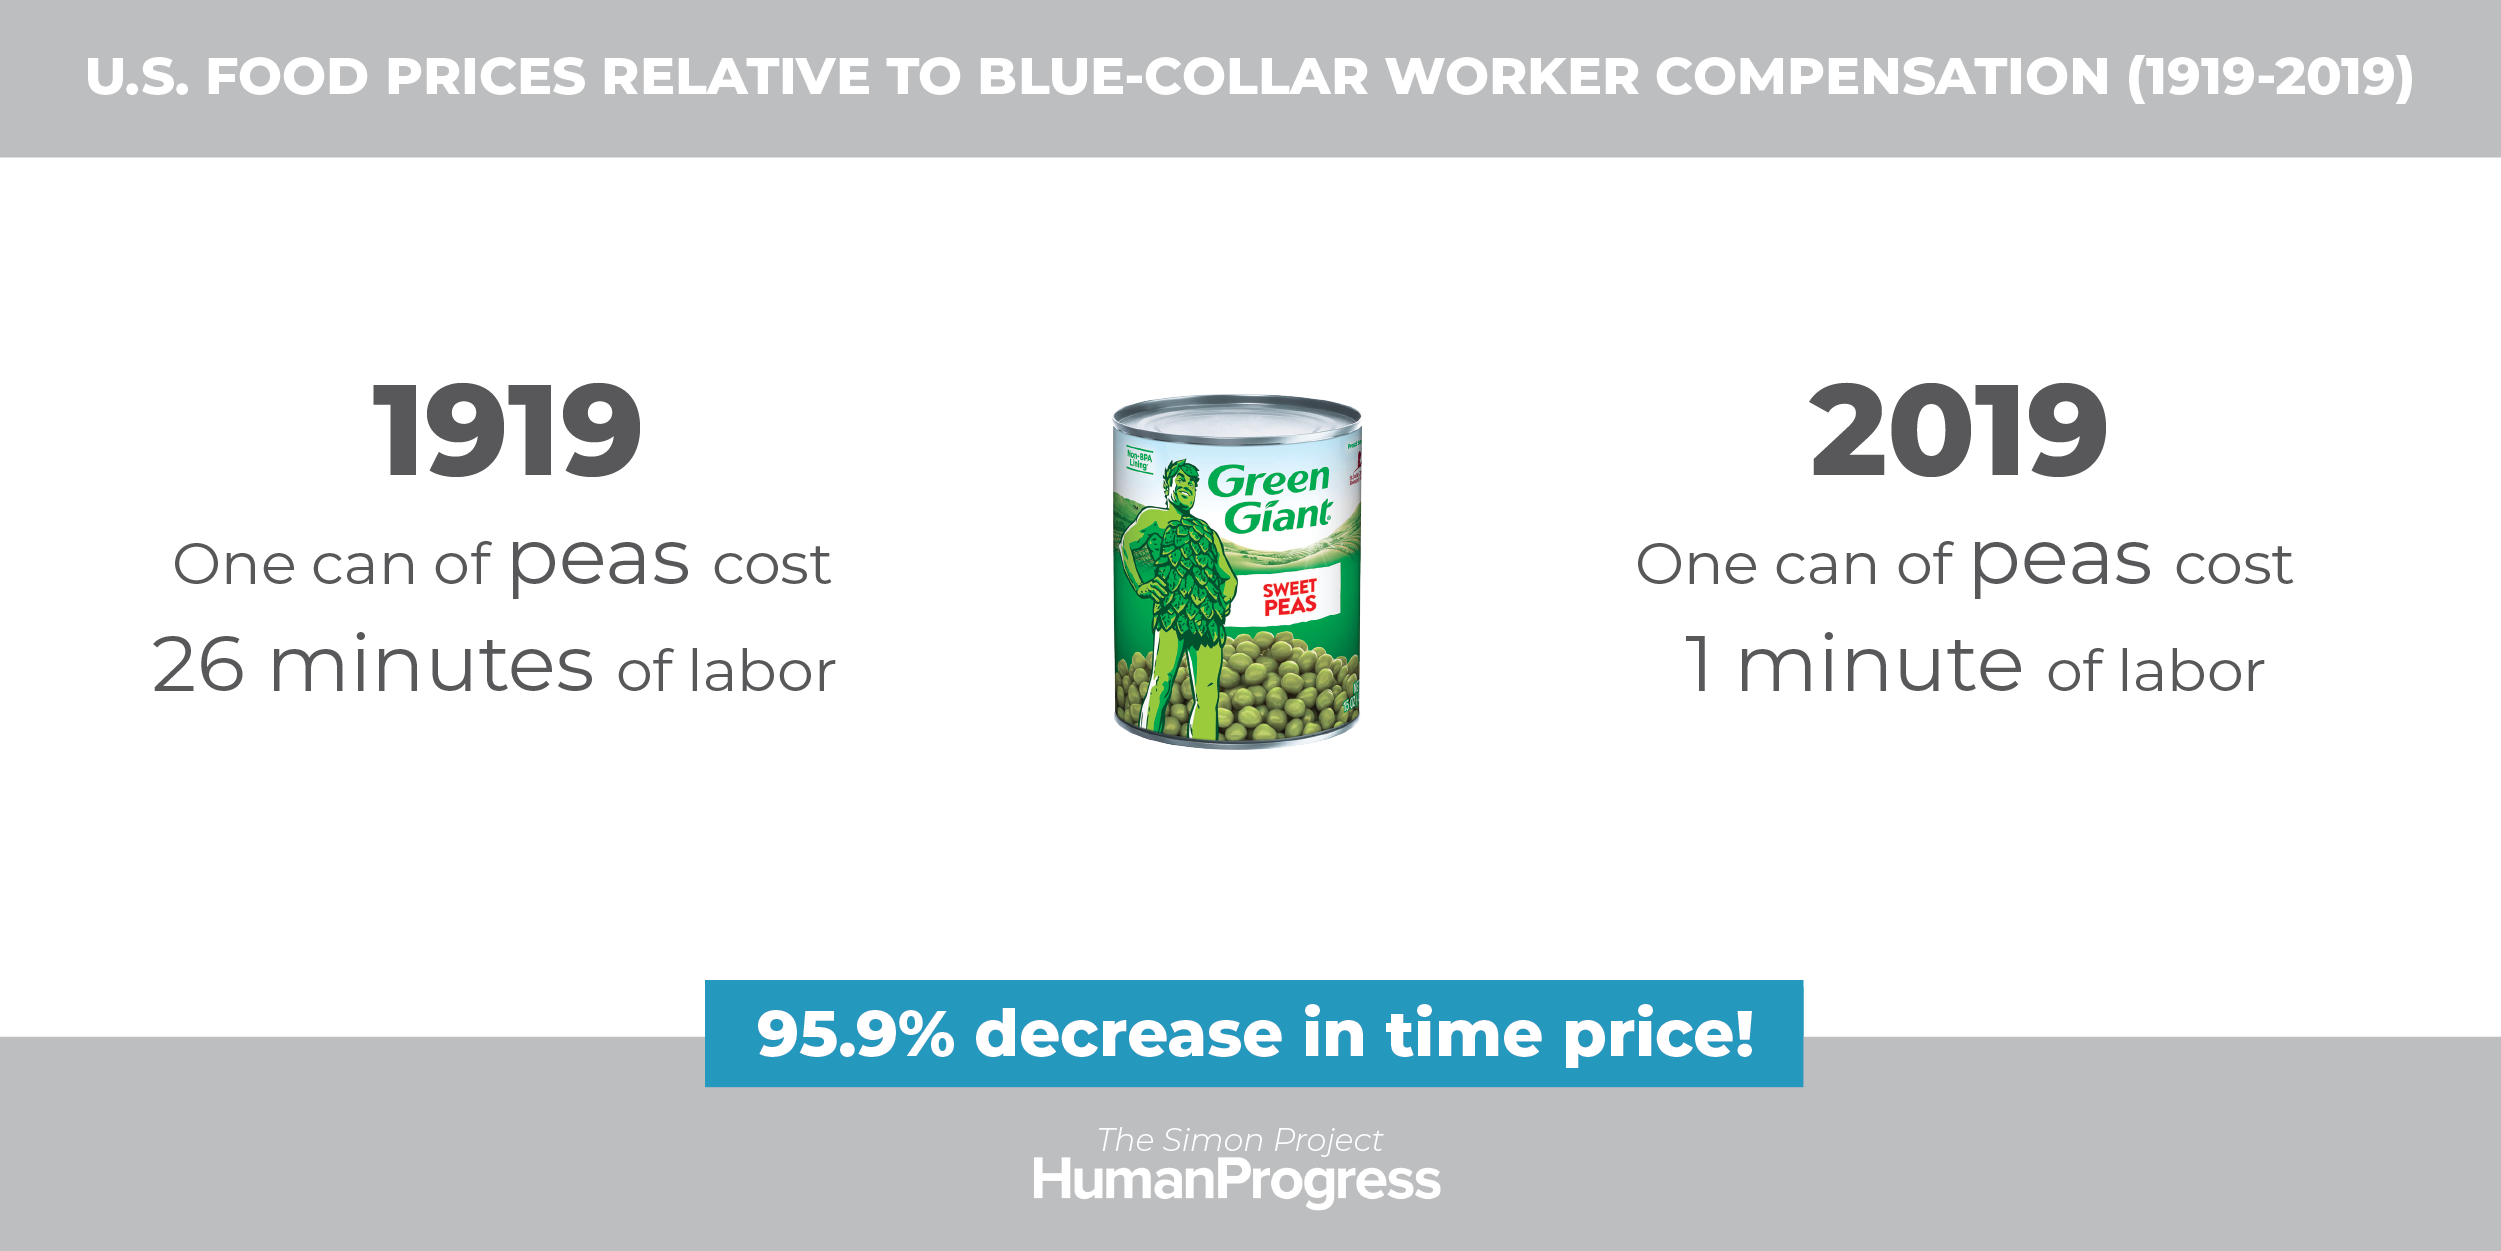
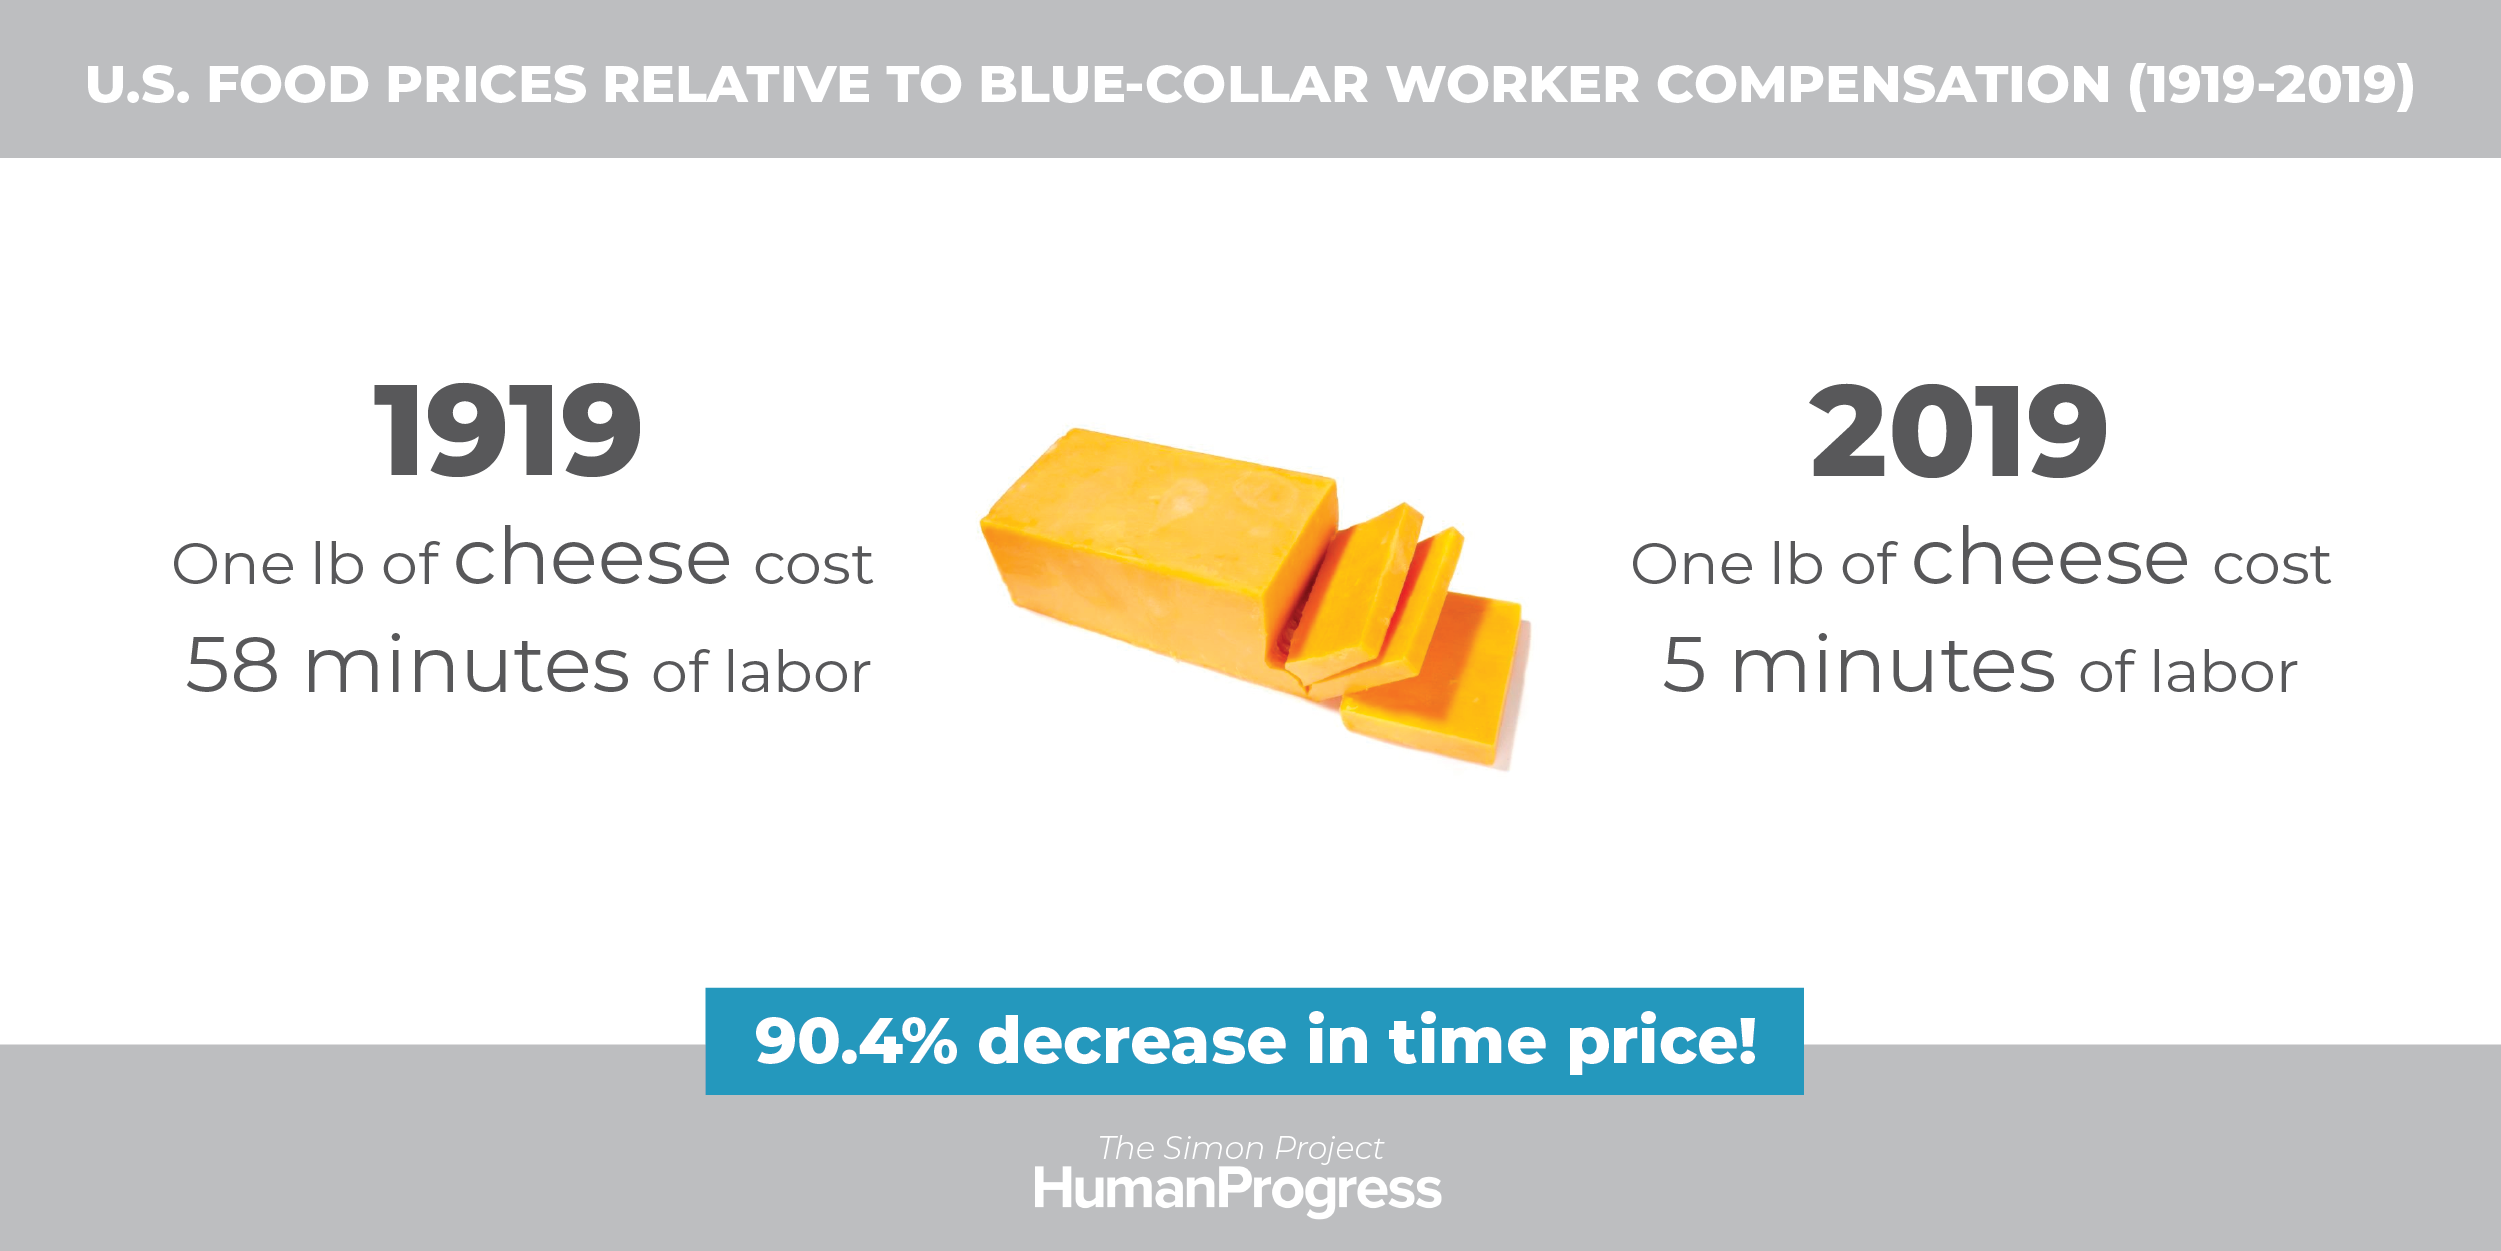
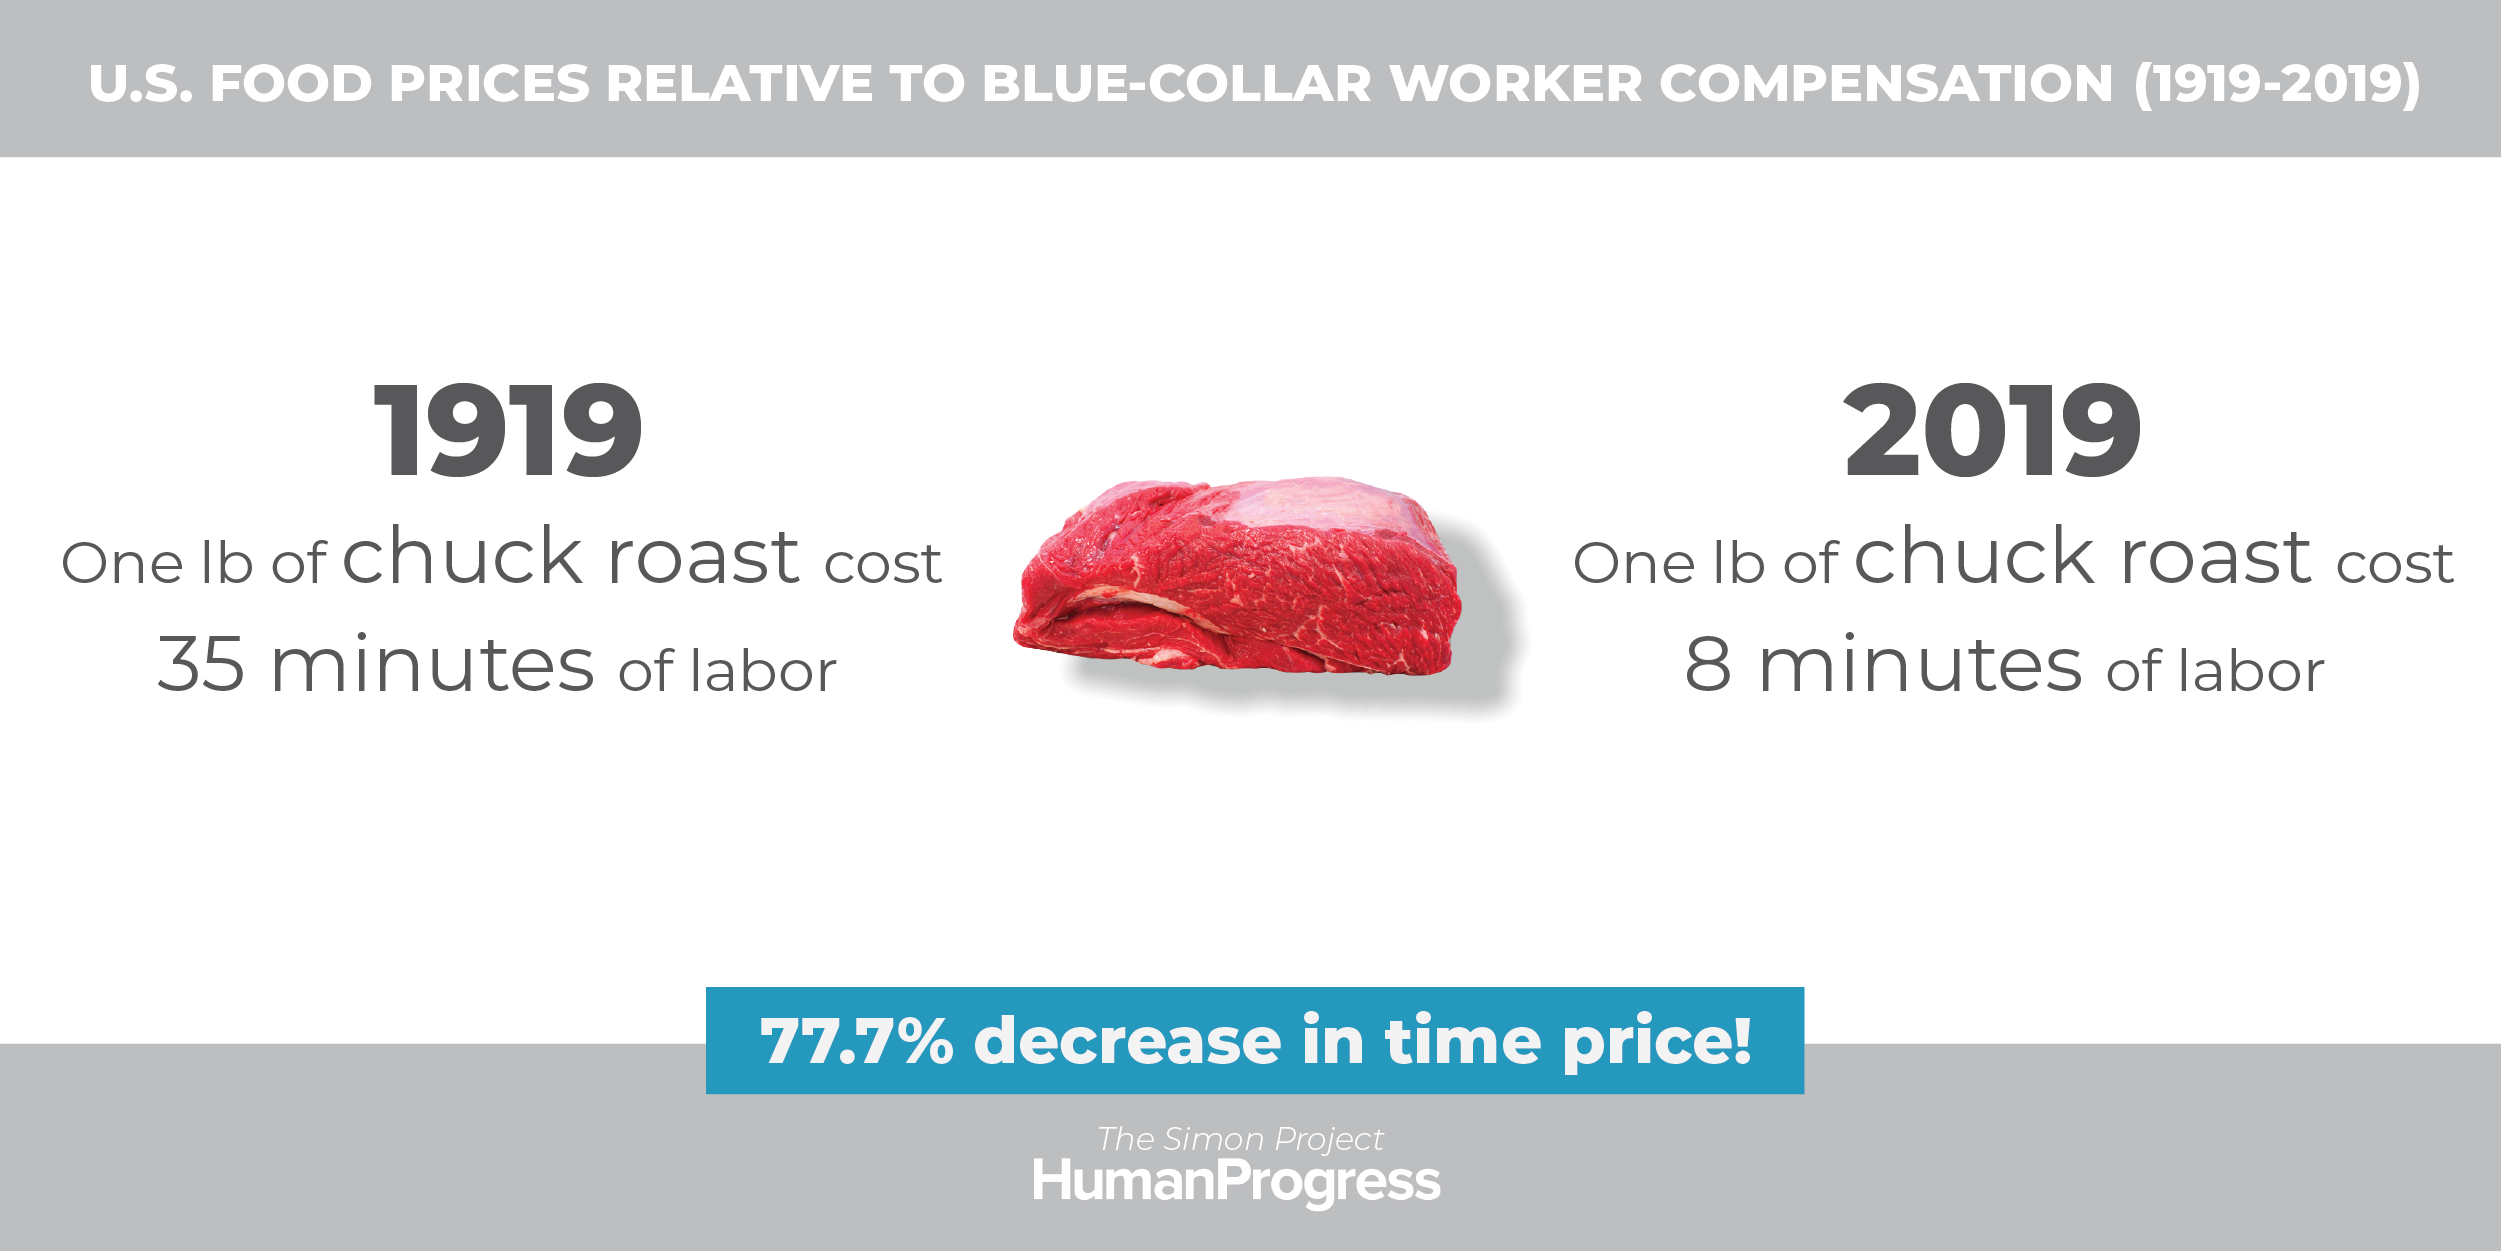
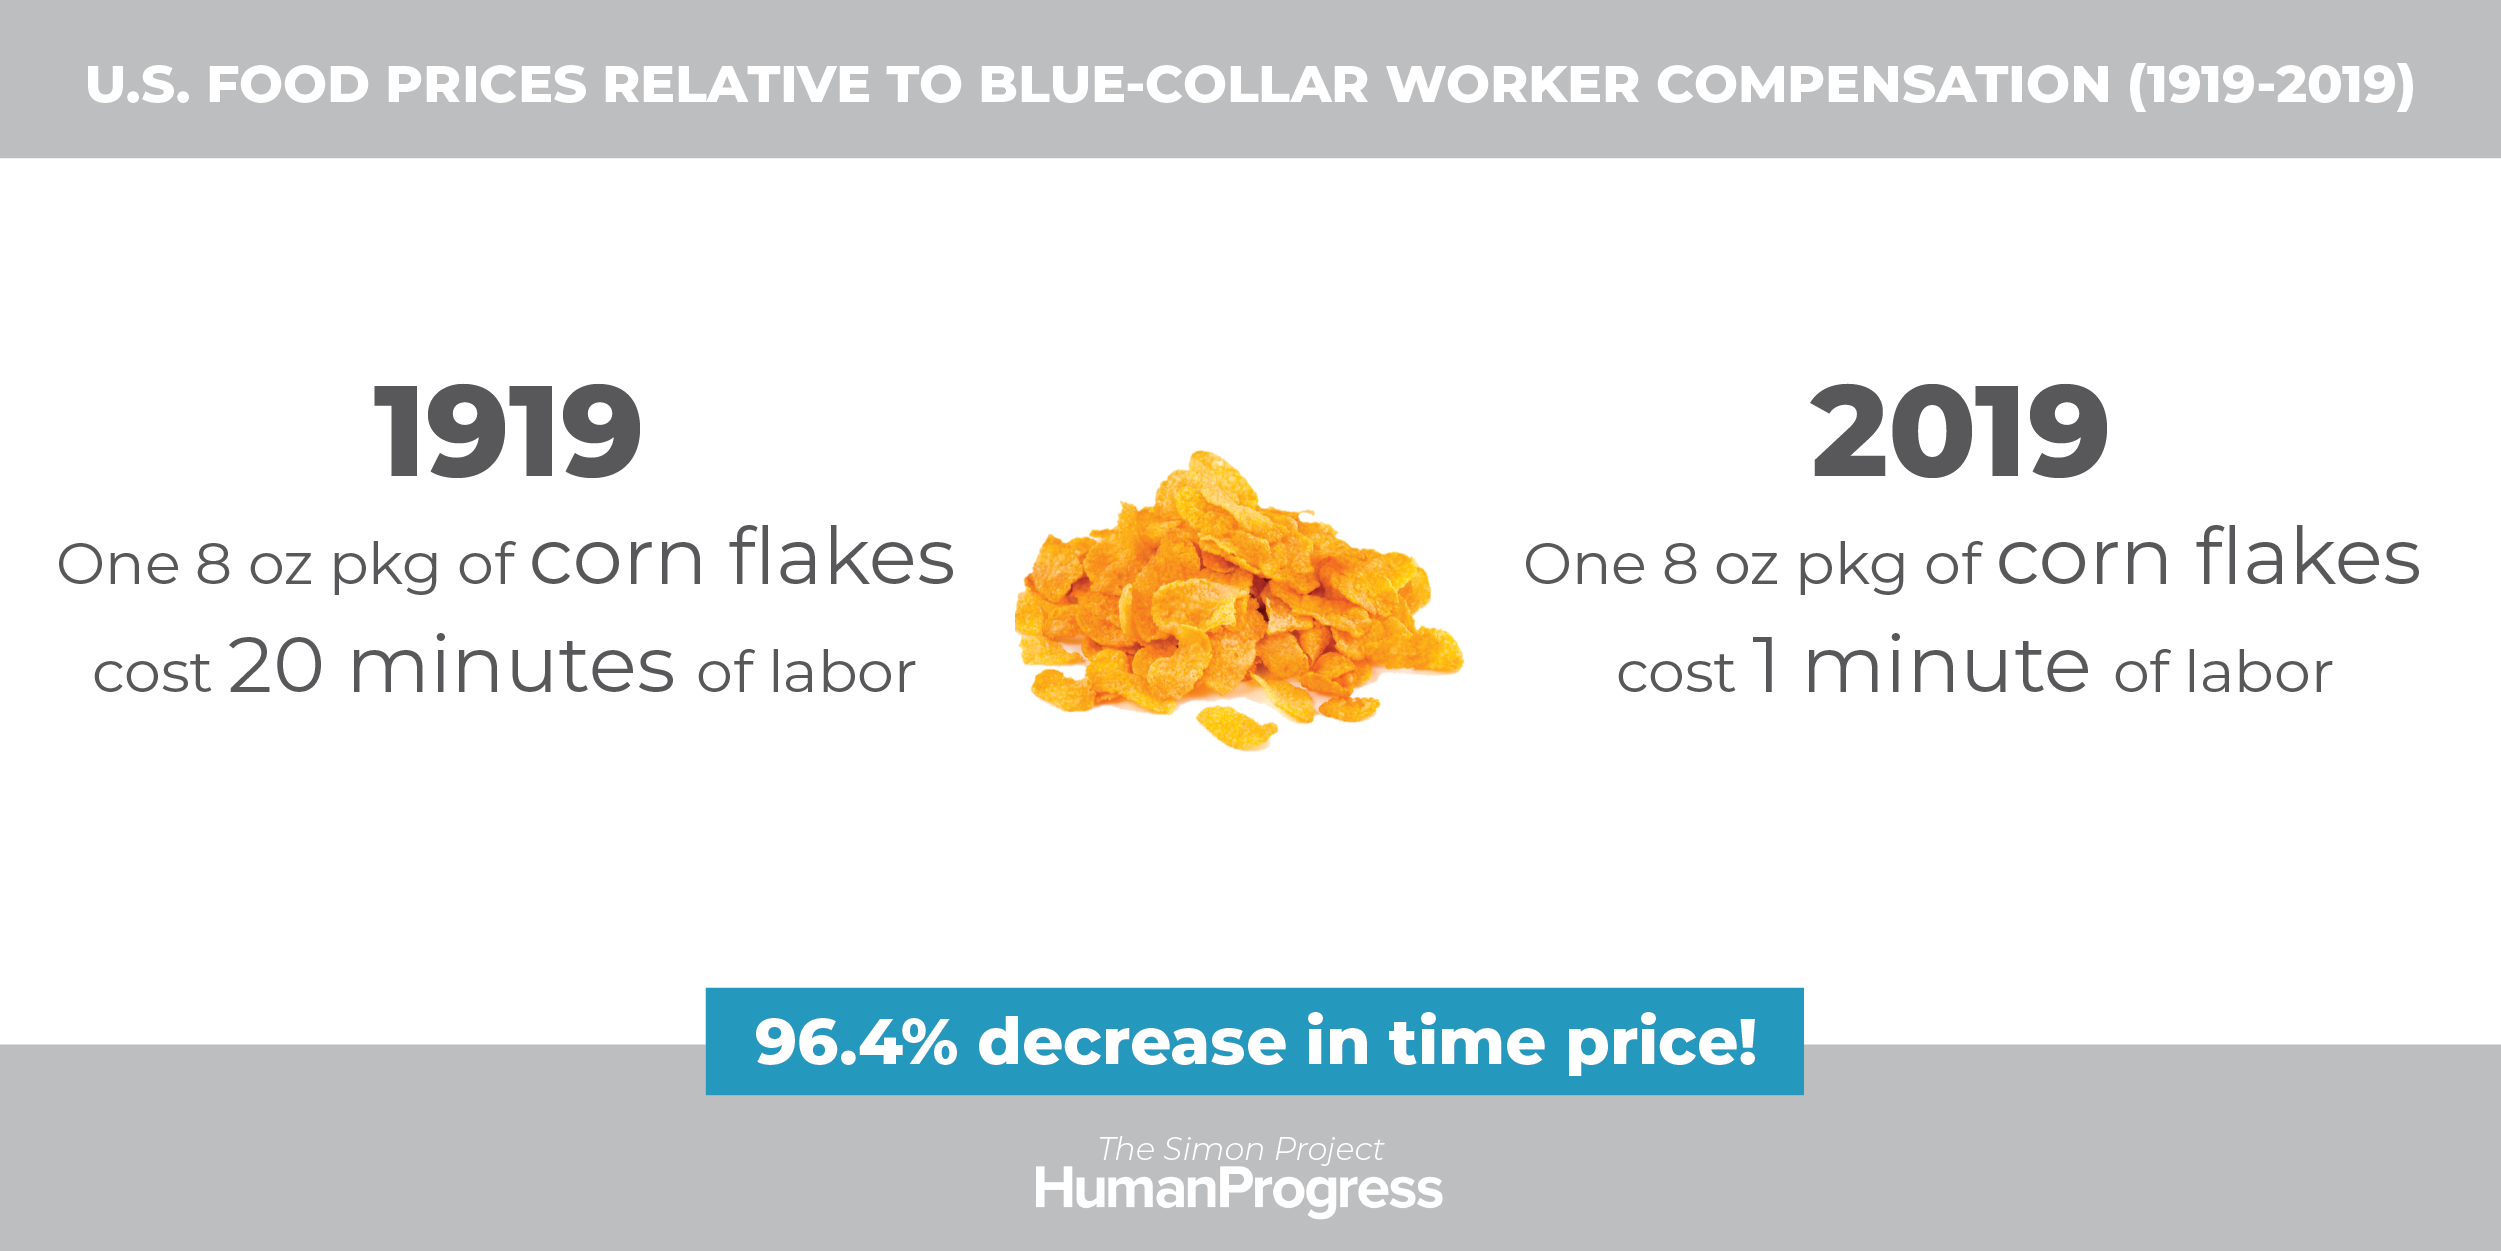
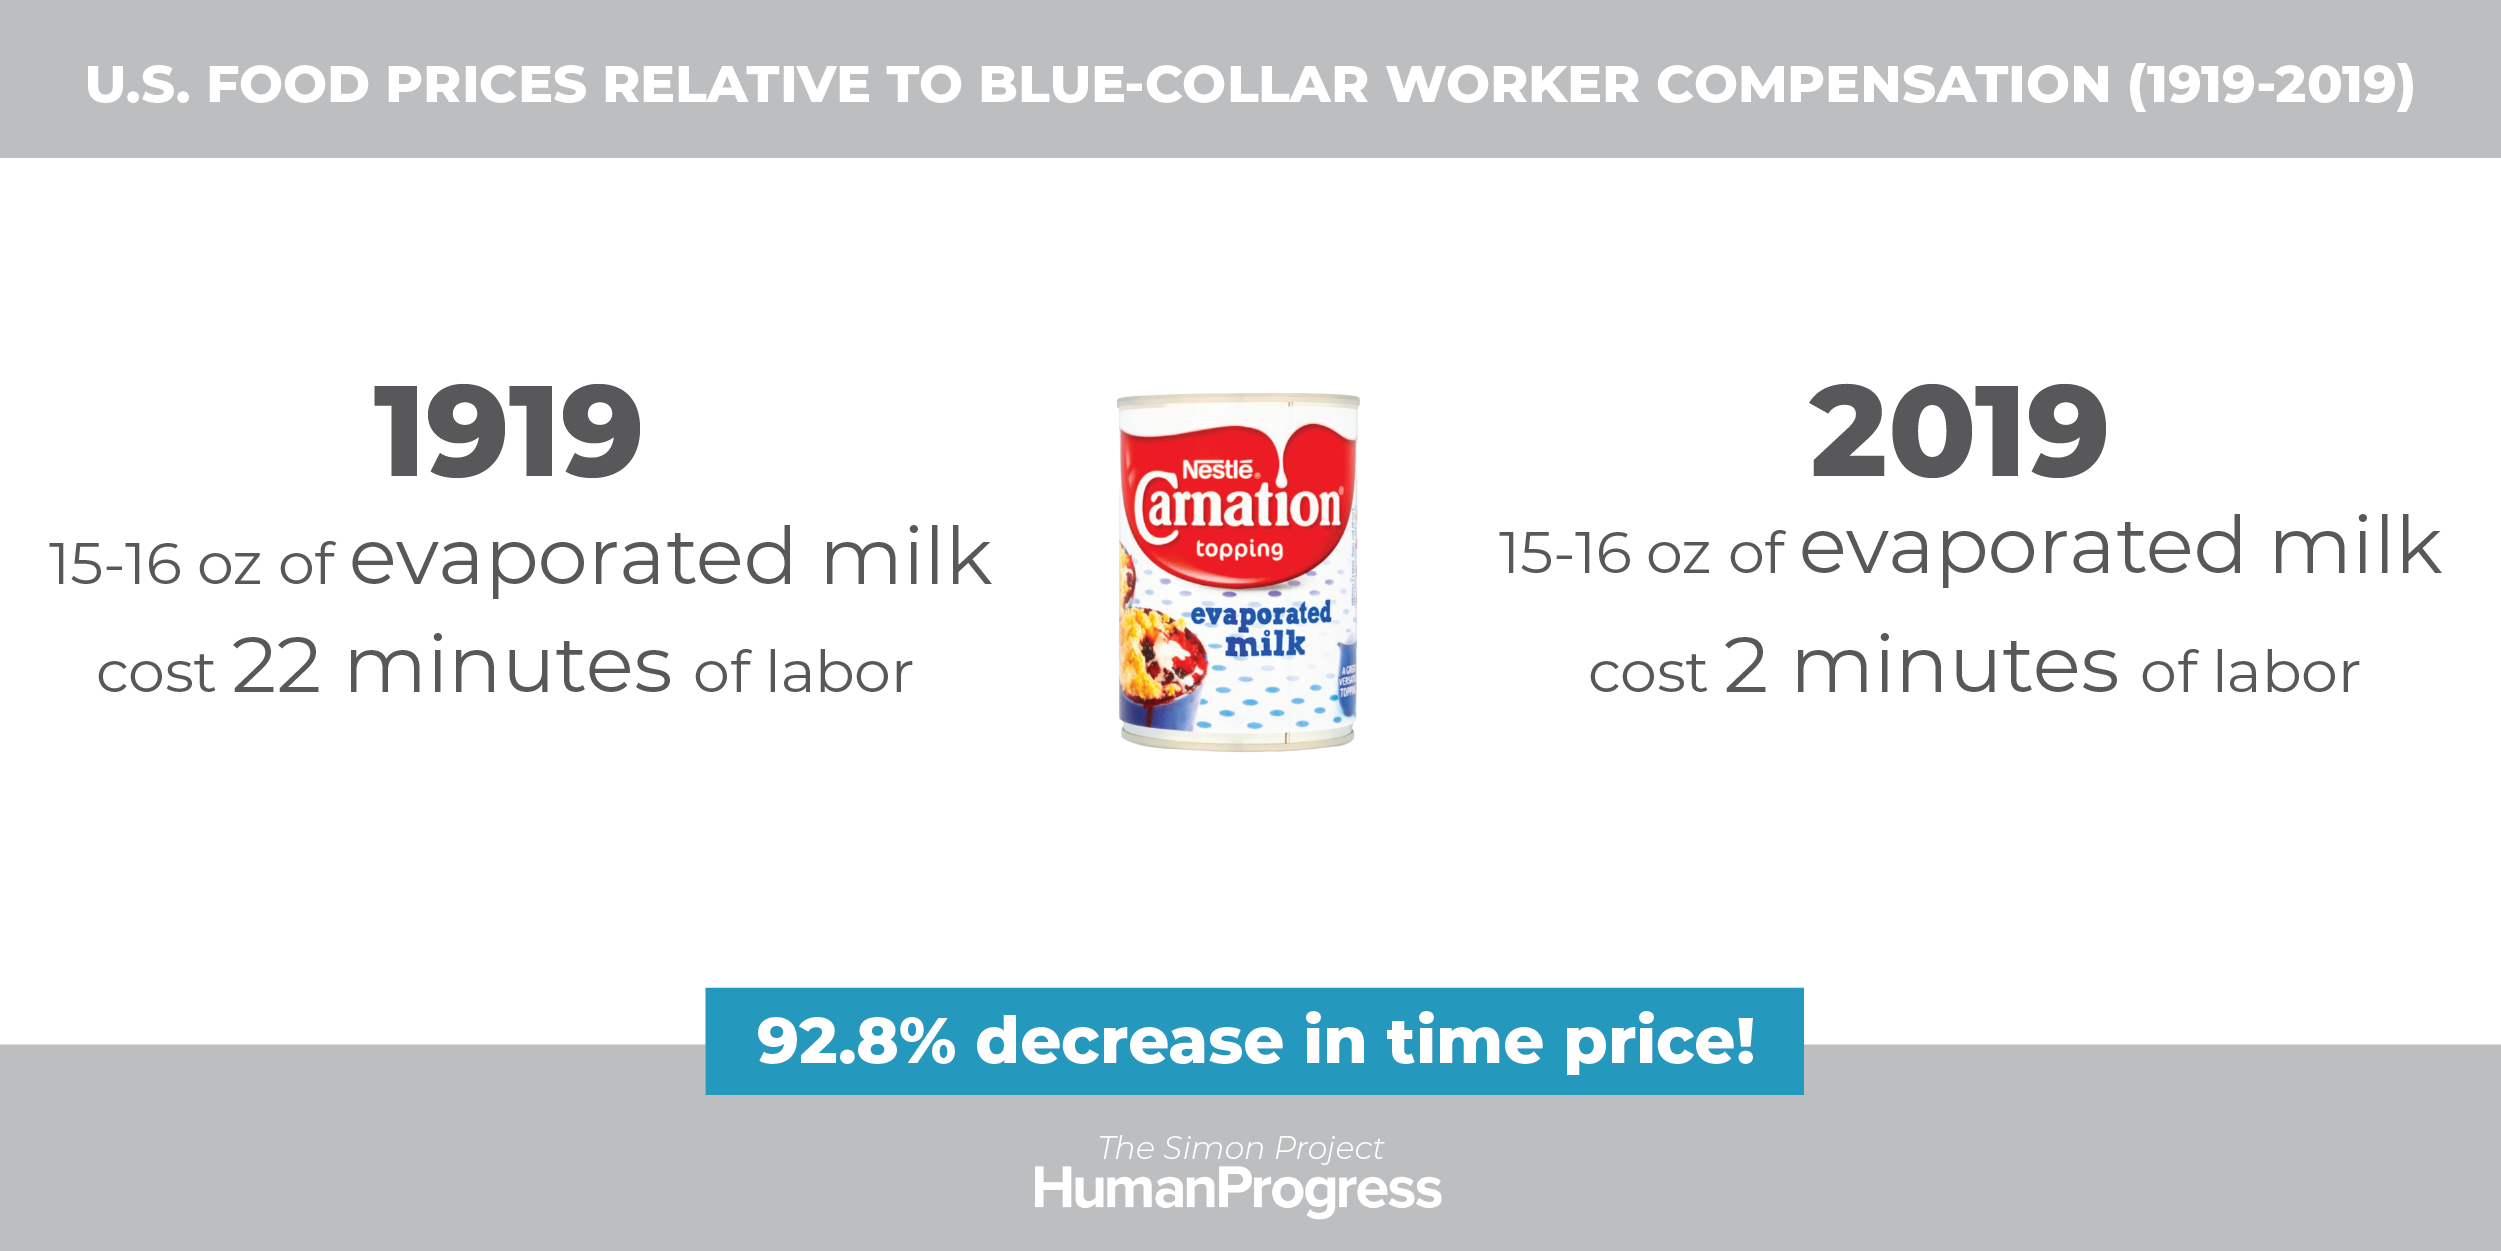
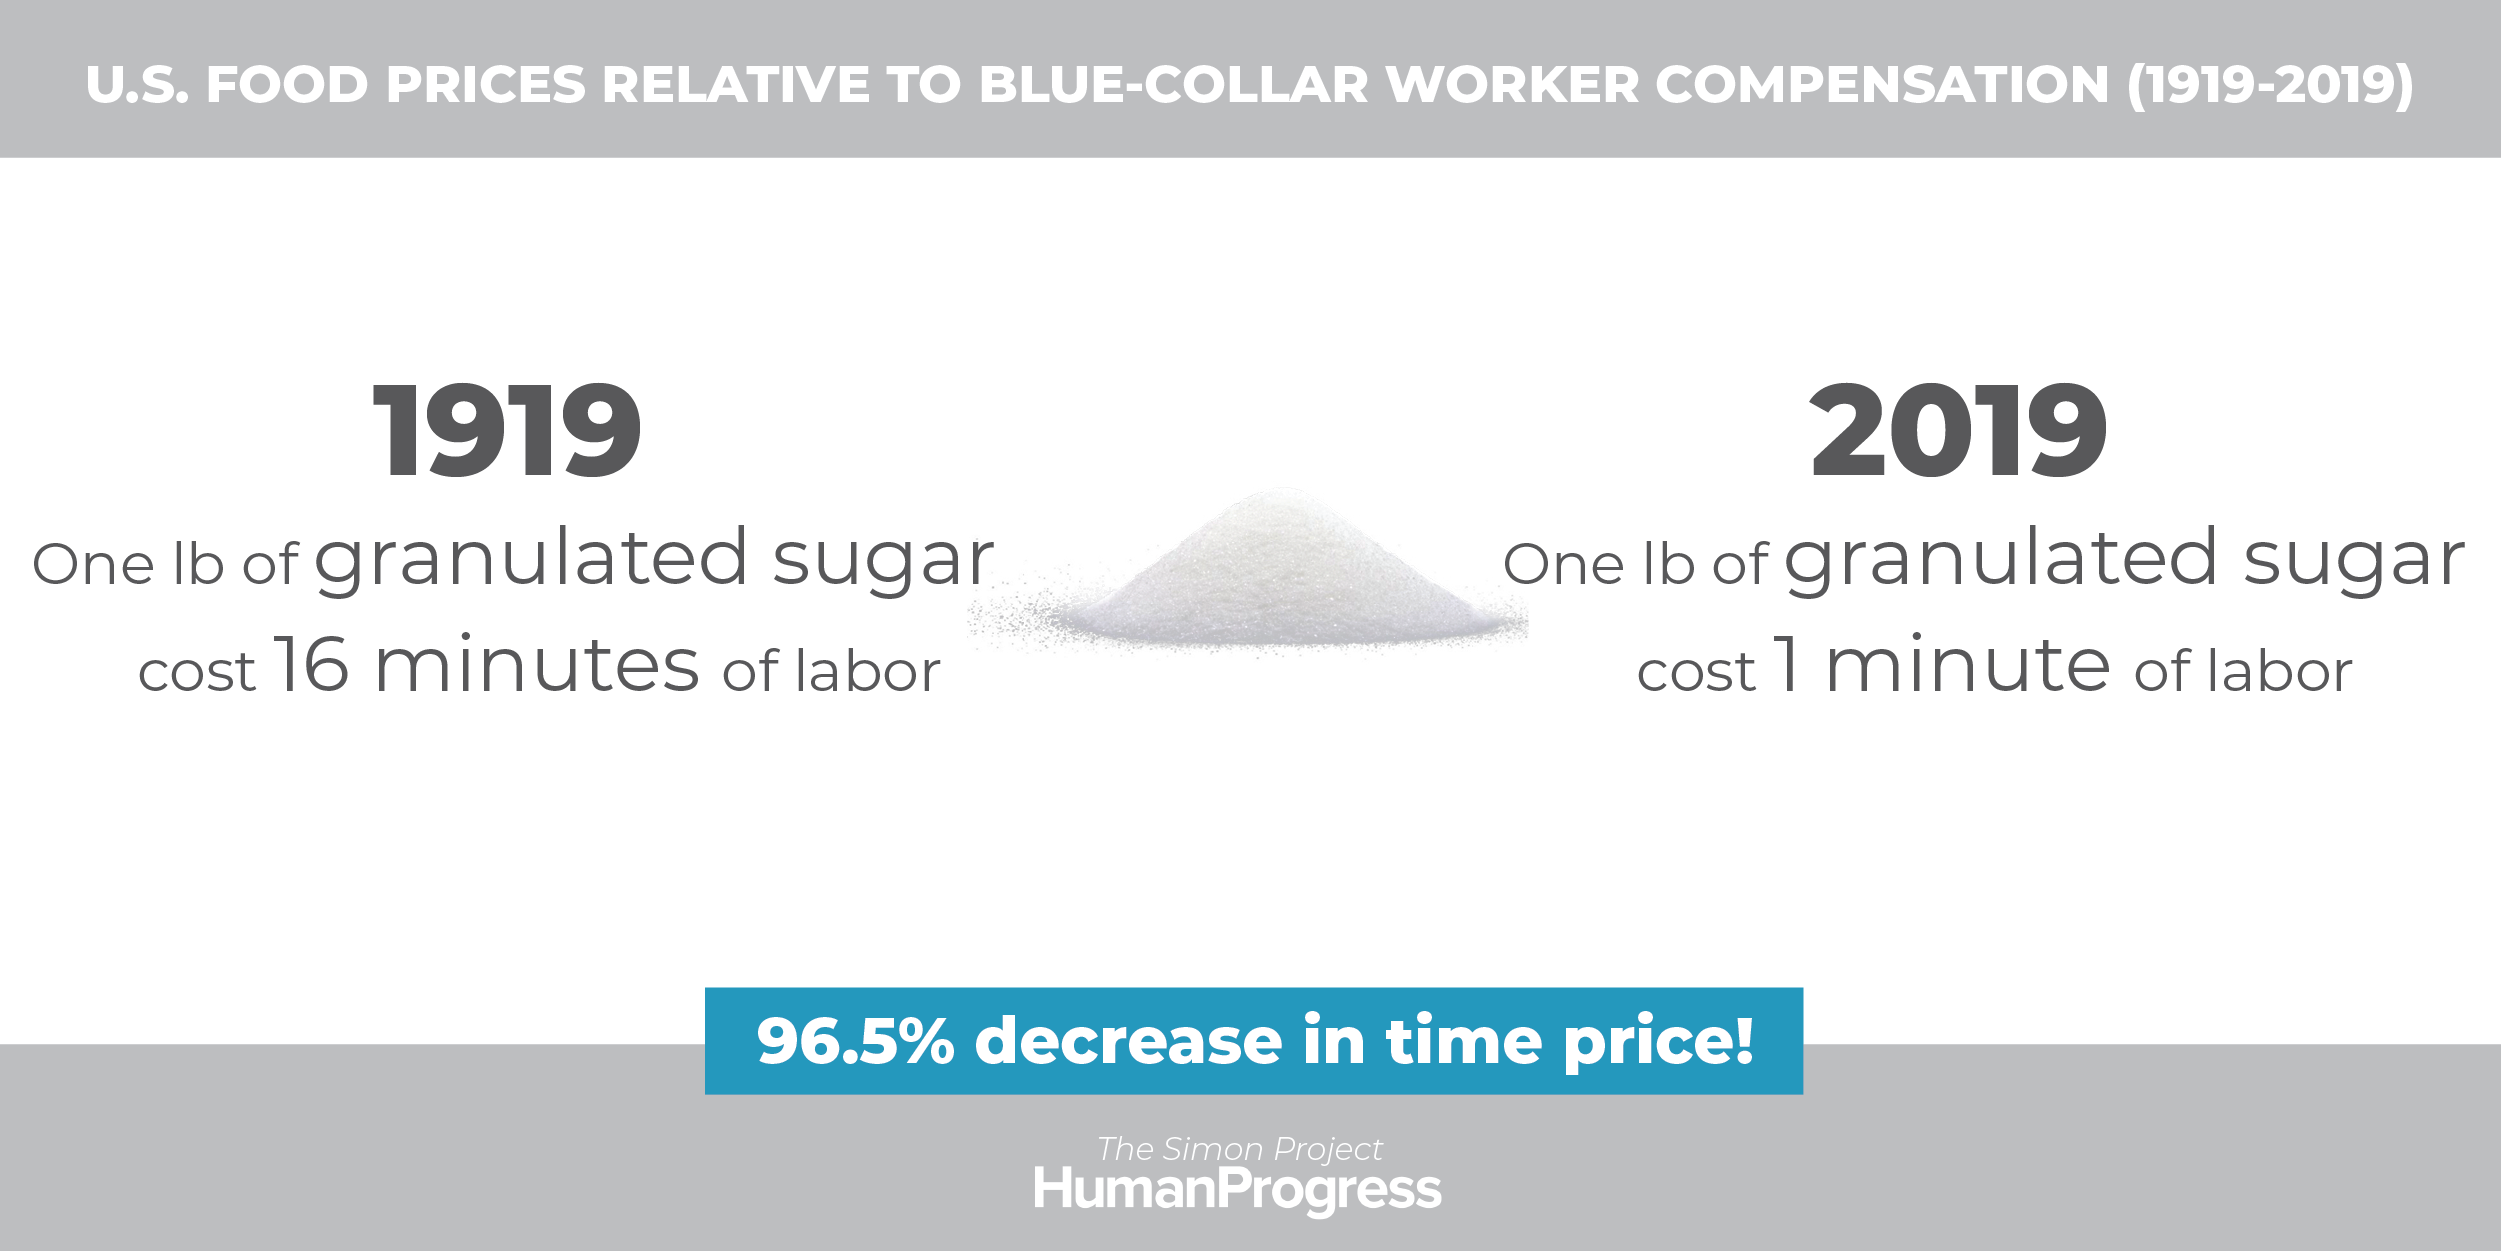
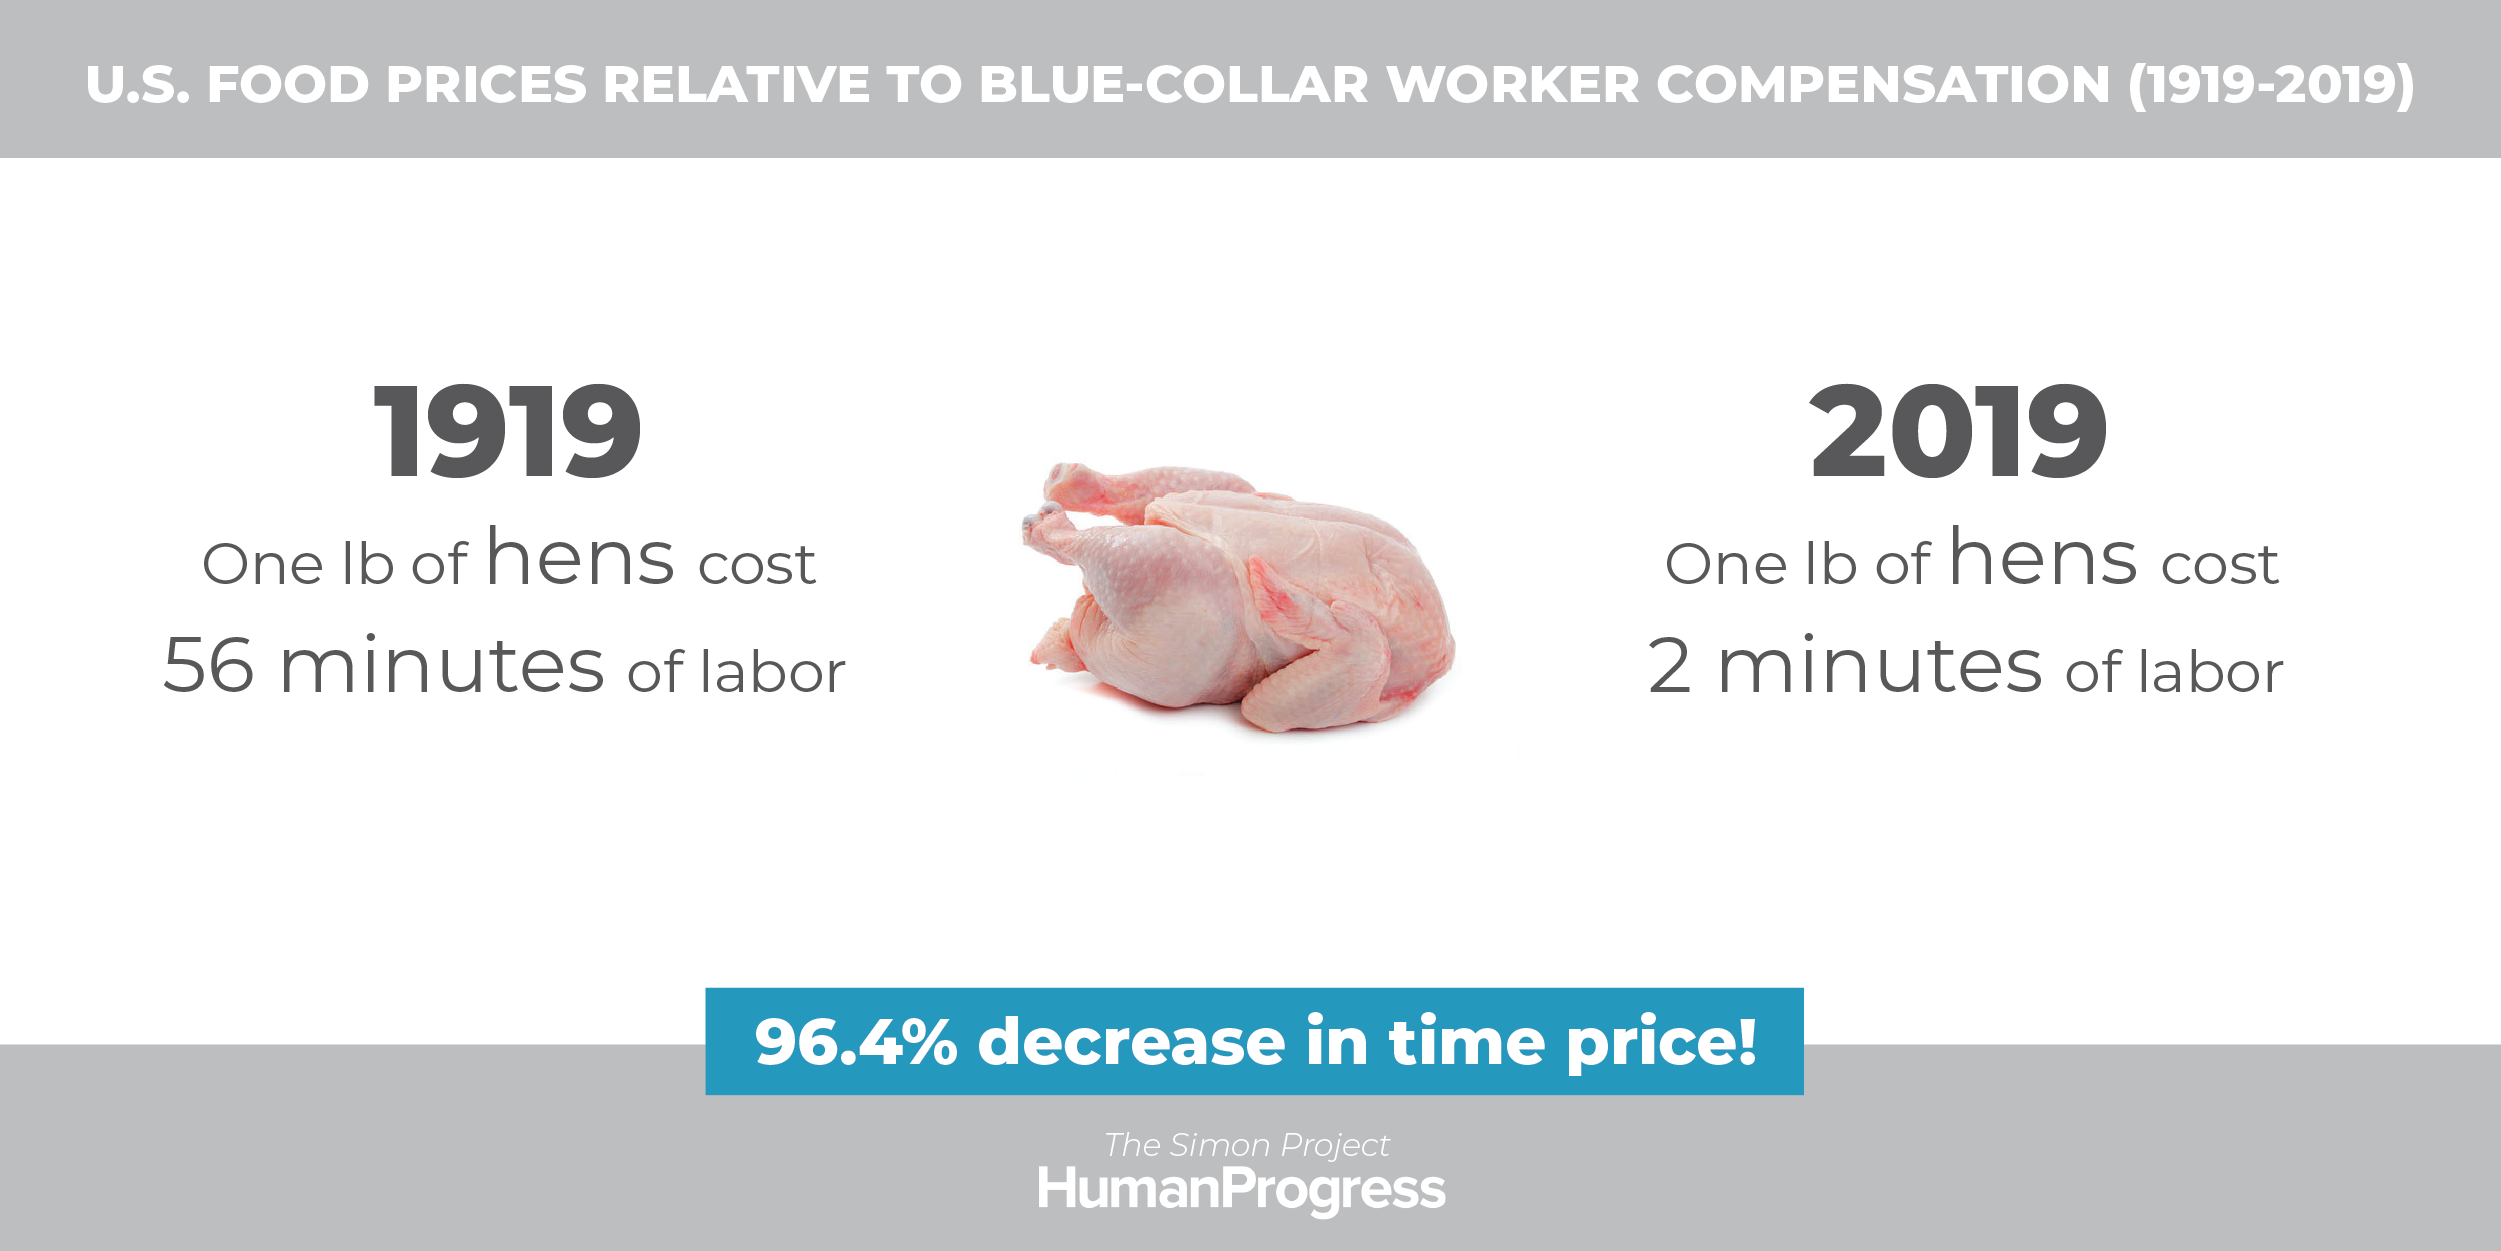
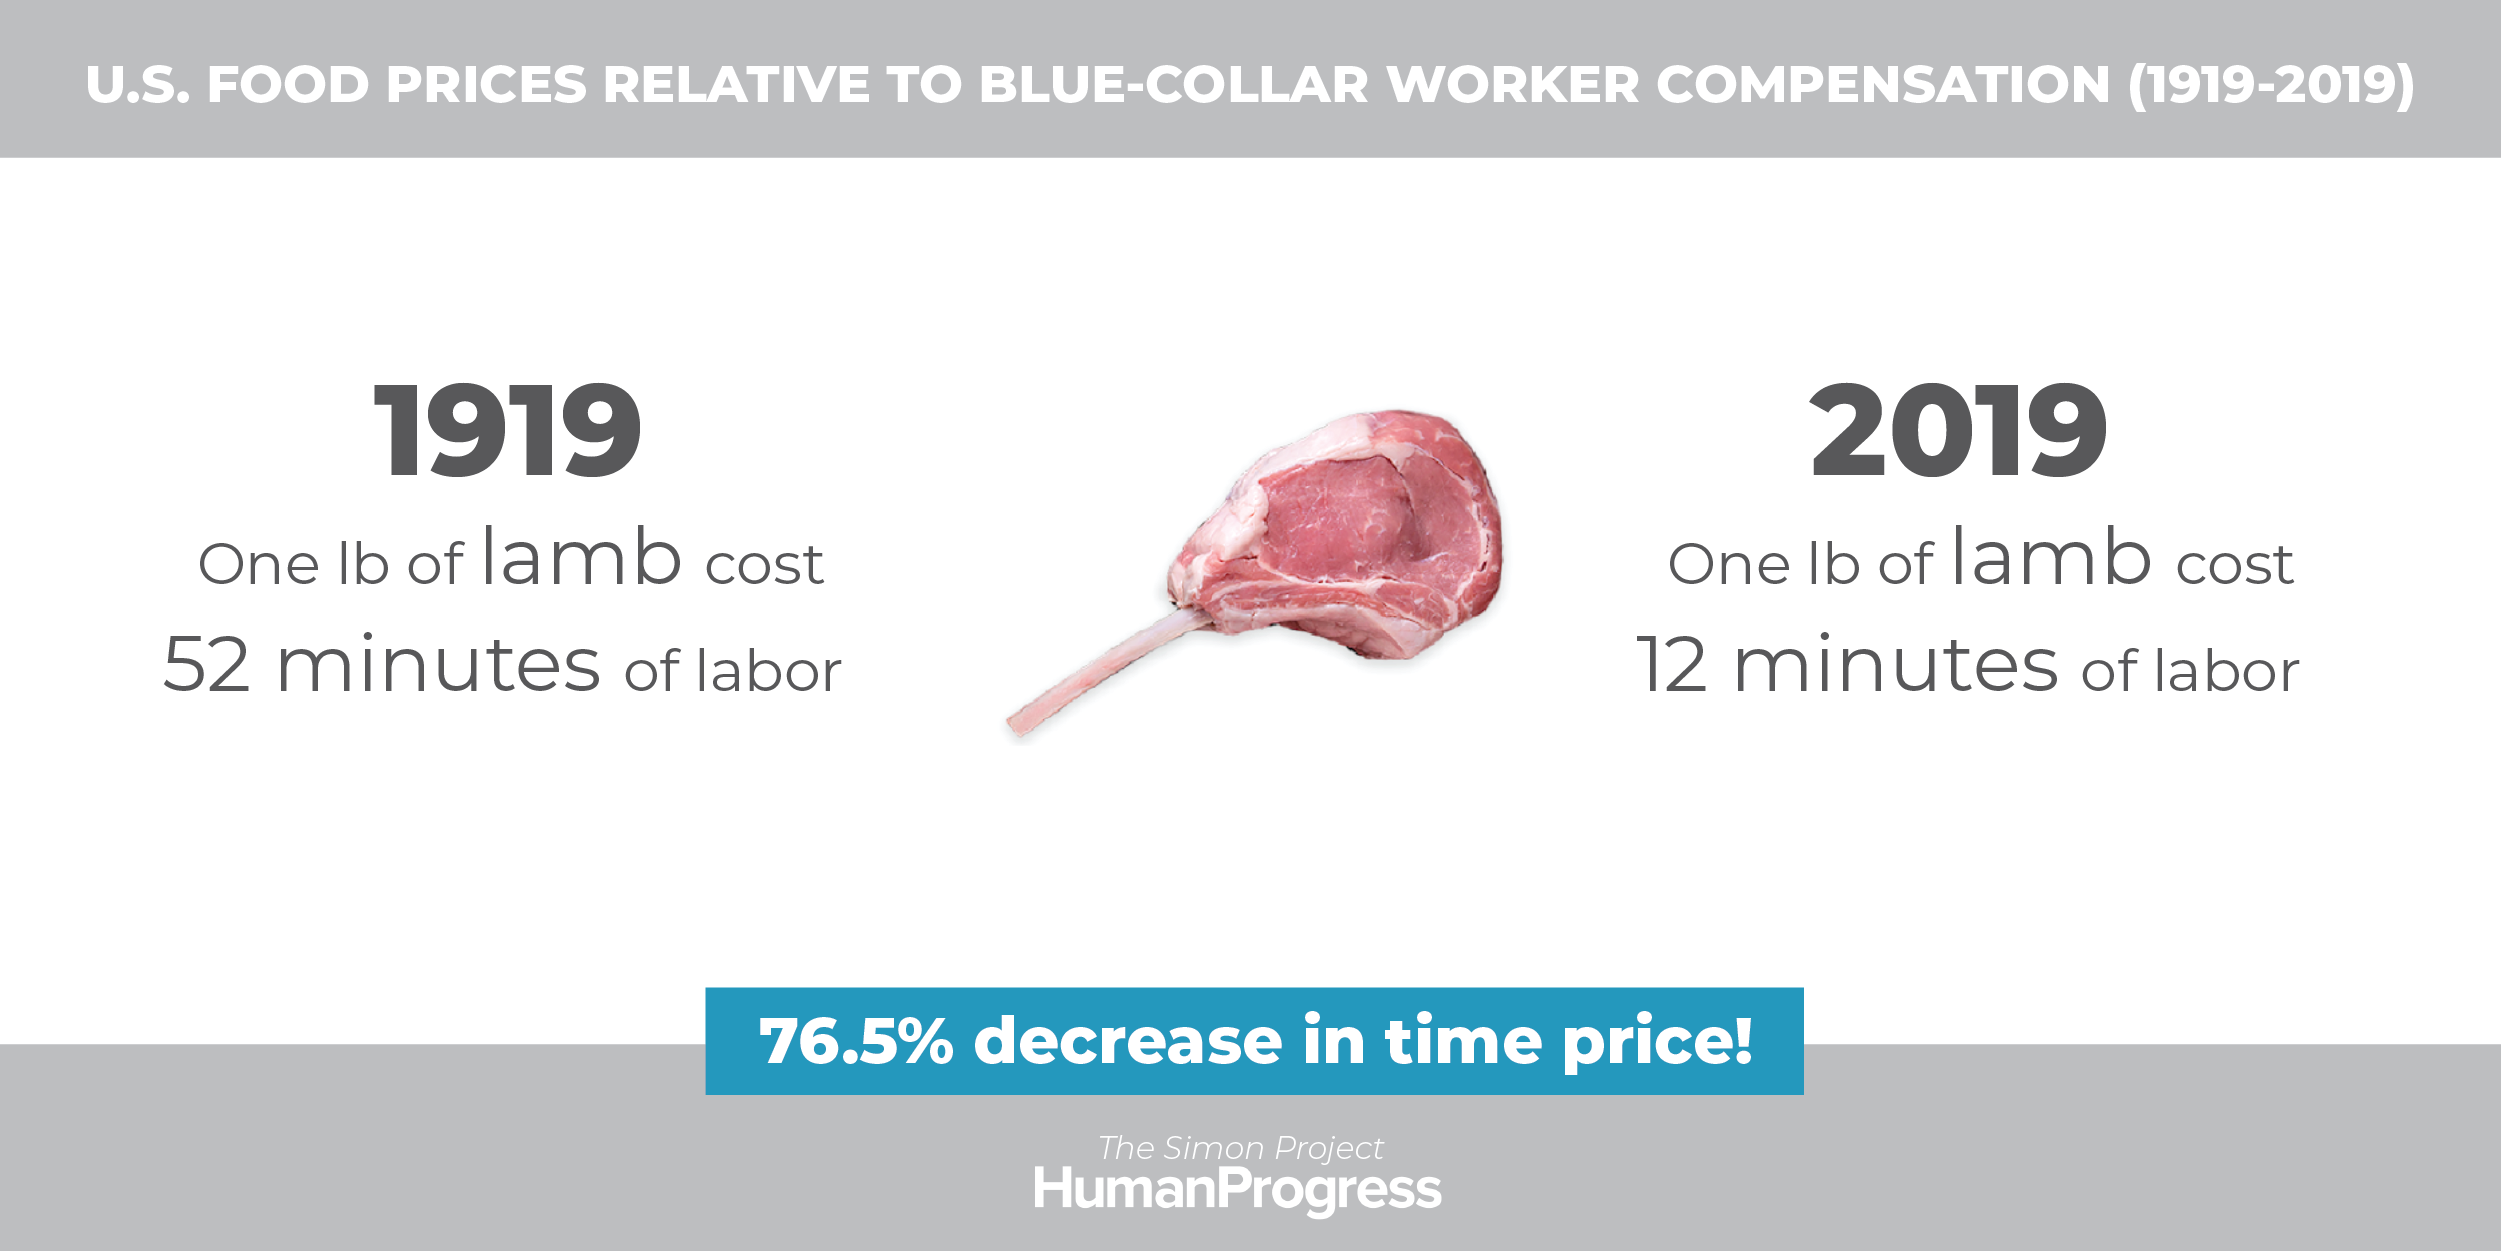
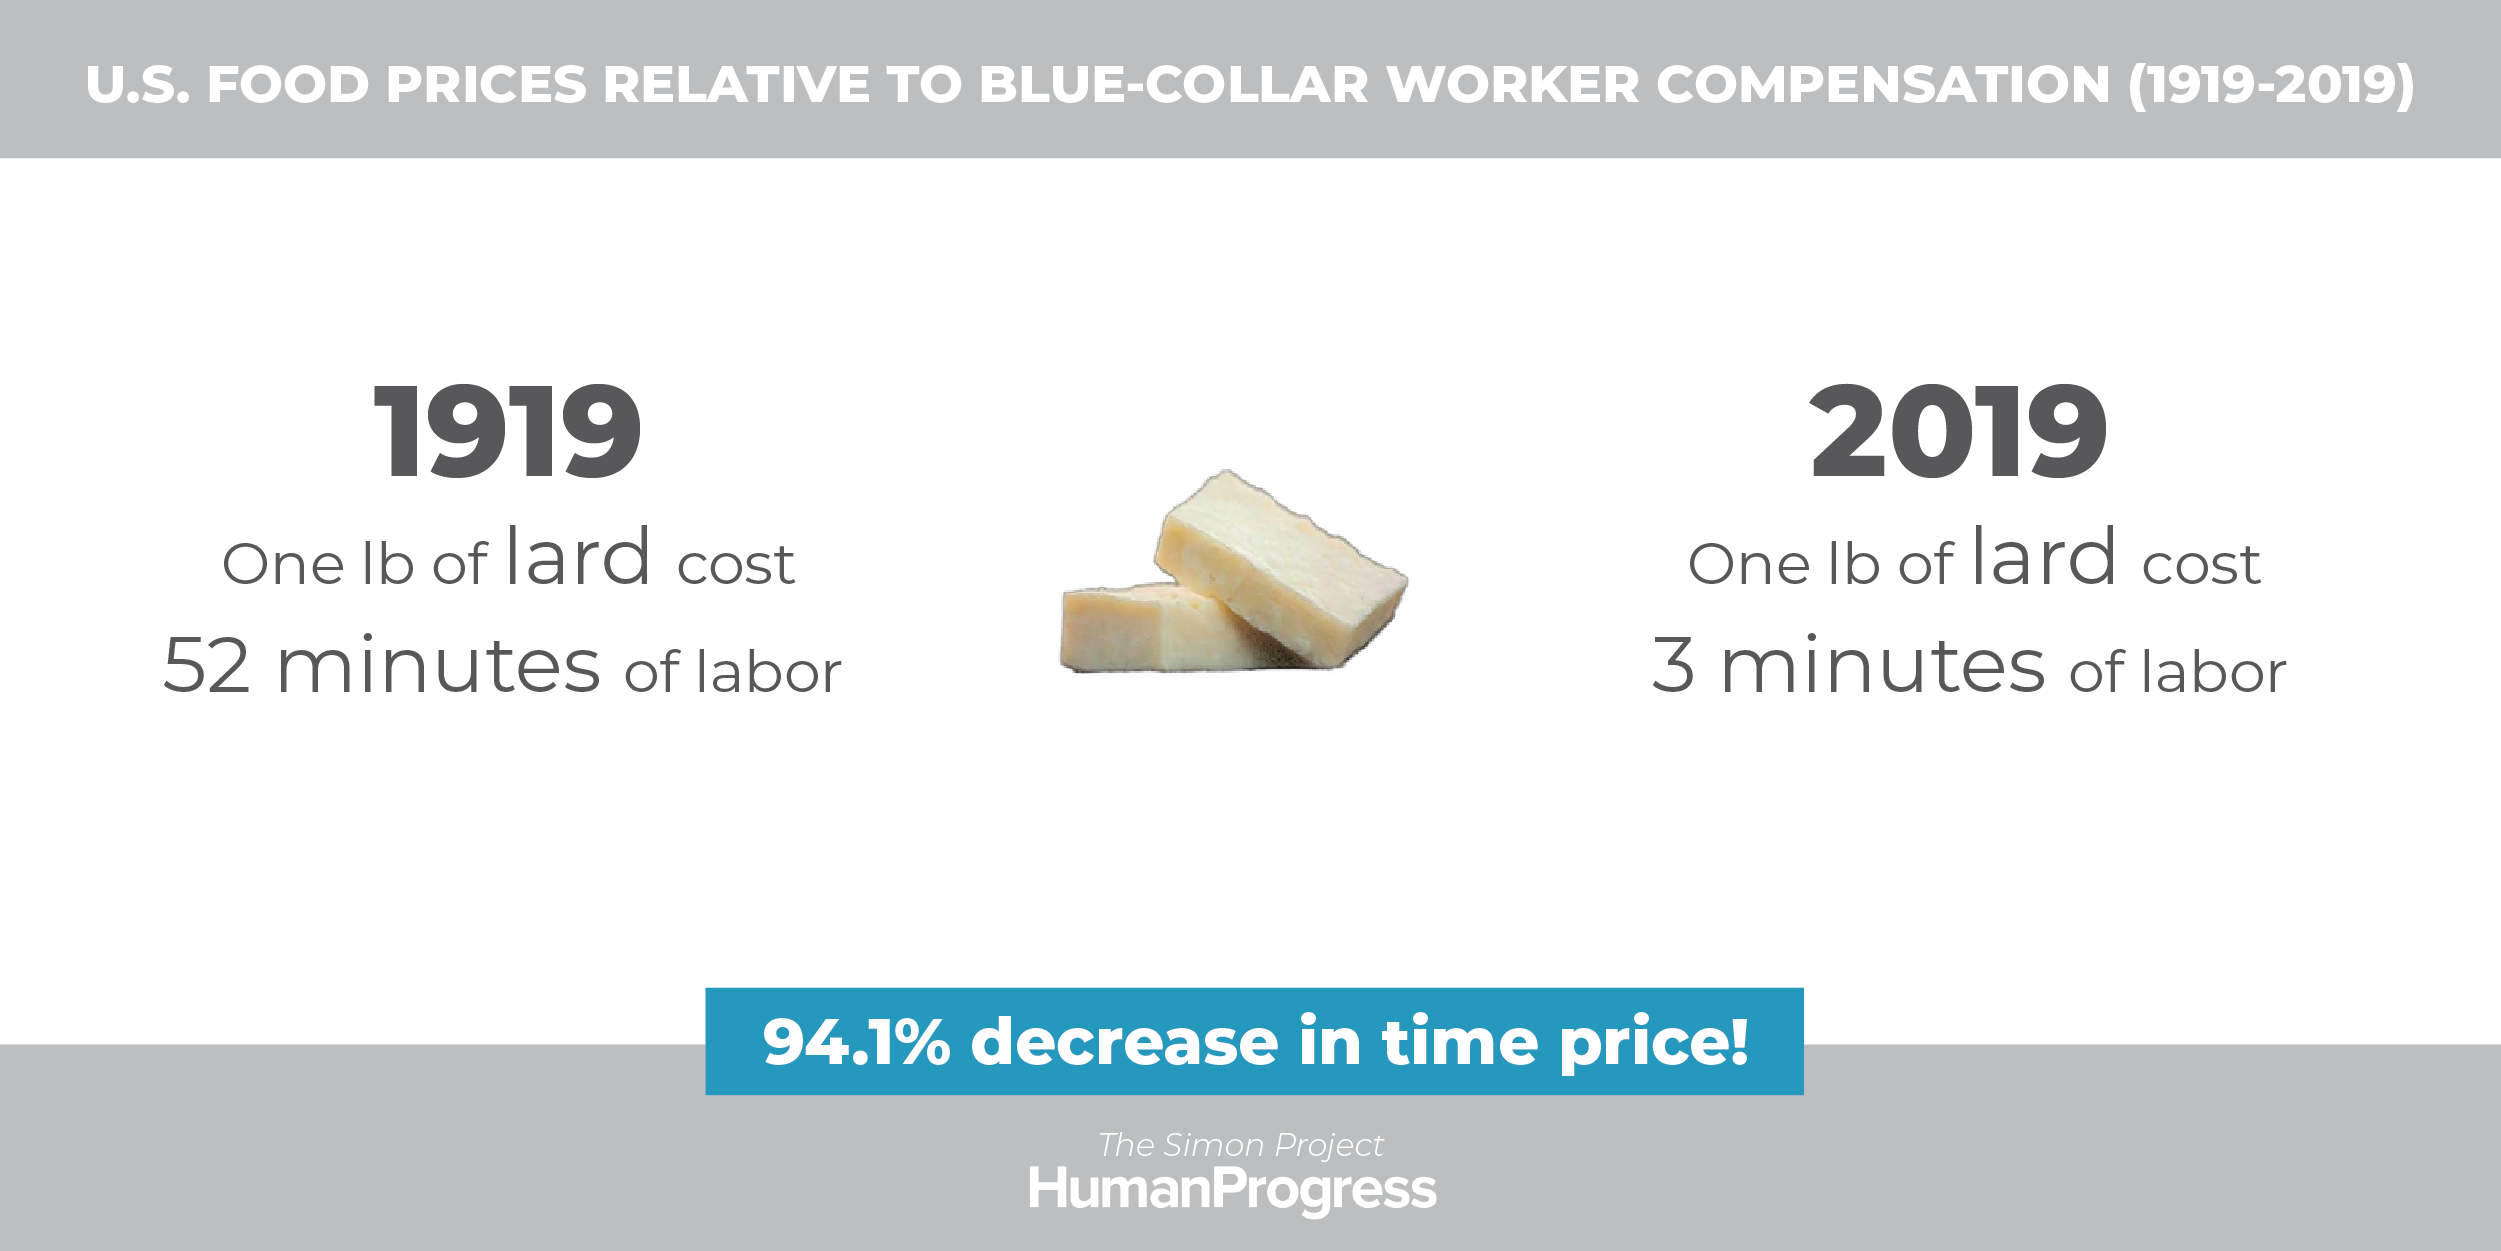
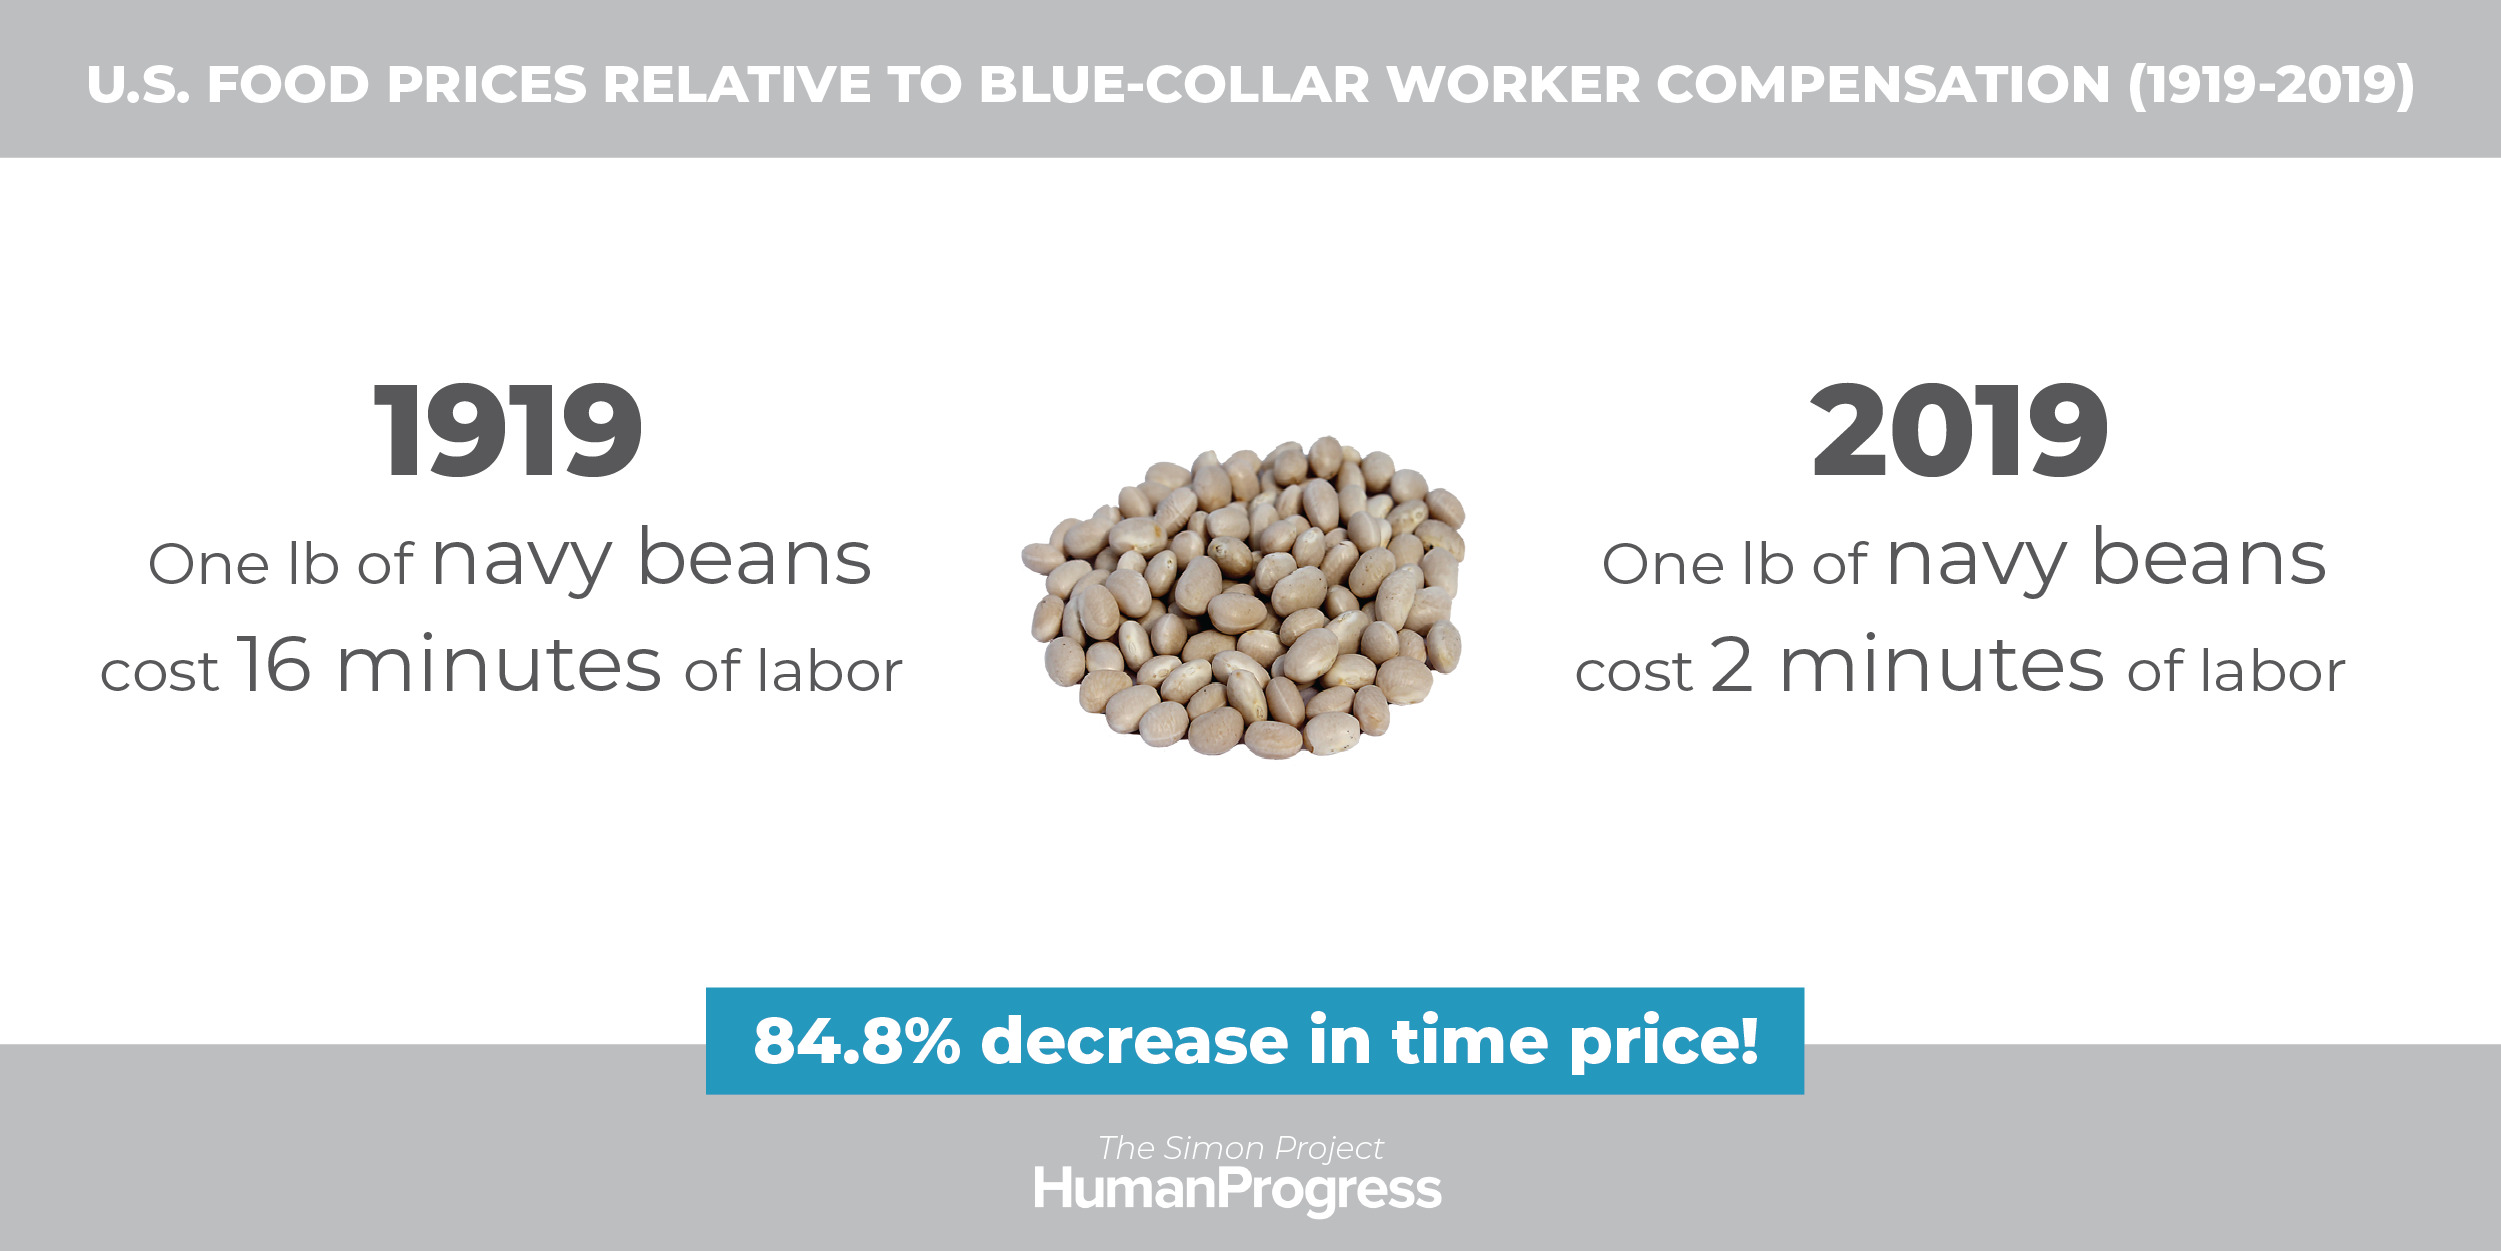
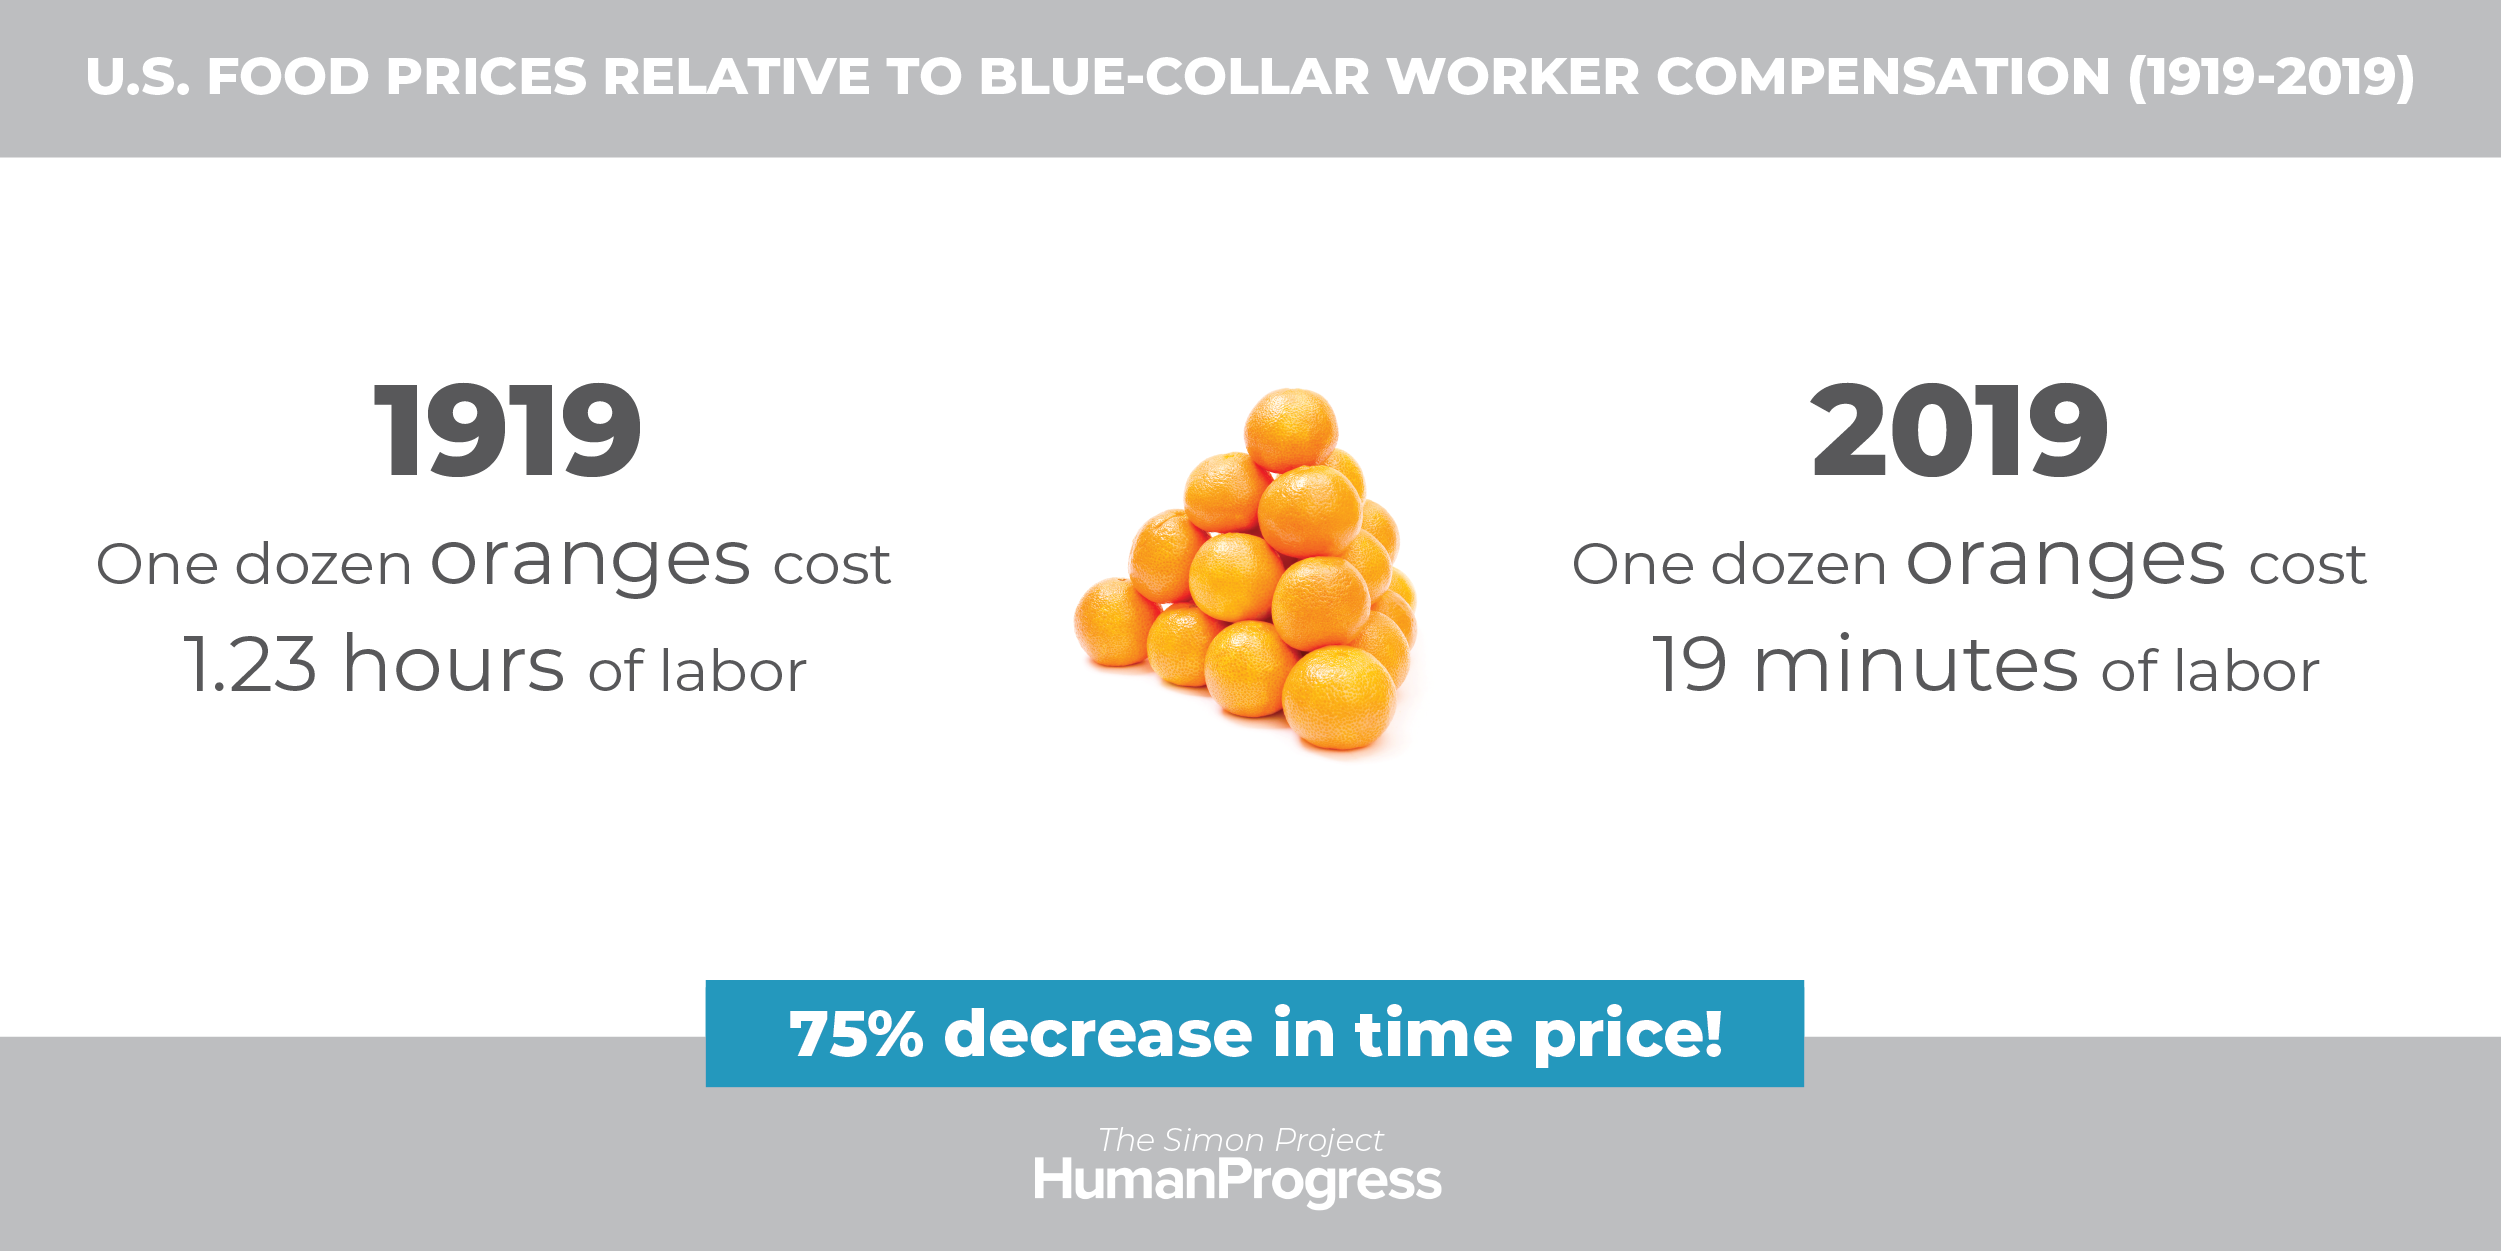
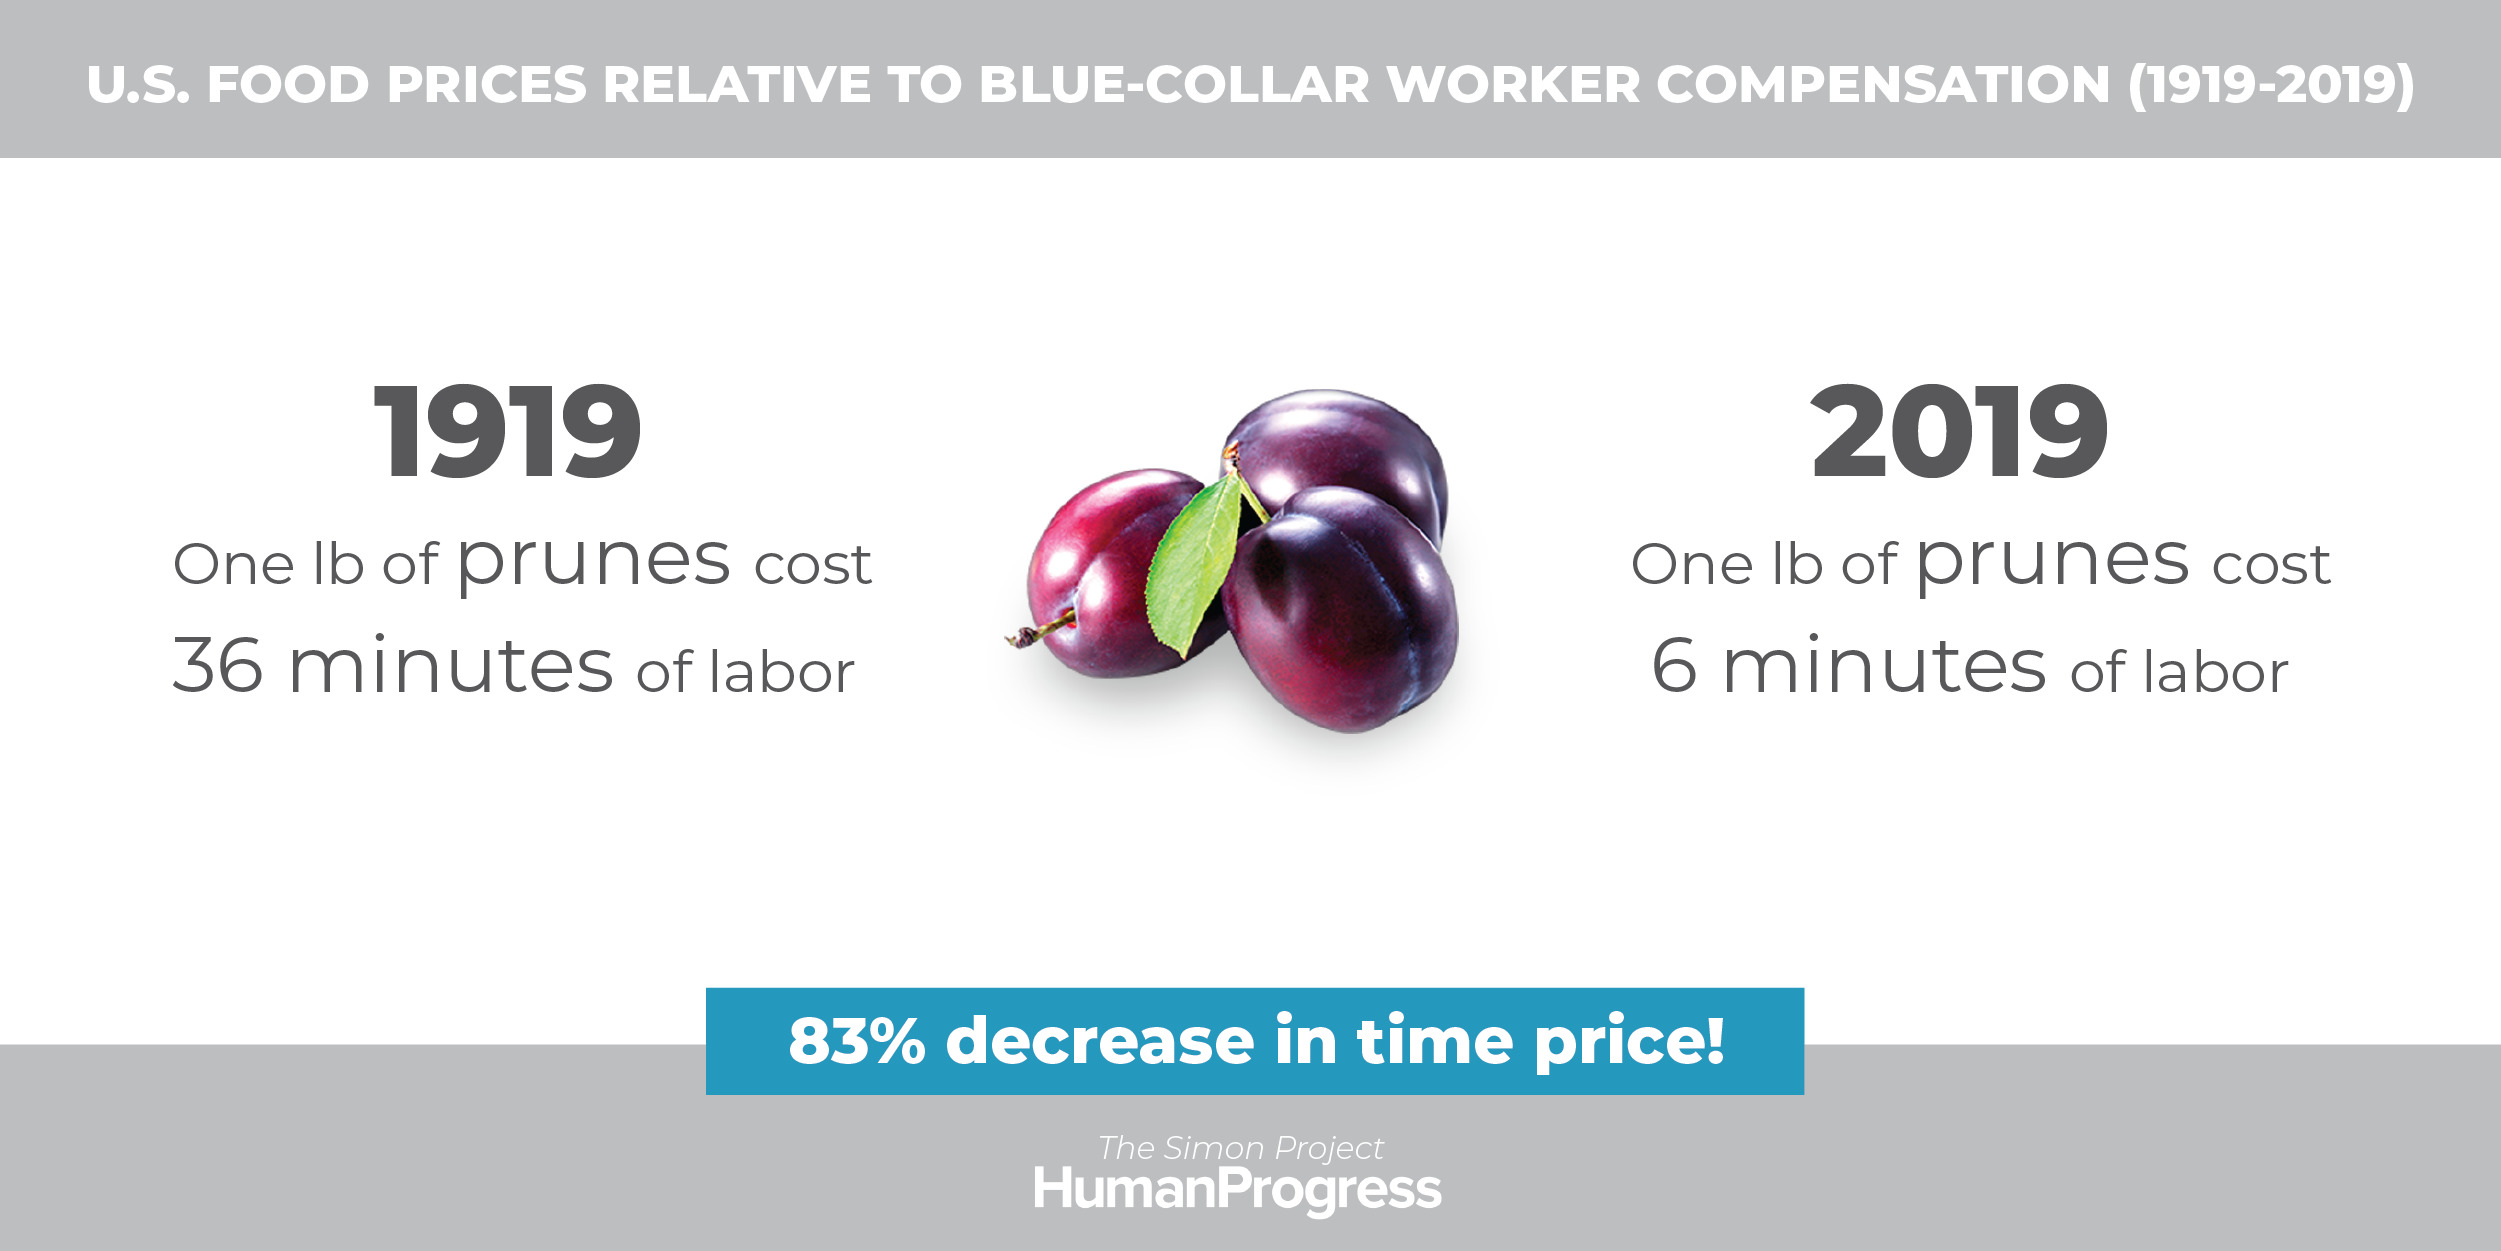
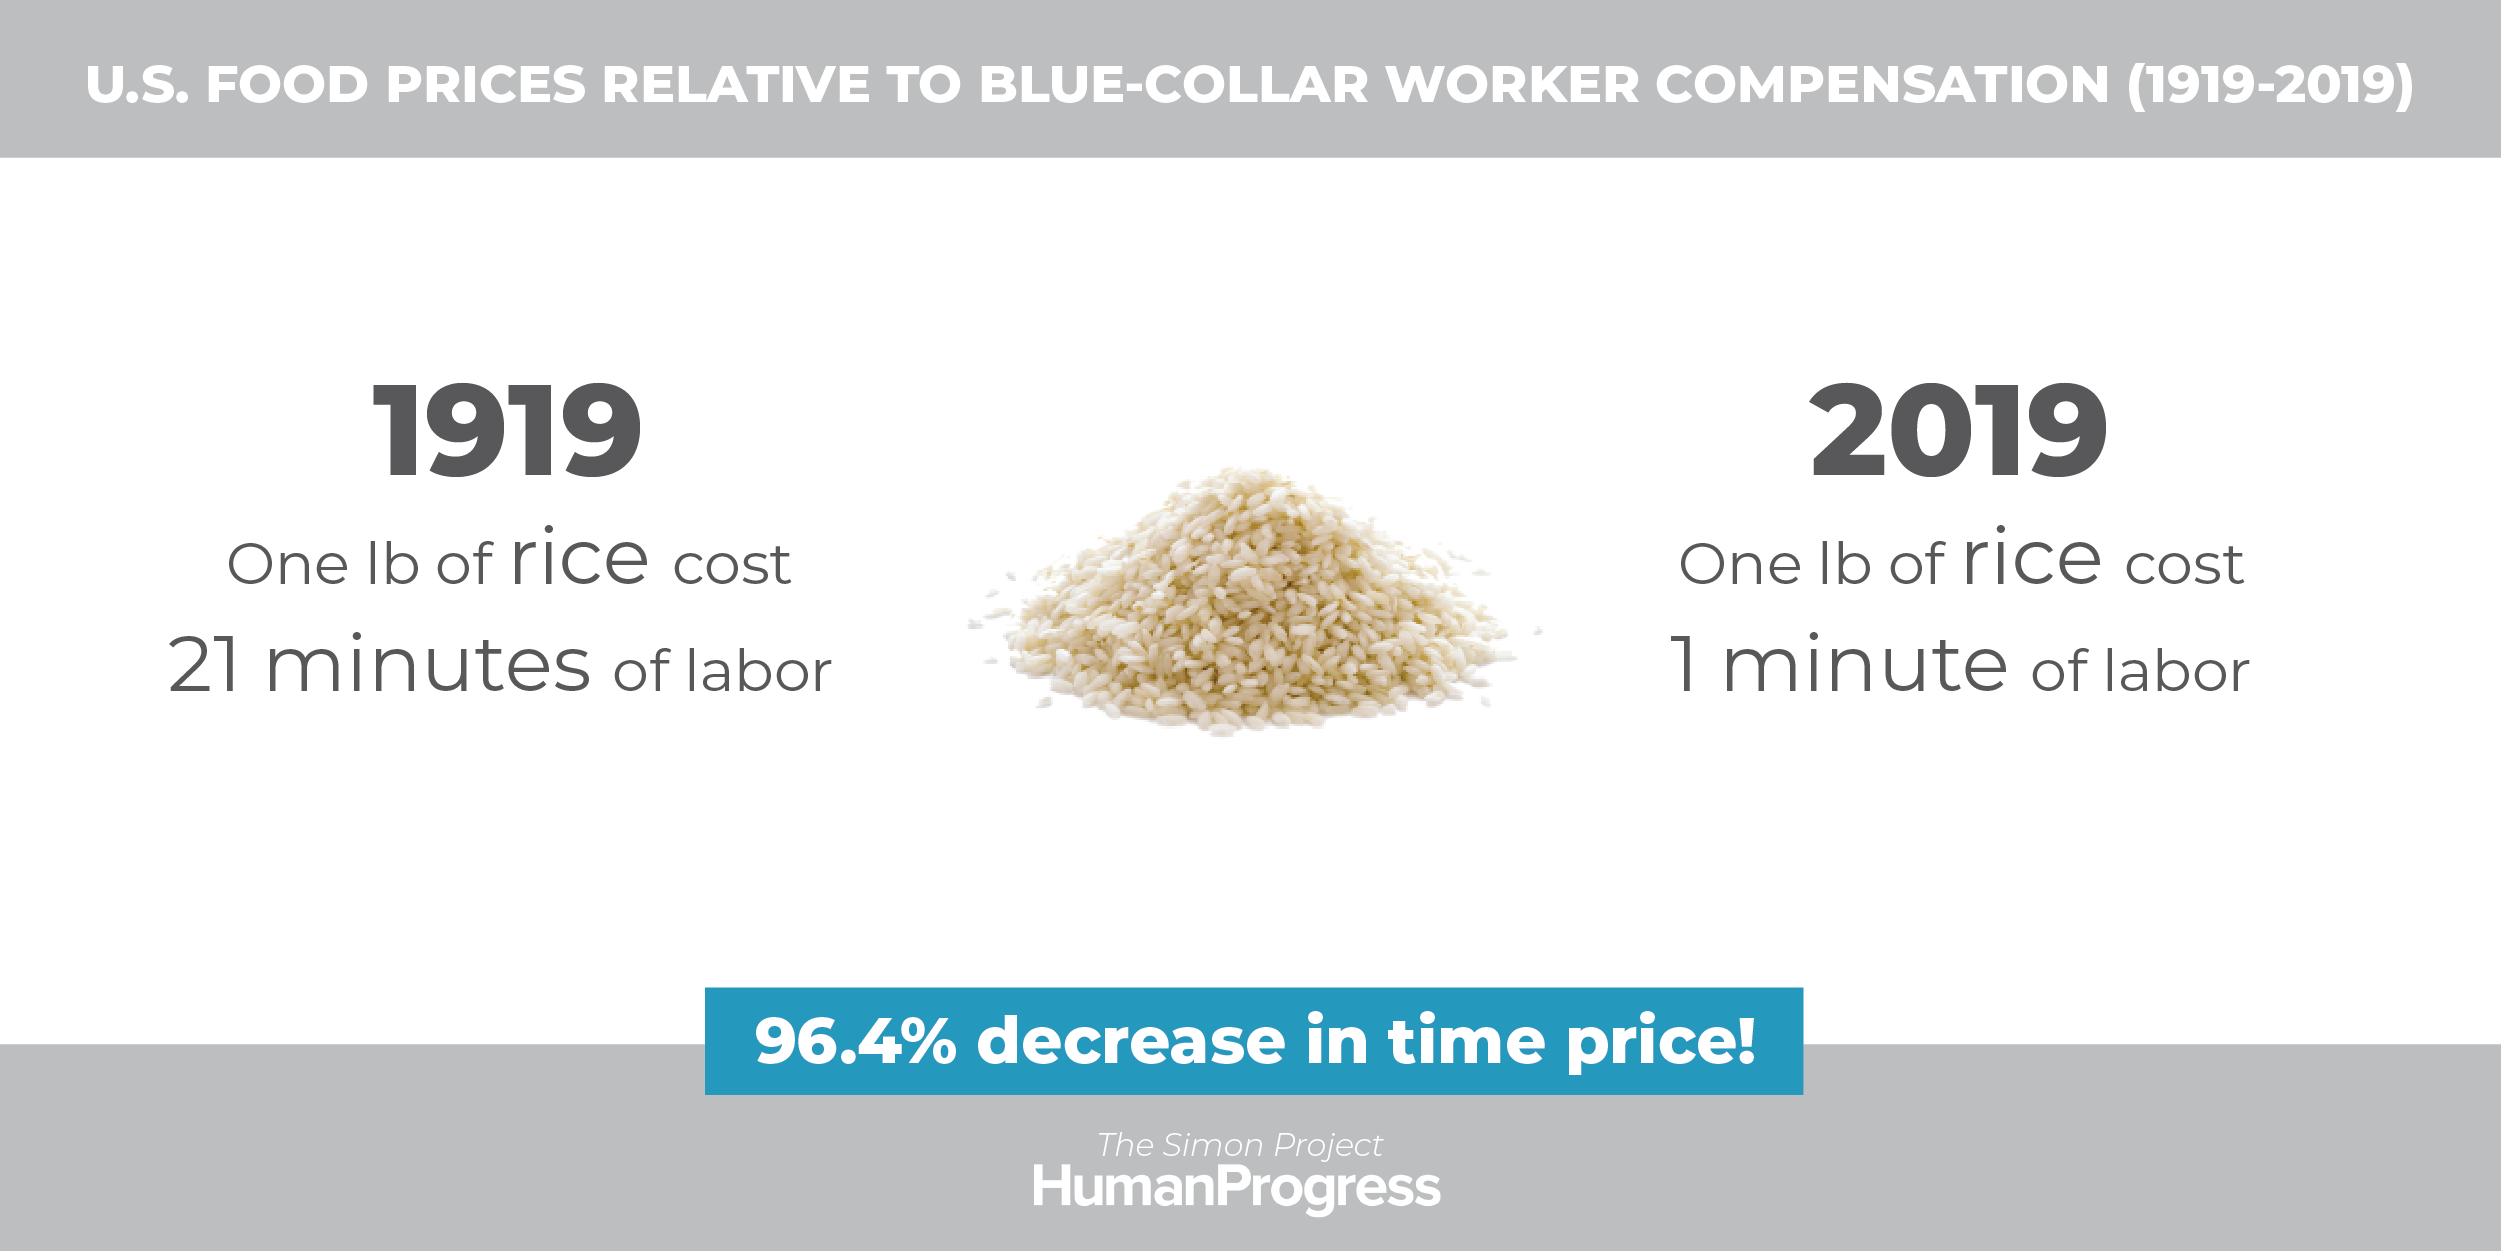
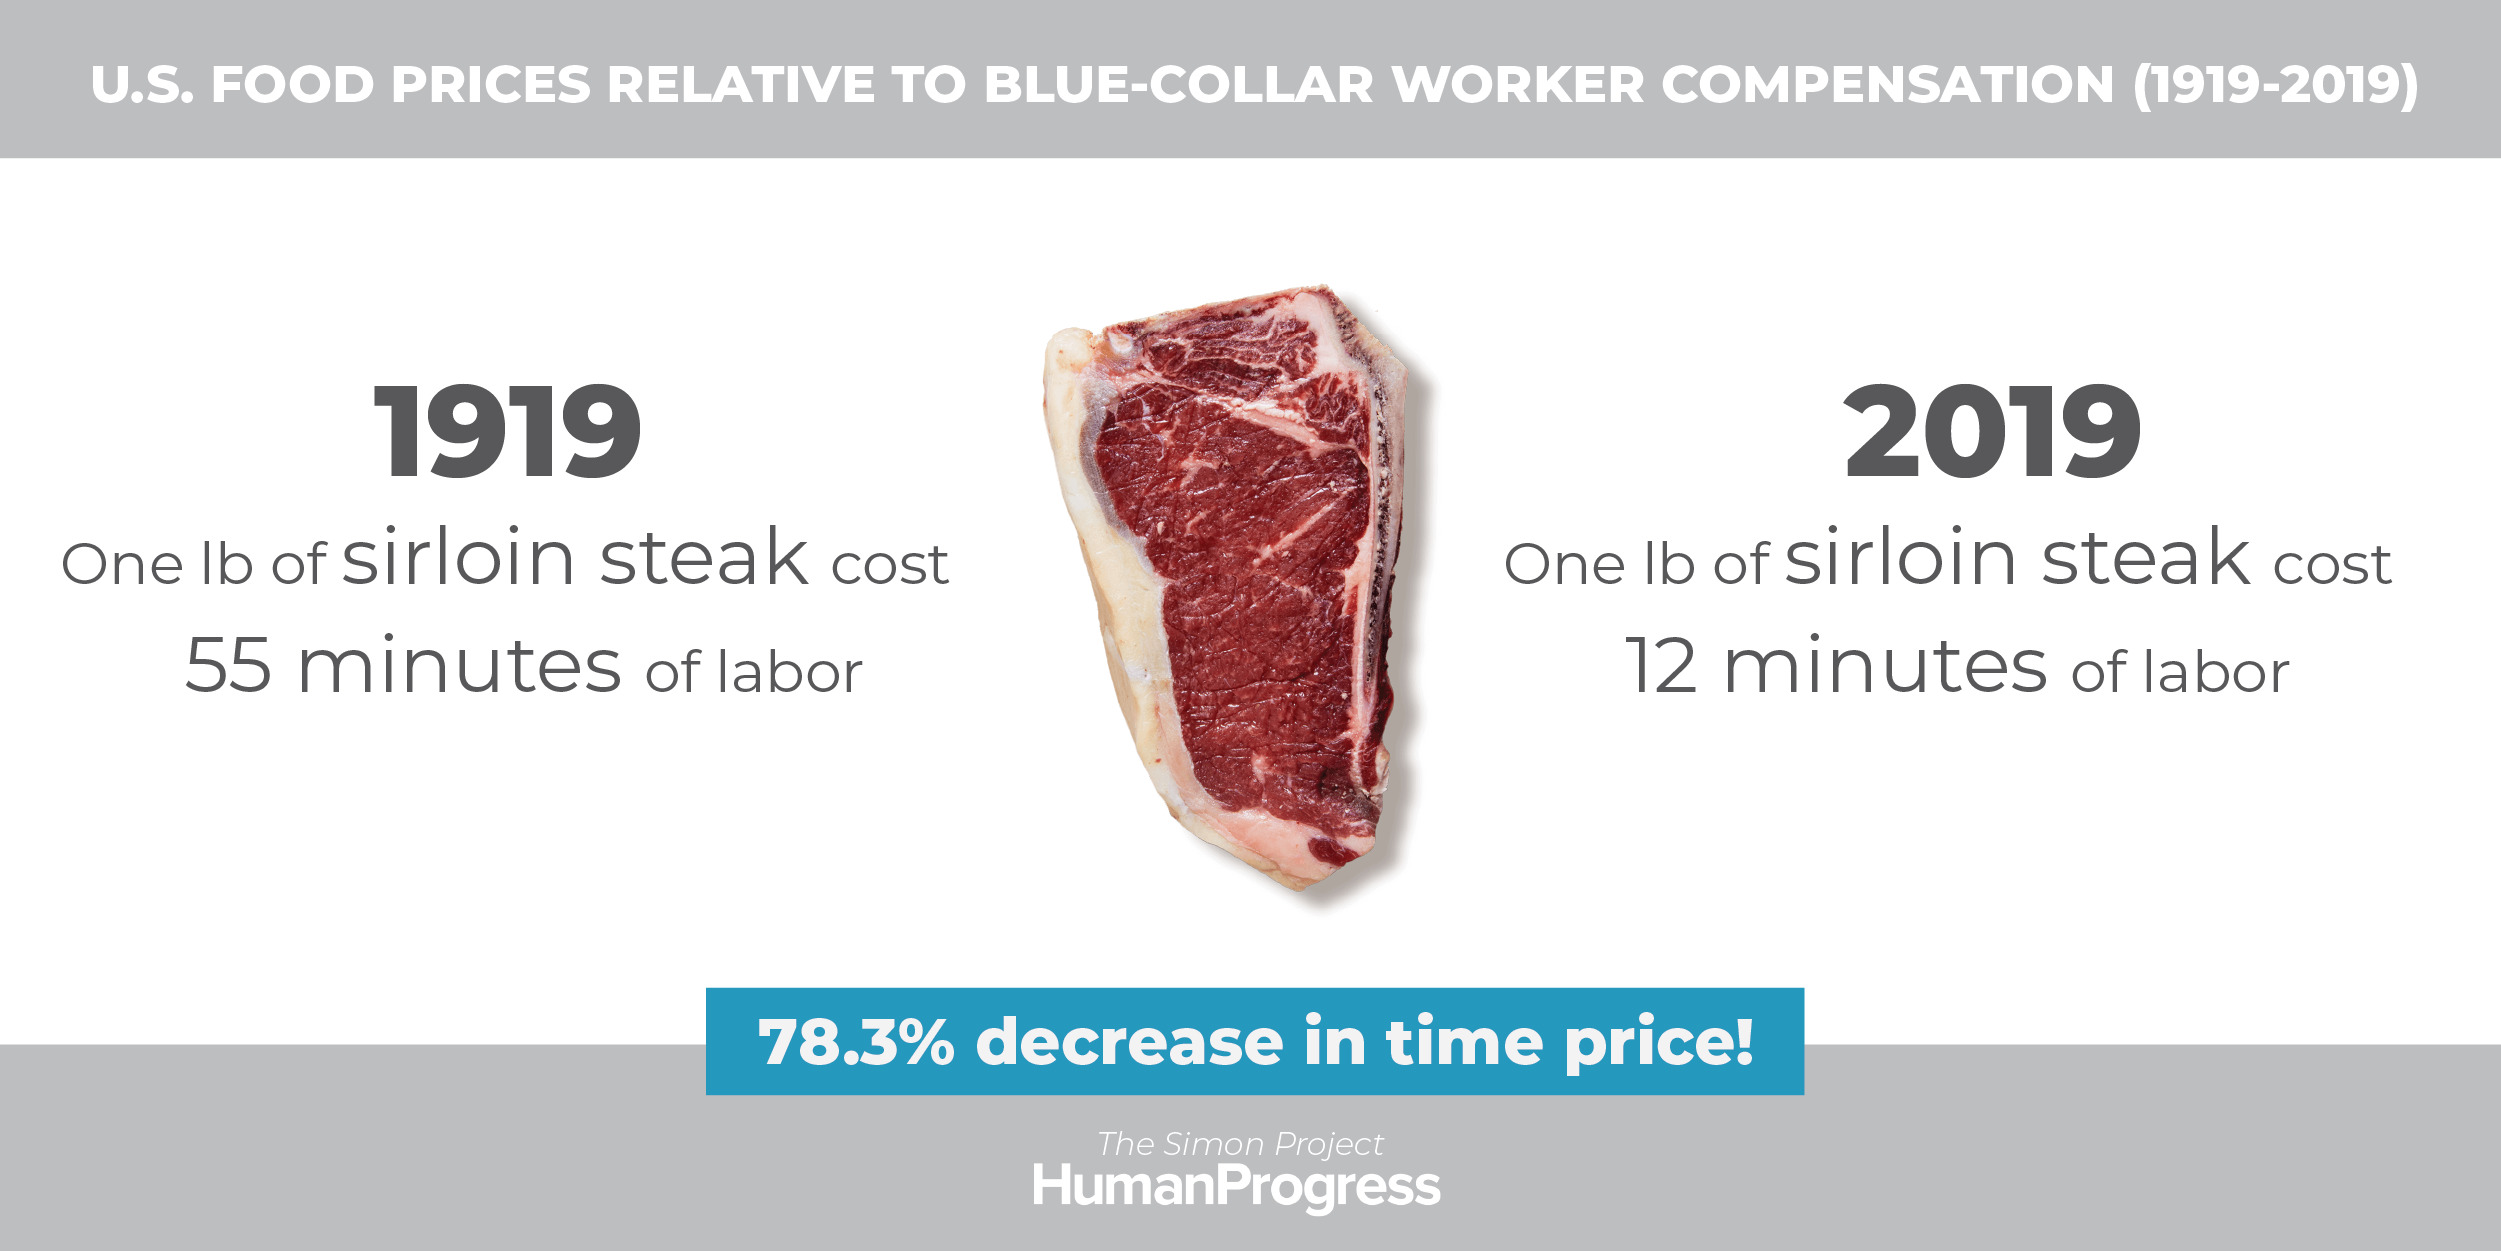
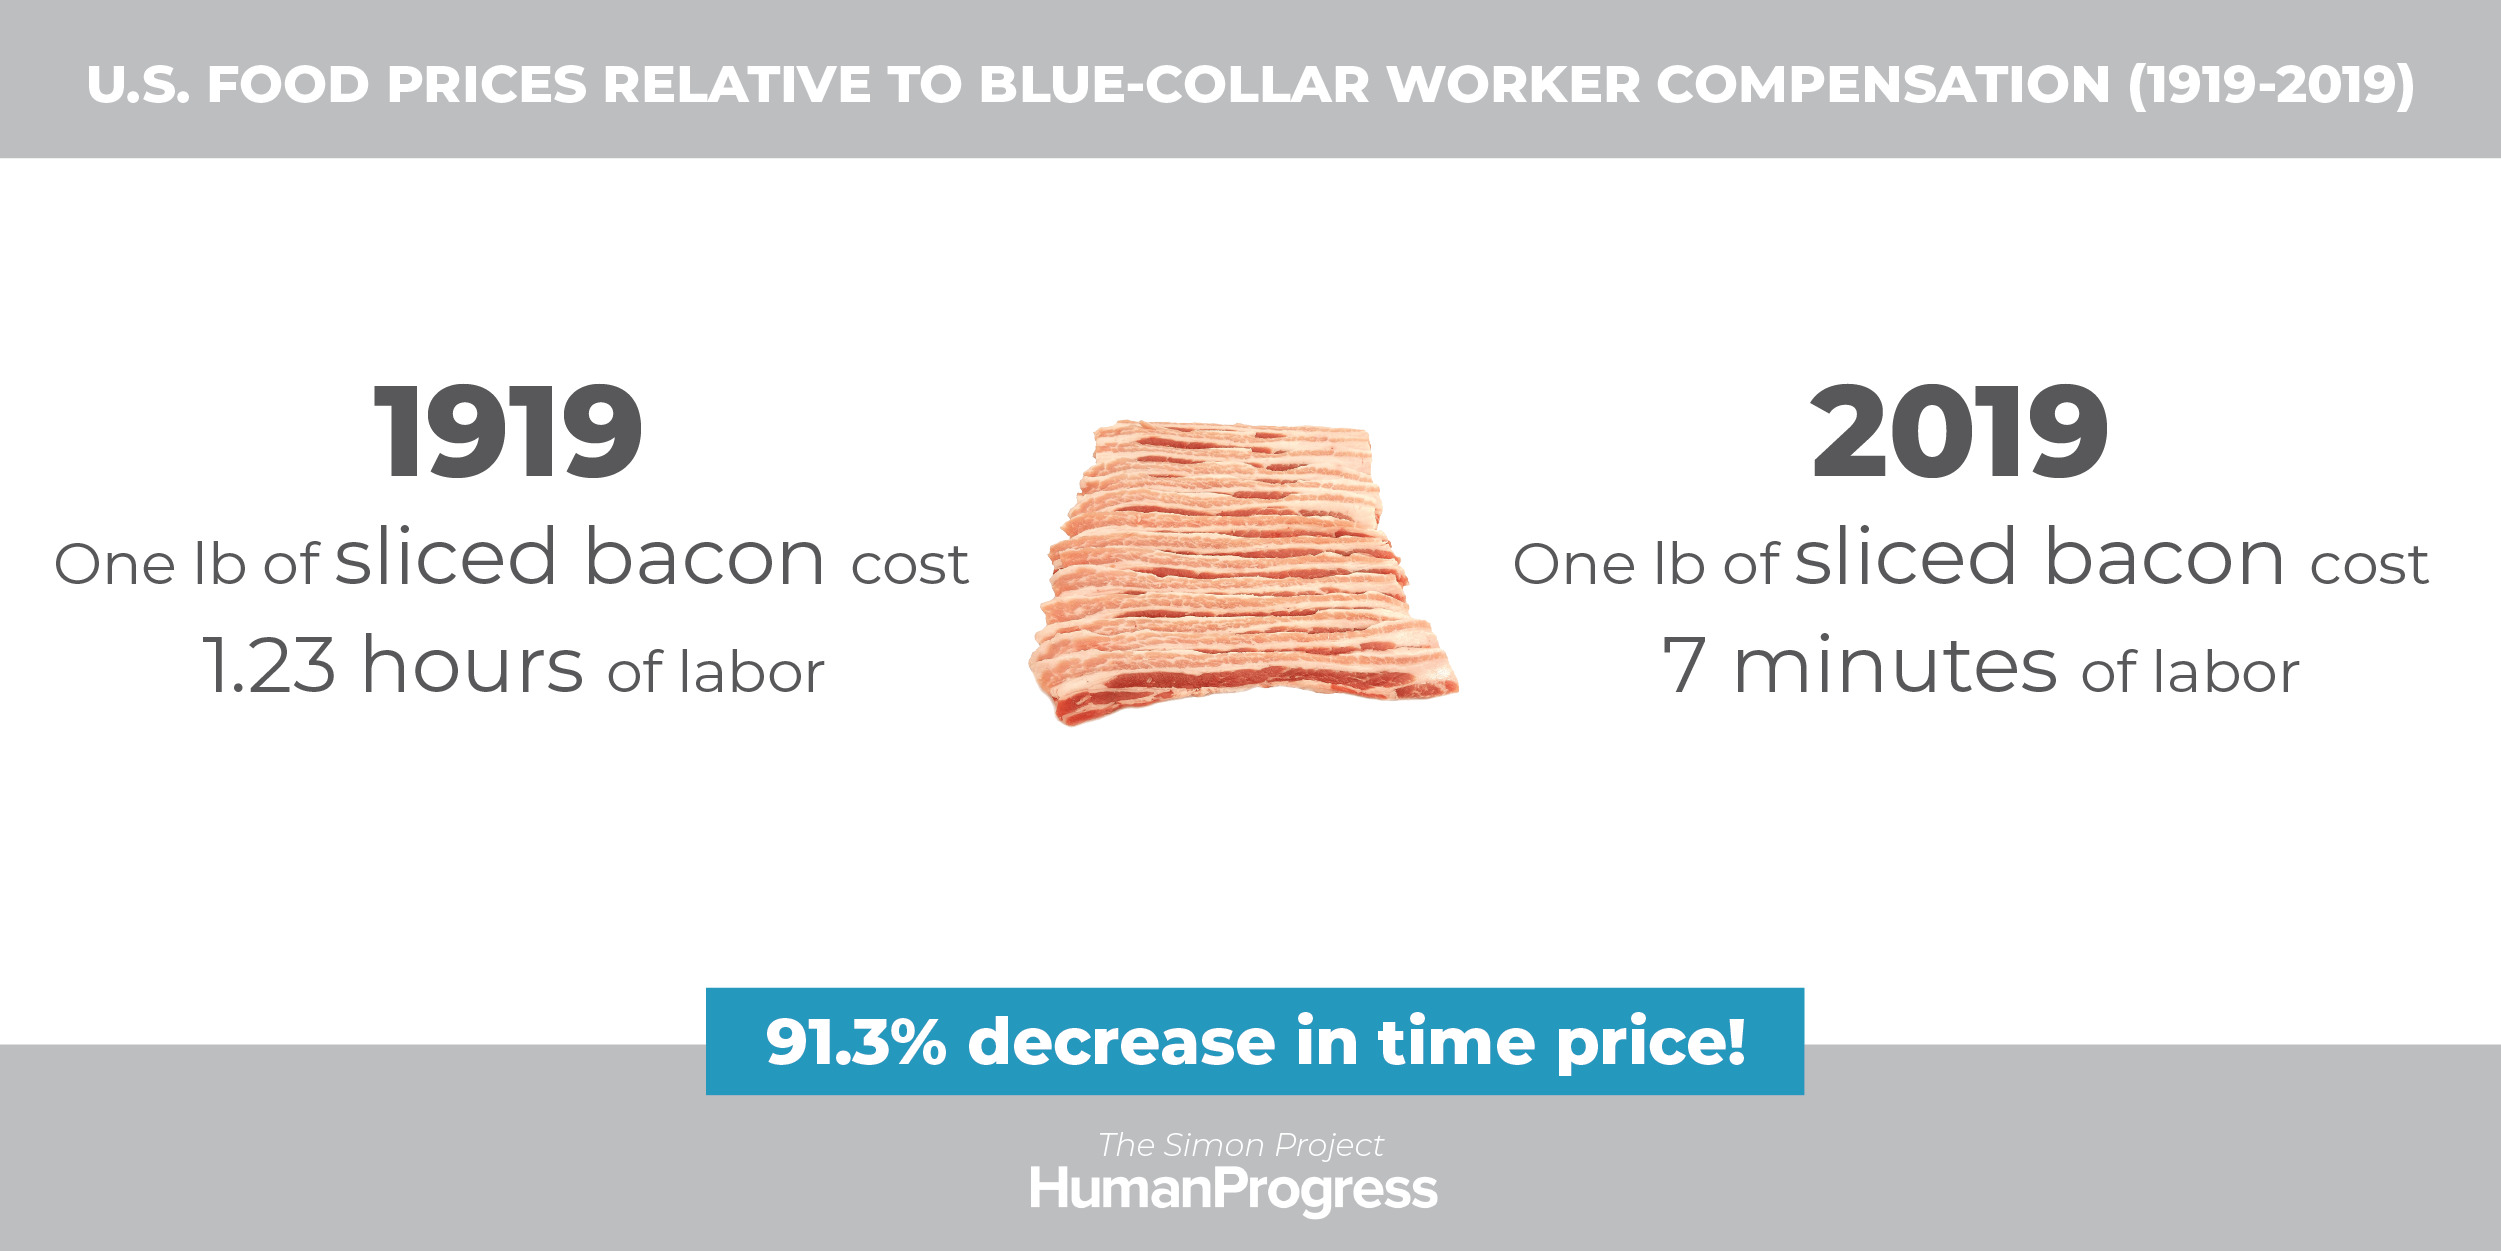
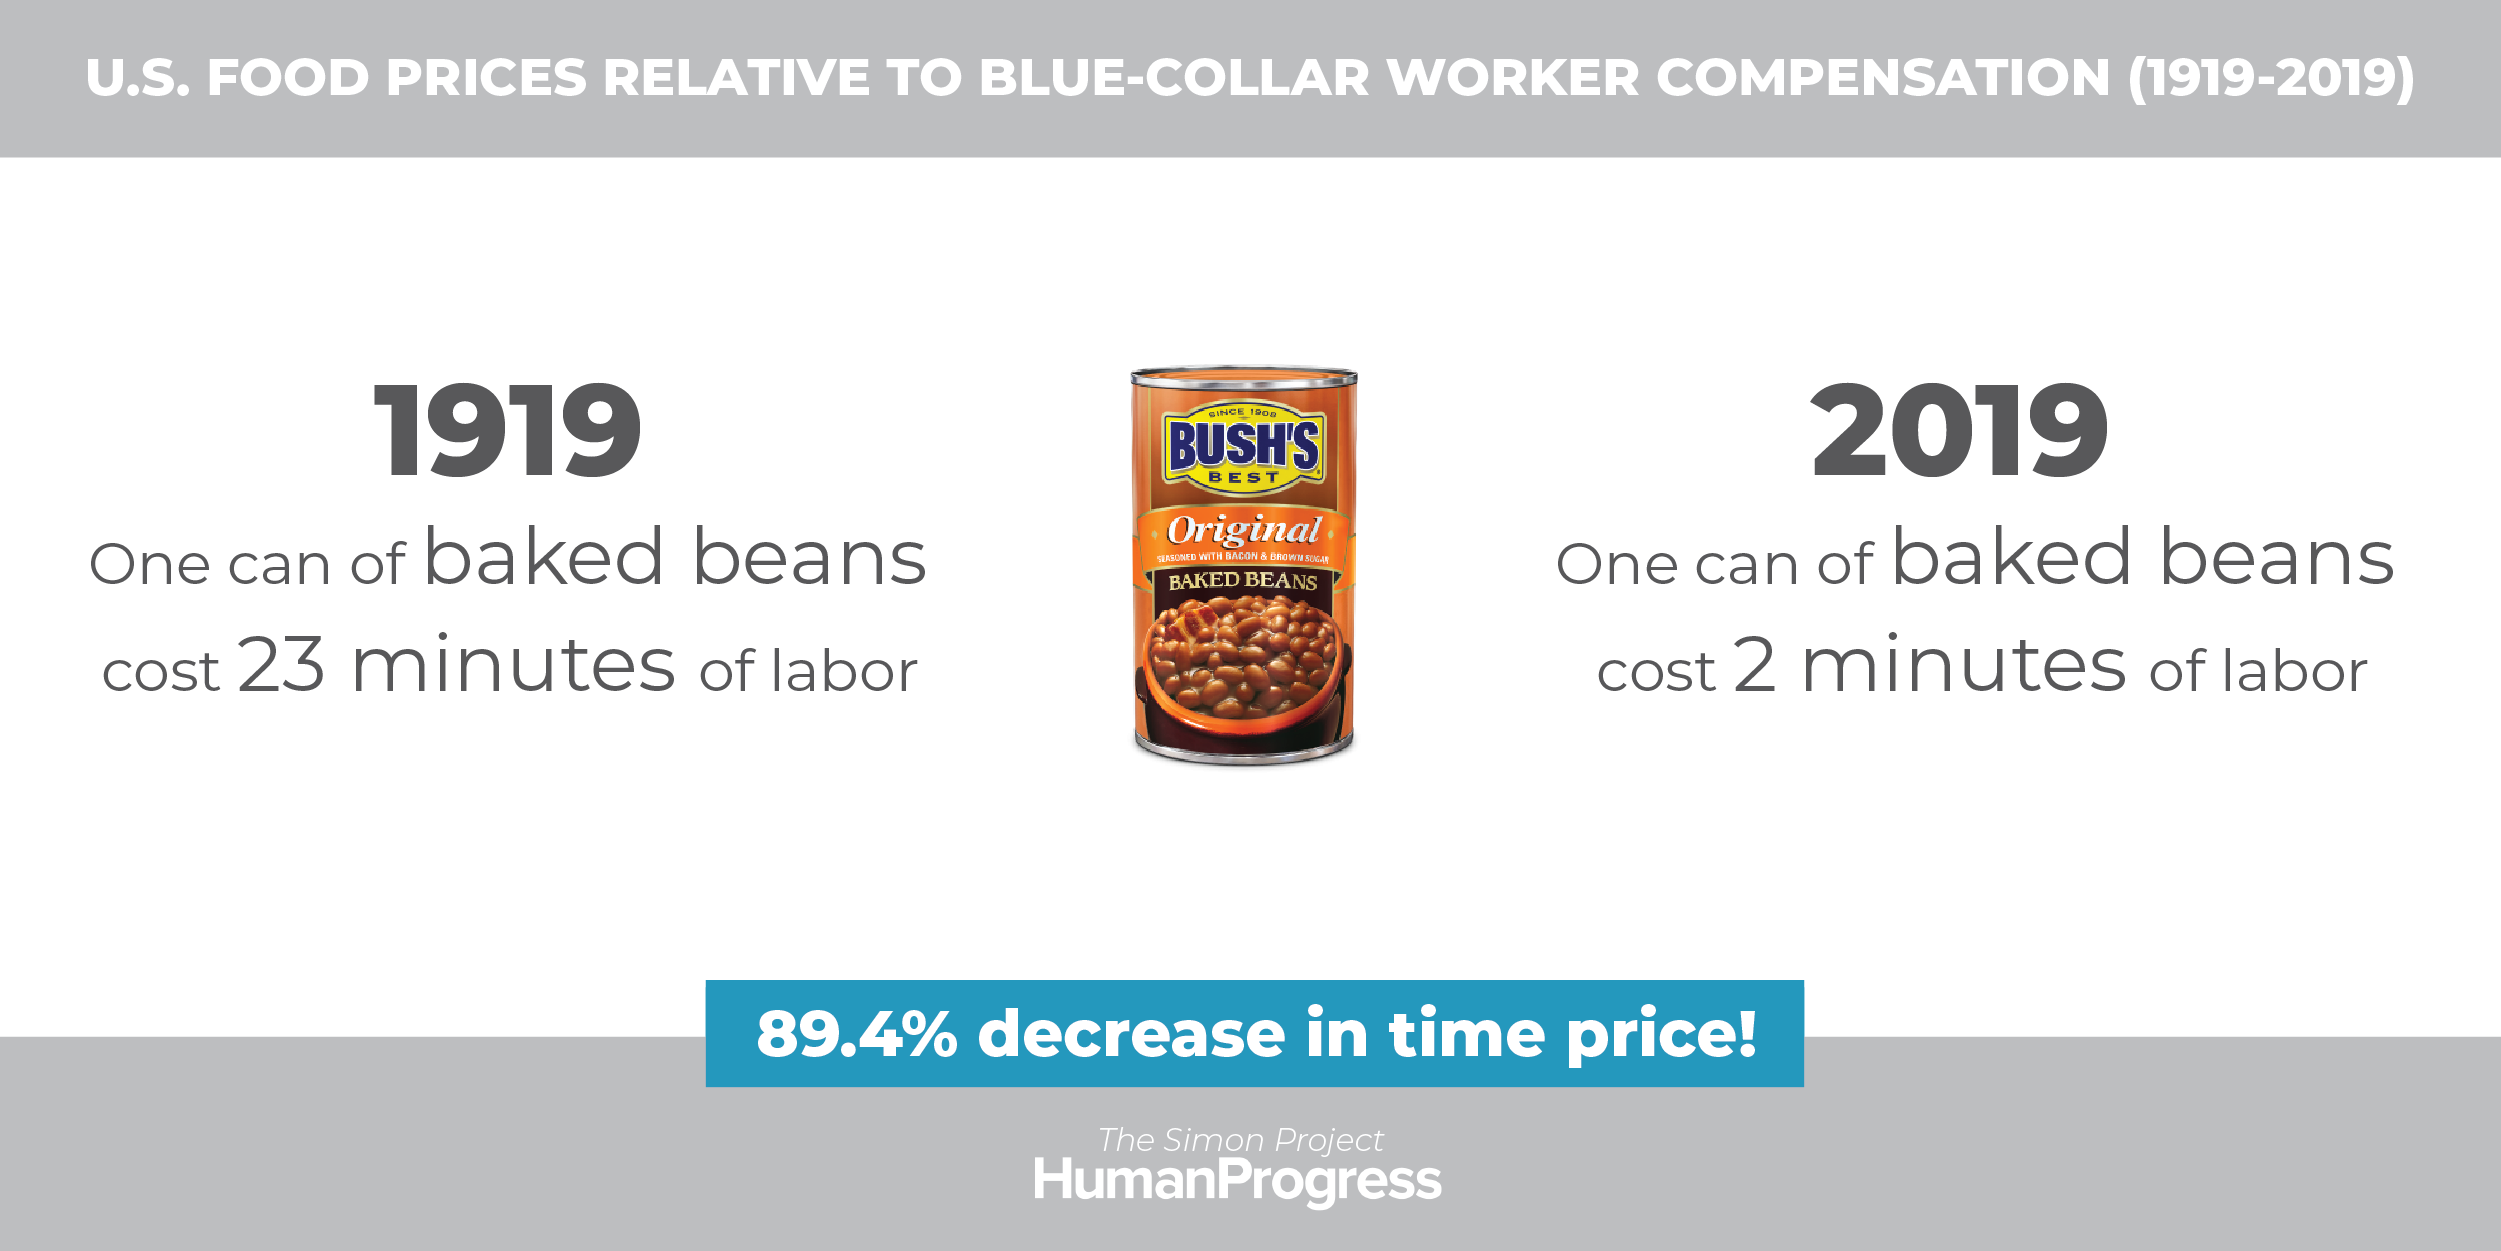
Having shown the massively decreasing cost of food in the United States in previous columns, I shall now turn to the cost of other everyday items, including appliances and clothing, between 1979 (the year before Reagan’s election) and 2019. Together with Gale Pooley, associate professor of business management at Brigham Young University-Hawaii, I looked at the prices of everyday items as they appeared in the 1979 Sears Christmas Book and compared them to the prices of identical (or almost identical) items as they appeared on Walmart’s website in 2019. We then divided the Sears’ prices by the hourly wage of unskilled workers in 1979 ($3.69) and Walmart’s prices by the hourly wage of unskilled workers in 2019 ($12.78).

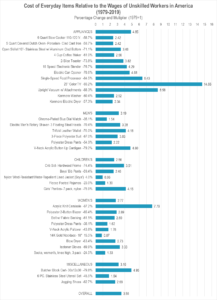
The average time price (i.e., the amount of time that a person has to work in order to earn enough money to buy something) of everyday items relative to the hourly wages of unskilled workers declined by 72 percent. It declined by 75 percent for skilled workers and by 89 percent for upskilling workers (i.e., workers who started as unskilled workers in 1979, but ended up as skilled workers in 2019). That means that for the same amount of work that allowed an unskilled worker to purchase one item in our basket of everyday items in 1979, he or she could buy 3.56 items in 2019 (on average). A skilled worker’s purchasing power increased from one to four and upskilling worker’s purchasing power increased from one to nine.

There are a lot of reasons for the rise of populism in the West, but one, almost trite, reason is often overlooked. Our schools and our media not only fail to educate the citizenry; they actively mis-educate the electorate. Instead of showing the unbelievable progress that humanity has made since the start of the Enlightenment some three centuries ago, history classes, to the extent that history is still taught, are used to whip up resentment and a sense of victimhood among different socio-economic, racial, ethnic, religious and gender groups. The media breathlessly repeat stories of (real and imagined) oppression and (supposed) economic retrenchment, even though people in the West currently enjoy a period of unprecedented peace and prosperity. Akki’s tweet is but a tiny part of a broader trend of victimhood-Olympics.

So, to the question that is so often raised by so many talking-heads on television, professors in the classroom and politicians making stump speeches – Why populism? – I have only one answer: look in the mirror.

This first appeared in CapX.