fbpx
01 / 05
Zimbabwe, Mugabe and the Human Nature of Politics

Blog Post | Government & Democracy

Zimbabwe, Mugabe and the Human Nature of Politics

It is rare for countries to get freer and richer after colonialism.

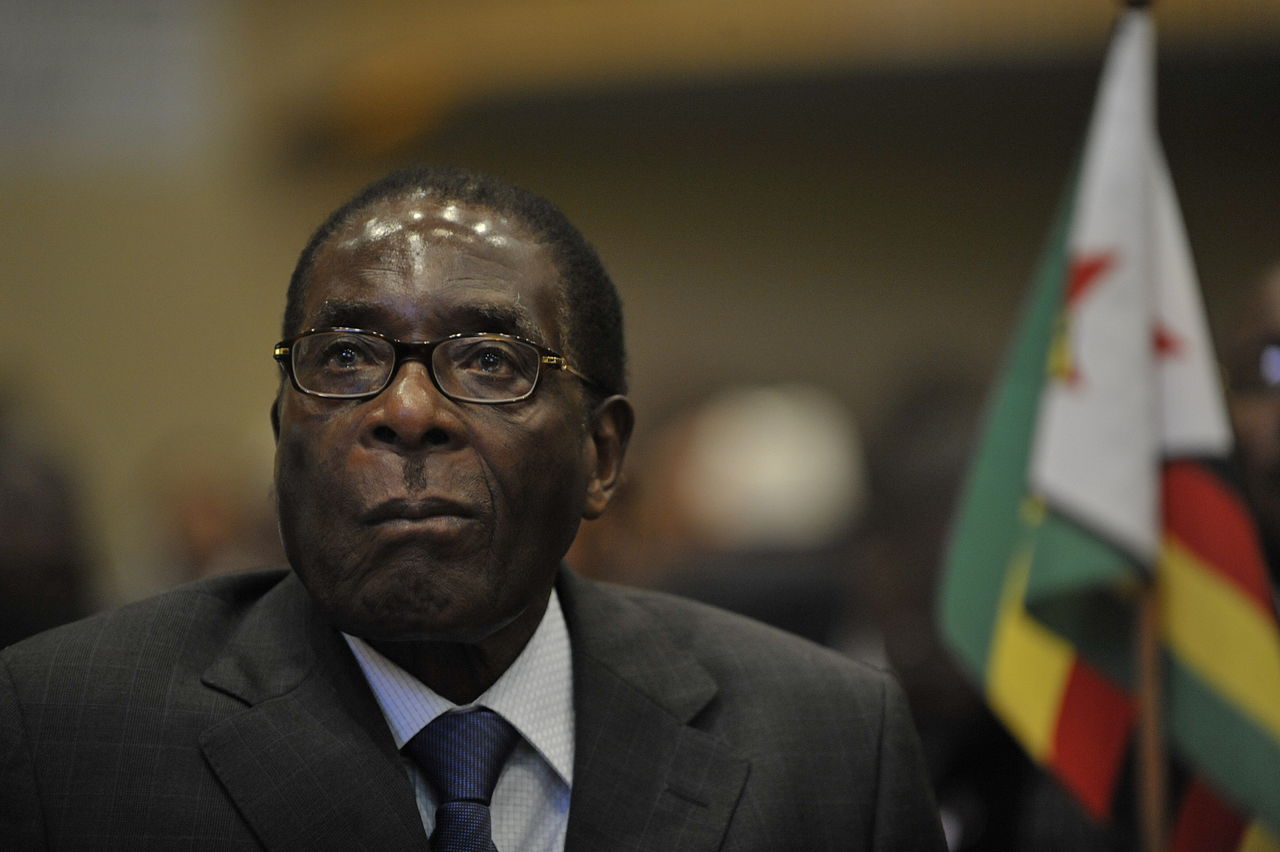
On CapX last week, I wrote about the unfolding military coup against Zimbabwe’s longtime ruler Robert Mugabe. Deserted by his erstwhile supporters and facing imminent impeachment in that country’s Parliament, the 93-year-old dictator finally threw in the towel and resigned earlier this week.

He will, it seems, be allowed to live out his remaining days in Zimbabwe and continue to enjoy the luxurious properties that he amassed during the 37 years in power. Judging by the spontaneous outburst of joy throughout the impoverished and tyrannised country, Mugabe’s resignation came none too soon.

Amid the celebrations, the BBC published an article titled, “Robert Mugabe: Is Zimbabwe’s ex-president a hero or villain?” My initial reaction was to dismiss Joseph Winter’s piece as yet another example of left-wing bias at the BBC. Zimbabwe, after all, is a ruined country. Upon reflection, however, the article seems to me to reflect a deeper truth – put plainly, people prefer to be mistreated by rulers who look like them, rather than be relatively well-governed by people perceived as foreign.

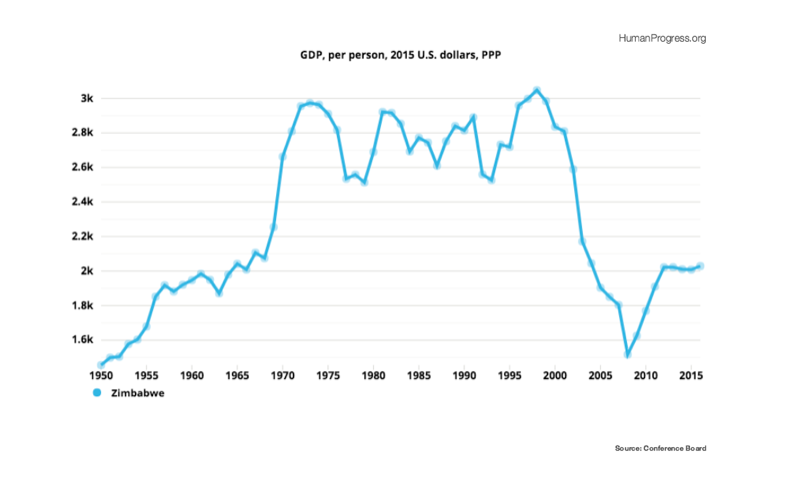
First, let’s briefly look at Mugabe’s legacy. Since coming to power in 1980, the dictator presided over years of economic stagnation and, eventually, decline. Judging by the data, incomes in what was then Rhodesia, roughly doubled between 1950 and 1973. Following the outbreak of the Bush War (i.e., the African struggle for independence from the European rule), incomes declined, but quickly rebounded after the end of hostilities and onset of majority rule. That’s where they remained until Mugabe’s catastrophic decision to expropriate commercial land in the early 2000, which wiped out half-century of income growth.

That decision was politically motivated, for farmers were largely supportive of the opposition Movement for Democratic Change. That brings me to the dictator’s political legacy. It may seem extraordinary, but Rhodesia was politically freer than Zimbabwe. To be crystal clear, political freedom does not mean racial equality. Rhodesia’s political system ensured that Europeans remained in charge. But, in terms of the rule of law and government accountability to the electorate, Rhodesia was more democratic than Zimbabwe was after the first two years of the majority rule (i.e., the time Mugabe needed to consolidate power).

So, objectively speaking (my economic data comes from the Conference Board and my political data comes from the Center for Systemic Peace), Zimbabweans were freer and experienced more rapid economic development during the minority rule than was the case under the majority rule. This was not an uncommon development. Following independence in the 1960s, many African countries saw both political and economic retrenchment. Rare is a country, like Botswana, which remained both democratic and grew more prosperous after the end of the colonial rule. These are, regrettably, empirical facts and not, as some might conclude, a pean to colonialism, which I oppose.

Second, Zimbabweans themselves are clearly conflicted about Mugabe’s legacy. As Winter writes in his BBC article, “For some, he [Mugabe] will always remain a hero who brought independence and an end to white-minority rule. Even those who forced him out blamed his wife and ‘criminals’ around him. But to his growing number of critics, this highly educated, wily politician became the caricature of an African dictator, who destroyed an entire country in order to keep his job.” So, was the end of the minority rule worth the destruction of the country’s economy and erosion of its political institutions?

This is not an easy question, but Isaiah Berlin’s 1958 inaugural lecture at Oxford University titled “Two Concepts of Liberty” may provide an answer. In that essay, Berlin wrote:

“I may feel unfree in the sense of not being recognised as a self-governing individual human being; but I may feel it also as a member of an unrecognised or insufficiently respected group: then I wish for the emancipation of my entire class, or community, or nation, or race, or profession.

So much can I desire this, that I may, in my bitter longing for status, prefer to be bullied and misgoverned by some member of my own race or social class, by whom I am, nevertheless, recognised as a man and a rival – that is as an equal – to being well and tolerantly treated by someone from some higher and remoter group, who does not recognise me for what I wish to feel myself to be.

It is this desire for reciprocal recognition that leads the most authoritarian democracies to be, at times, consciously preferred by its members to the most enlightened oligarchies, or sometimes causes a member of some newly liberated Asian or African state to complain less today, when he is rudely treated by members of his own race or nation, than when he was governed by some cautious, gentle, well meaning administrator from outside.”

I think that Berlin is, probably, correct. Rhodesia may have achieved better economic outcomes than Zimbabwe, but those came at a cost of denying the African majority its desire for self-determination. The sorry history of Zimbabwe, then, reminds us of an obvious fact: people are not machines carefully evaluating merely the material costs and benefits of their actions. They are beings driven by passions, which can lead to outcomes that are far from optimal.

This piece first appeared in CapX

Blog Post | Energy & Natural Resources

The Simon Abundance Index 2024

The Earth was 509.4 percent more abundant in 2023 than it was in 1980.

The Simon Abundance Index (SAI) quantifies and measures the relationship between resources and population. The SAI converts the relative abundance of 50 basic commodities and the global population into a single value. The index started in 1980 with a base value of 100. In 2023, the SAI stood at 609.4, indicating that resources have become 509.4 percent more abundant over the past 43 years. All 50 commodities were more abundant in 2023 than in 1980.

Figure 1: The Simon Abundance Index: 1980–2023 (1980 = 100)

The SAI is based on the ideas of University of Maryland economist and Cato Institute senior fellow Julian Simon, who pioneered research on and analysis of the relationship between population growth and resource abundance. If resources are finite, Simon’s opponents argued, then an increase in population should lead to higher prices and scarcity. Yet Simon discovered through exhaustive research over many years that the opposite was true. As the global population increased, virtually all resources became more abundant. How is that possible?

Simon recognized that raw materials without the knowledge of how to use them have no economic value. It is knowledge that transforms raw materials into resources, and new knowledge is potentially limitless. Simon also understood that it is only human beings who discover and create knowledge. Therefore, resources can grow infinitely and indefinitely. In fact, human beings are the ultimate resource.

Visualizing the Change

Resource abundance can be measured at both the personal level and the population level. We can use a pizza analogy to understand how that works. Personal-level abundance measures the size of an individual pizza slice. Population-level abundance measures the size of the entire pizza pie. The pizza pie can get larger in two ways: the slices can get larger, or the number of slices can increase. Both can happen at the same time.

Growth in resource abundance can be illustrated by comparing two box charts. Create the first chart, representing the population on the horizontal axis and personal resource abundance on the vertical axis. Draw a yellow square to represent the start year of 1980. Index both population and personal resource abundance to a value of one. Then draw a second chart for the end year of 2023. Use blue to distinguish this second chart. Scale it horizontally for the growth in population and vertically for the growth in personal resource abundance from 1980. Finally, overlay the yellow start-year chart on the blue end-year chart to see the difference in resource abundance between 1980 and 2023.

Figure 2: Visualization of the Relationship between Global Population Growth and Personal Resource Abundance of the 50 Basic Commodities (1980–2023)

Between 1980 and 2023, the average time price of the 50 basic commodities fell by 70.4 percent. For the time required to earn the money to buy one unit of this commodity basket in 1980, you would get 3.38 units in 2023. Consequently, the height of the vertical personal resource abundance axis in the blue box has risen to 3.38. Moreover, during this 43-year period, the world’s population grew by 3.6 billion, from 4.4 billion to over 8 billion, indicating an 80.2 percent increase. As such, the width of the blue box on the horizontal axis has expanded to 1.802. The size of the blue box, therefore, has grown to 3.38 by 1.802, or 6.094 (see the middle box in Figure 2).

As the box on the right shows, personal resource abundance grew by 238 percent; the population grew by 80.2 percent. The yellow start box has a size of 1.0, while the blue end box has a size of 6.094. That represents a 509.4 percent increase in population-level resource abundance. Population-level resource abundance grew at a compound annual rate of 4.3 percent over this 43-year period. Also note that every 1-percentage-point increase in population corresponded to a 6.35-percentage-point increase in population-level resource abundance (509.4 ÷ 80.2 = 6.35).

Individual Commodity Changes: 1980–2023

As noted, the average time price of the 50 basic commodities fell by 70.4 percent between 1980 and 2023. As such, the 50 commodities became 238.1 percent more abundant (on average). Lamb grew most abundant (675.1 percent), while the abundance of coal grew the least (30.7 percent).

Figure 3: Individual Commodities, Percentage Change in Time Price and Percentage Change in Abundance: 1980–2023

Individual Commodity Changes: 2022–2023

The SAI increased from a value of 520.1 in 2022 to 609.4 in 2023, indicating a 17.1 percent increase. Over those 12 months, 37 of the 50 commodities in the data set increased in abundance, while 13 decreased in abundance. Abundance ranged from a 220.8 percent increase for natural gas in Europe to a 38.9 percent decrease for oranges.

Figure 4: Individual Commodities, Percentage Change in Abundance: 2022–2023

Conclusion

After a sharp downturn between 2021 and 2022, which was caused by the COVID-19 pandemic, government lockdowns and accompanying monetary expansion, and the Russian invasion of Ukraine, the SAI is making a strong recovery. As noted, since 1980 resource abundance has been increasing at a much faster rate than population. We call that relationship superabundance. We explore this topic in our book Superabundance: The Story of Population Growth, Innovation, and Human Flourishing on an Infinitely Bountiful Planet.

Appendix A: Alternative Figure 1 with a Regression Line, Equation, R-Square, and Population

Appendix B: The Basic 50 Commodities Analysis: 1980–2023

Appendix C: Why Time Is Better Than Money for Measuring Resource Abundance

To better understand changes in our standard of living, we must move from thinking in quantities to thinking in prices. While the quantities of a resource are important, economists think in prices. This is because prices contain more information than quantities. Prices indicate if a product is becoming more or less abundant.

But prices can be distorted by inflation. Economists attempt to adjust for inflation by converting a current or nominal price into a real or constant price. This process can be subjective and contentious, however. To overcome such problems, we use time prices. What is most important to consider is how much time it takes to earn the money to buy a product. A time price is simply the nominal money price divided by the nominal hourly income. Money prices are expressed in dollars and cents, while time prices are expressed in hours and minutes. There are six reasons time is a better way than money to measure prices.

First, time prices contain more information than money prices do. Since innovation lowers prices and increases wages, time prices more fully capture the benefits of valuable new knowledge and the growth in human capital. To just look at prices without also looking at wages tells only half the story. Time prices make it easier to see the whole picture.

Second, time prices transcend the complications associated with converting nominal prices to real prices. Time prices avoid subjective and disputed adjustments such as the Consumer Price Index (CPI), the GDP Deflator or Implicit Price Deflator (IPD), the Personal Consumption Expenditures price index (PCE), and the Purchasing Power Parity (PPP). Time prices use the nominal price and the nominal hourly income at each point in time, so inflation adjustments are not necessary.

Third, time prices can be calculated on any product with any currency at any time and in any place. This means you can compare the time price of bread in France in 1850 to the time price of bread in New York in 2023. Analysts are also free to select from a variety of hourly income rates to use as the denominator when calculating time prices.

Fourth, time is an objective and universal constant. As the American economist George Gilder has noted, the International System of Units (SI) has established seven key metrics, of which six are bounded in one way or another by the passage of time. As the only irreversible element in the universe, with directionality imparted by thermodynamic entropy, time is the ultimate frame of reference for almost all measured values.

Fifth, time cannot be inflated or counterfeited. It is both fixed and continuous.

Sixth, we have perfect equality of time with exactly 24 hours in a day. As such, we should be comparing time inequality, not income inequality. When we measure differences in time inequality instead of income inequality, we get an even more positive view of the global standards of living.

These six reasons make using time prices superior to using money prices for measuring resource abundance. Time prices are elegant, intuitive, and simple. They are the true prices we pay for the things we buy.

The World Bank and the International Monetary Fund (IMF) track and report nominal prices on a wide variety of basic commodities. Analysts can use any hourly wage rate series as the denominator to calculate the time price. For the SAI, we created a proxy for global hourly income by using data from the World Bank and the Conference Board to calculate nominal GDP per hour worked.

With this data, we calculated the time prices for all 50 of the basic commodities for each year and then compared the change in time prices over time. If time prices are decreasing, personal resource abundance is increasing. For example, if a resource’s time price decreases by 50 percent, then for the same amount of time you get twice as much, or 100 percent more. The abundance of that resource has doubled. Or, to use the pizza analogy, an individual slice is twice as large. If the population increases by 25 percent over the same period, there will be 25 percent more slices. The pizza pie will thus be 150 percent larger [(2.0 x 1.25) – 1].

Board of Governors of the Federal Reserve System | Economic Growth

Income Growth Over Five Generations of Americans

“We find that each of the past four generations of Americans was better off than the previous one, using a post-tax, post-transfer income measure constructed annually from 1963-2022 based on the Current Population Survey Annual Social and Economic Supplement.”

From Board of Governors of the Federal Reserve System.

Blog Post | Human Development

1,000 Bits of Good News You May Have Missed in 2023

A necessary balance to the torrent of negativity.

Reading the news can leave you depressed and misinformed. It’s partisan, shallow, and, above all, hopelessly negative. As Steven Pinker from Harvard University quipped, “The news is a nonrandom sample of the worst events happening on the planet on a given day.”

So, why does Human Progress feature so many news items? And why did I compile them in this giant list? Here are a few reasons:

  • Negative headlines get more clicks. Promoting positive stories provides a necessary balance to the torrent of negativity.
  • Statistics are vital to a proper understanding of the world, but many find anecdotes more compelling.
  • Many people acknowledge humanity’s progress compared to the past but remain unreasonably pessimistic about the present—not to mention the future. Positive news can help improve their state of mind.
  • We have agency to make the world better. It is appropriate to recognize and be grateful for those who do.

Below is a nonrandom sample (n = ~1000) of positive news we collected this year, separated by topic area. Please scroll, skim, and click. Or—to be even more enlightened—read this blog post and then look through our collection of long-term trends and datasets.

Agriculture

Aquaculture

Farming robots and drones

Food abundance

Genetic modification

Indoor farming

Lab-grown produce

Pollination

Other innovations

Conservation and Biodiversity

Big cats

Birds

Turtles

Whales

Other comebacks

Forests

Reefs

Rivers and lakes

Surveillance and discovery

Rewilding and conservation

De-extinction

Culture and tolerance

Gender equality

General wellbeing

LGBT

Treatment of animals

Energy and natural Resources

Fission

Fusion

Fossil fuels

Other energy

Recycling and resource efficiency

Resource abundance

Environment and pollution

Climate change

Disaster resilience

Air pollution

Water pollution

Growth and development

Education

Economic growth

Housing and urbanization

Labor and employment

Health

Cancer

Disability and assistive technology

Dementia and Alzheimer’s

Diabetes

Heart disease and stroke

Other non-communicable diseases

HIV/AIDS

Malaria

Other communicable diseases

Maternal care

Fertility and birth control

Mental health and addiction

Weight and nutrition

Longevity and mortality 

Surgery and emergency medicine

Measurement and imaging

Health systems

Other innovations

Freedom

    Technology 

    Artificial intelligence

    Communications

    Computing

    Construction and manufacturing

    Drones

    Robotics and automation

    Autonomous vehicles

    Transportation

    Other innovations

    Science

    AI in science

    Biology

    Chemistry and materials

      Physics

      Space

      Violence

      Crime

      War