fbpx
01 / 05
Xiaogang: How a Village Went Forward While China Went Back

Blog Post | Economic Freedom

Xiaogang: How a Village Went Forward While China Went Back

Mao’s “Great Leap Forward” caused widespread famines. The small village of Xiaogang had suffered enough under communist principles, so residents decided to implement private property—and the results of this experiment changed the whole nation of China.

This article was originally published at Libertarianism.org on 11/17/2023.

In 1981, 88 percent of the Chinese population lived in extreme poverty. Today, this figure is less than one percent. In a country composed of nearly 1.5 billion people, that means hundreds of millions of people became more prosperous than ever over about four decades—hardly any time at all compared to China’s 3,500-year history.

Classical liberals and libertarians have observed throughout history that cities are disproportionately the centers of technological and economic development. However, for every rule, there is an exception. The rural village of Xiaogang in China, though small, is that exception: one that transformed not only China’s economy but, inadvertently, the whole globe’s.

The Great Leap Forward and Mass Starvation

A devout advocate of communism, Mao Zedong implemented a state-​run economy. Bureaucrats decided what workers produced, who to hire or lay off, how much to invest, and what workers were paid. State-​owned enterprises, where the only “enterprise” to be found was in the name, were dead weight on the economy and chronically underperformed.

Some opposed the Soviet-​style model of economic planning being implemented in China, such as Gu Zhun and Sun Yefang. In 1956, Gu argued for the importance of the market even in a socialist economy. For his writings, he was denounced as a “rightist” and spent most of his remaining life behind bars or in re-​education centers. Sun observed that state-​owned enterprises lacked autonomy, they could not adapt to local circumstances. For his ideas, Sun was labeled a “revisionist” and was imprisoned for seven years during the Cultural Revolution.

Though behind bars, the observations of Gu and Sun proved prophetic after the disastrous policies of Mao’s infamous Great Leap Forward.

The Great Leap Forward was a large-​scale social and economic campaign initiated by the Chinese Communist Party in 1958 to rapidly transform China from an agrarian to a socialist society through industrialization and subsequent collectivization. The chronic underfunding of agriculture and the glaring inefficiency of collectivization led to critical declines in food production. Historians estimate tens of millions died from starvation through mismanagement by the state during this period.

After the death of Mao Zedong in 1976, fervor for a state-​run, collectivized economy fizzled. By December of 1978, the Third Plenary Session of the 11th Central Committee of the Communist Party of China (CPC) was held in Beijing, an event recognized as the beginning of China’s economic reforms and the opening up of its economy. The ensuing market liberalization propelled China from a stagnant socialist society to a dynamic economic powerhouse that has since shocked the globe.

But before politicians in Beijing relaxed their grip on the economy, large parts of rural China had been ignoring state policy for years. Xiaogang’s villagers drafted the blueprints for China’s meteoric rise.

Xiaogang Goes Rogue

The Great Leap Forward and misguided collectivist policies had the worst impact on provinces like Anhui. In the winter of 1978, in the province of Anhui, the impoverished villagers of Xiaogang gathered together for a group meeting about their future survival. Recent harvests under collectivization were yielding worse and worse results. The villagers decided that rather than farming as a collective, each family would tend to their own plot of land, keeping the fruits of their labor.

Eighteen heads of households signed a document that formalized some simple rules. Each signatory took an oath of silence and pledged to look after one another’s children if anyone was killed or arrested for breaking collectivist policy. The document was hidden inside a piece of bamboo on the roof of a farmhouse.

With villagers now autonomous, and responsible for their individual profits and losses, Xiaogang quickly became successful, producing a greatly increased crop only a year after the secret agreement was made. Understanding the plight of farmers, local state officials stayed quiet and allowed Xiaogang to continue. Though kept a secret, the example of Xiaogang spread, and other villages encountered similar successes. The peripheries of China were experimenting with the cornerstone of the future market economy: private property.

While the state stalled, real change occurred where state control was weakest. On the margins of China, a series of quiet revolutions paved the way for markets to flourish. Before politicians in Beijing relaxed bans on private farming, farmers had already adopted the practice throughout rural China, especially Anhui. Private property proved to be an economic tonic worth every drop. State officials began to notice marked improvements from what were formerly the poorest areas. The Chinese government softened its policy, admitting that markets and private property would be necessary to a prosperous, modernized China.

China’s Future

The Third Plenary Session which reformed the Chinese economy is now recognized as a pivotal turning point in China’s economic miracle. It was influenced by the example of a small group of farmers. Over the following three decades, the world’s most populous country transformed from a poor, stagnant, socialist economy into an economic powerhouse. Villages like Xiaogang rediscovered the benefits of private property. Farmers could make their own decisions and for the first time in decades their potential was unleashed.

The turn to private property and individual responsibility in the midst of Mao’s disastrous experiments in collectivism was not inconsistent with aspects of Chinese tradition. In the Tao Te Ching, the 5th century BC philosopher Laozi argued the state should rarely interfere with people’s lives, writing, “Governing a large country is like frying a small fish. You spoil it with too much poking.” Mencius, a student of Confucius, believed in free trade, and when describing a well-​run state to King Hsüan of Qi, he explained that good kings kept taxes low, promoted trade, and raised no tariffs or levies on goods. The 17th-​century scholar Huang Xongxi advocated for a constitutional system with a separation of powers and strong protections on private property. The Chinese people are by no means innately collectivist.

Xiaogang is evidence that prosperity does not come from state action, but rather arises out of the humble efforts of everyday people to make the world a better place. World history is shaped by great political leaders and powers but Xiaogang also shows us how unlikely people can find themselves at the head of a quiet revolution.

Though private property is no longer illegal, China is nowhere near being a liberal society. China tragically remains an authoritarian country. But when a country of over a billion people leans towards the market, the entire globe feels its weight shift. China did not become a laissez faire society overnight, powerful barriers to liberty remain. The Third Plenary Session did not plan for a “Great Leap” to capitalism, only a small step—but there is no step towards liberty too small to be celebrated and applauded.

BBC | Agriculture

Farmer’s One of First to Use AI Driverless Tractors

“A farmer has become one of the first in the UK to use driverless tractors.

Will Mumford, an arable farmer in St Neots, Cambridgeshire, has used an autonomous vehicle to cultivate soil and another to plant seeds.

He said the robots were the future of farming as they could operate for up to 30 hours at a time and cause less damage to the land.

However, it is believed they would have to reduce in price before conventional machinery was replaced en masse.”

From BBC.

The Guardian | Food Production

Finnish Startup Begins Making Food “From Air and Solar Power”

“Nothing appears remarkable about a dish of fresh ravioli made with solein. It looks and tastes the same as normal pasta.

But the origins of the proteins which give it its full-bodied flavour are extraordinary: they come from Europe’s first factory dedicated to making human food from electricity and air.

The factory’s owner, Solar Foods, has started production at a site in Vantaa, near the Finnish capital of Helsinki, that will be able to produce 160 tonnes of food a year. It follows several years of experimenting at lab scale.”

From The Guardian.

Blog Post | Energy & Natural Resources

The Simon Abundance Index 2024

The Earth was 509.4 percent more abundant in 2023 than it was in 1980.

The Simon Abundance Index (SAI) quantifies and measures the relationship between resources and population. The SAI converts the relative abundance of 50 basic commodities and the global population into a single value. The index started in 1980 with a base value of 100. In 2023, the SAI stood at 609.4, indicating that resources have become 509.4 percent more abundant over the past 43 years. All 50 commodities were more abundant in 2023 than in 1980.

Figure 1: The Simon Abundance Index: 1980–2023 (1980 = 100)

The SAI is based on the ideas of University of Maryland economist and Cato Institute senior fellow Julian Simon, who pioneered research on and analysis of the relationship between population growth and resource abundance. If resources are finite, Simon’s opponents argued, then an increase in population should lead to higher prices and scarcity. Yet Simon discovered through exhaustive research over many years that the opposite was true. As the global population increased, virtually all resources became more abundant. How is that possible?

Simon recognized that raw materials without the knowledge of how to use them have no economic value. It is knowledge that transforms raw materials into resources, and new knowledge is potentially limitless. Simon also understood that it is only human beings who discover and create knowledge. Therefore, resources can grow infinitely and indefinitely. In fact, human beings are the ultimate resource.

Visualizing the Change

Resource abundance can be measured at both the personal level and the population level. We can use a pizza analogy to understand how that works. Personal-level abundance measures the size of an individual pizza slice. Population-level abundance measures the size of the entire pizza pie. The pizza pie can get larger in two ways: the slices can get larger, or the number of slices can increase. Both can happen at the same time.

Growth in resource abundance can be illustrated by comparing two box charts. Create the first chart, representing the population on the horizontal axis and personal resource abundance on the vertical axis. Draw a yellow square to represent the start year of 1980. Index both population and personal resource abundance to a value of one. Then draw a second chart for the end year of 2023. Use blue to distinguish this second chart. Scale it horizontally for the growth in population and vertically for the growth in personal resource abundance from 1980. Finally, overlay the yellow start-year chart on the blue end-year chart to see the difference in resource abundance between 1980 and 2023.

Figure 2: Visualization of the Relationship between Global Population Growth and Personal Resource Abundance of the 50 Basic Commodities (1980–2023)

Between 1980 and 2023, the average time price of the 50 basic commodities fell by 70.4 percent. For the time required to earn the money to buy one unit of this commodity basket in 1980, you would get 3.38 units in 2023. Consequently, the height of the vertical personal resource abundance axis in the blue box has risen to 3.38. Moreover, during this 43-year period, the world’s population grew by 3.6 billion, from 4.4 billion to over 8 billion, indicating an 80.2 percent increase. As such, the width of the blue box on the horizontal axis has expanded to 1.802. The size of the blue box, therefore, has grown to 3.38 by 1.802, or 6.094 (see the middle box in Figure 2).

As the box on the right shows, personal resource abundance grew by 238 percent; the population grew by 80.2 percent. The yellow start box has a size of 1.0, while the blue end box has a size of 6.094. That represents a 509.4 percent increase in population-level resource abundance. Population-level resource abundance grew at a compound annual rate of 4.3 percent over this 43-year period. Also note that every 1-percentage-point increase in population corresponded to a 6.35-percentage-point increase in population-level resource abundance (509.4 ÷ 80.2 = 6.35).

Individual Commodity Changes: 1980–2023

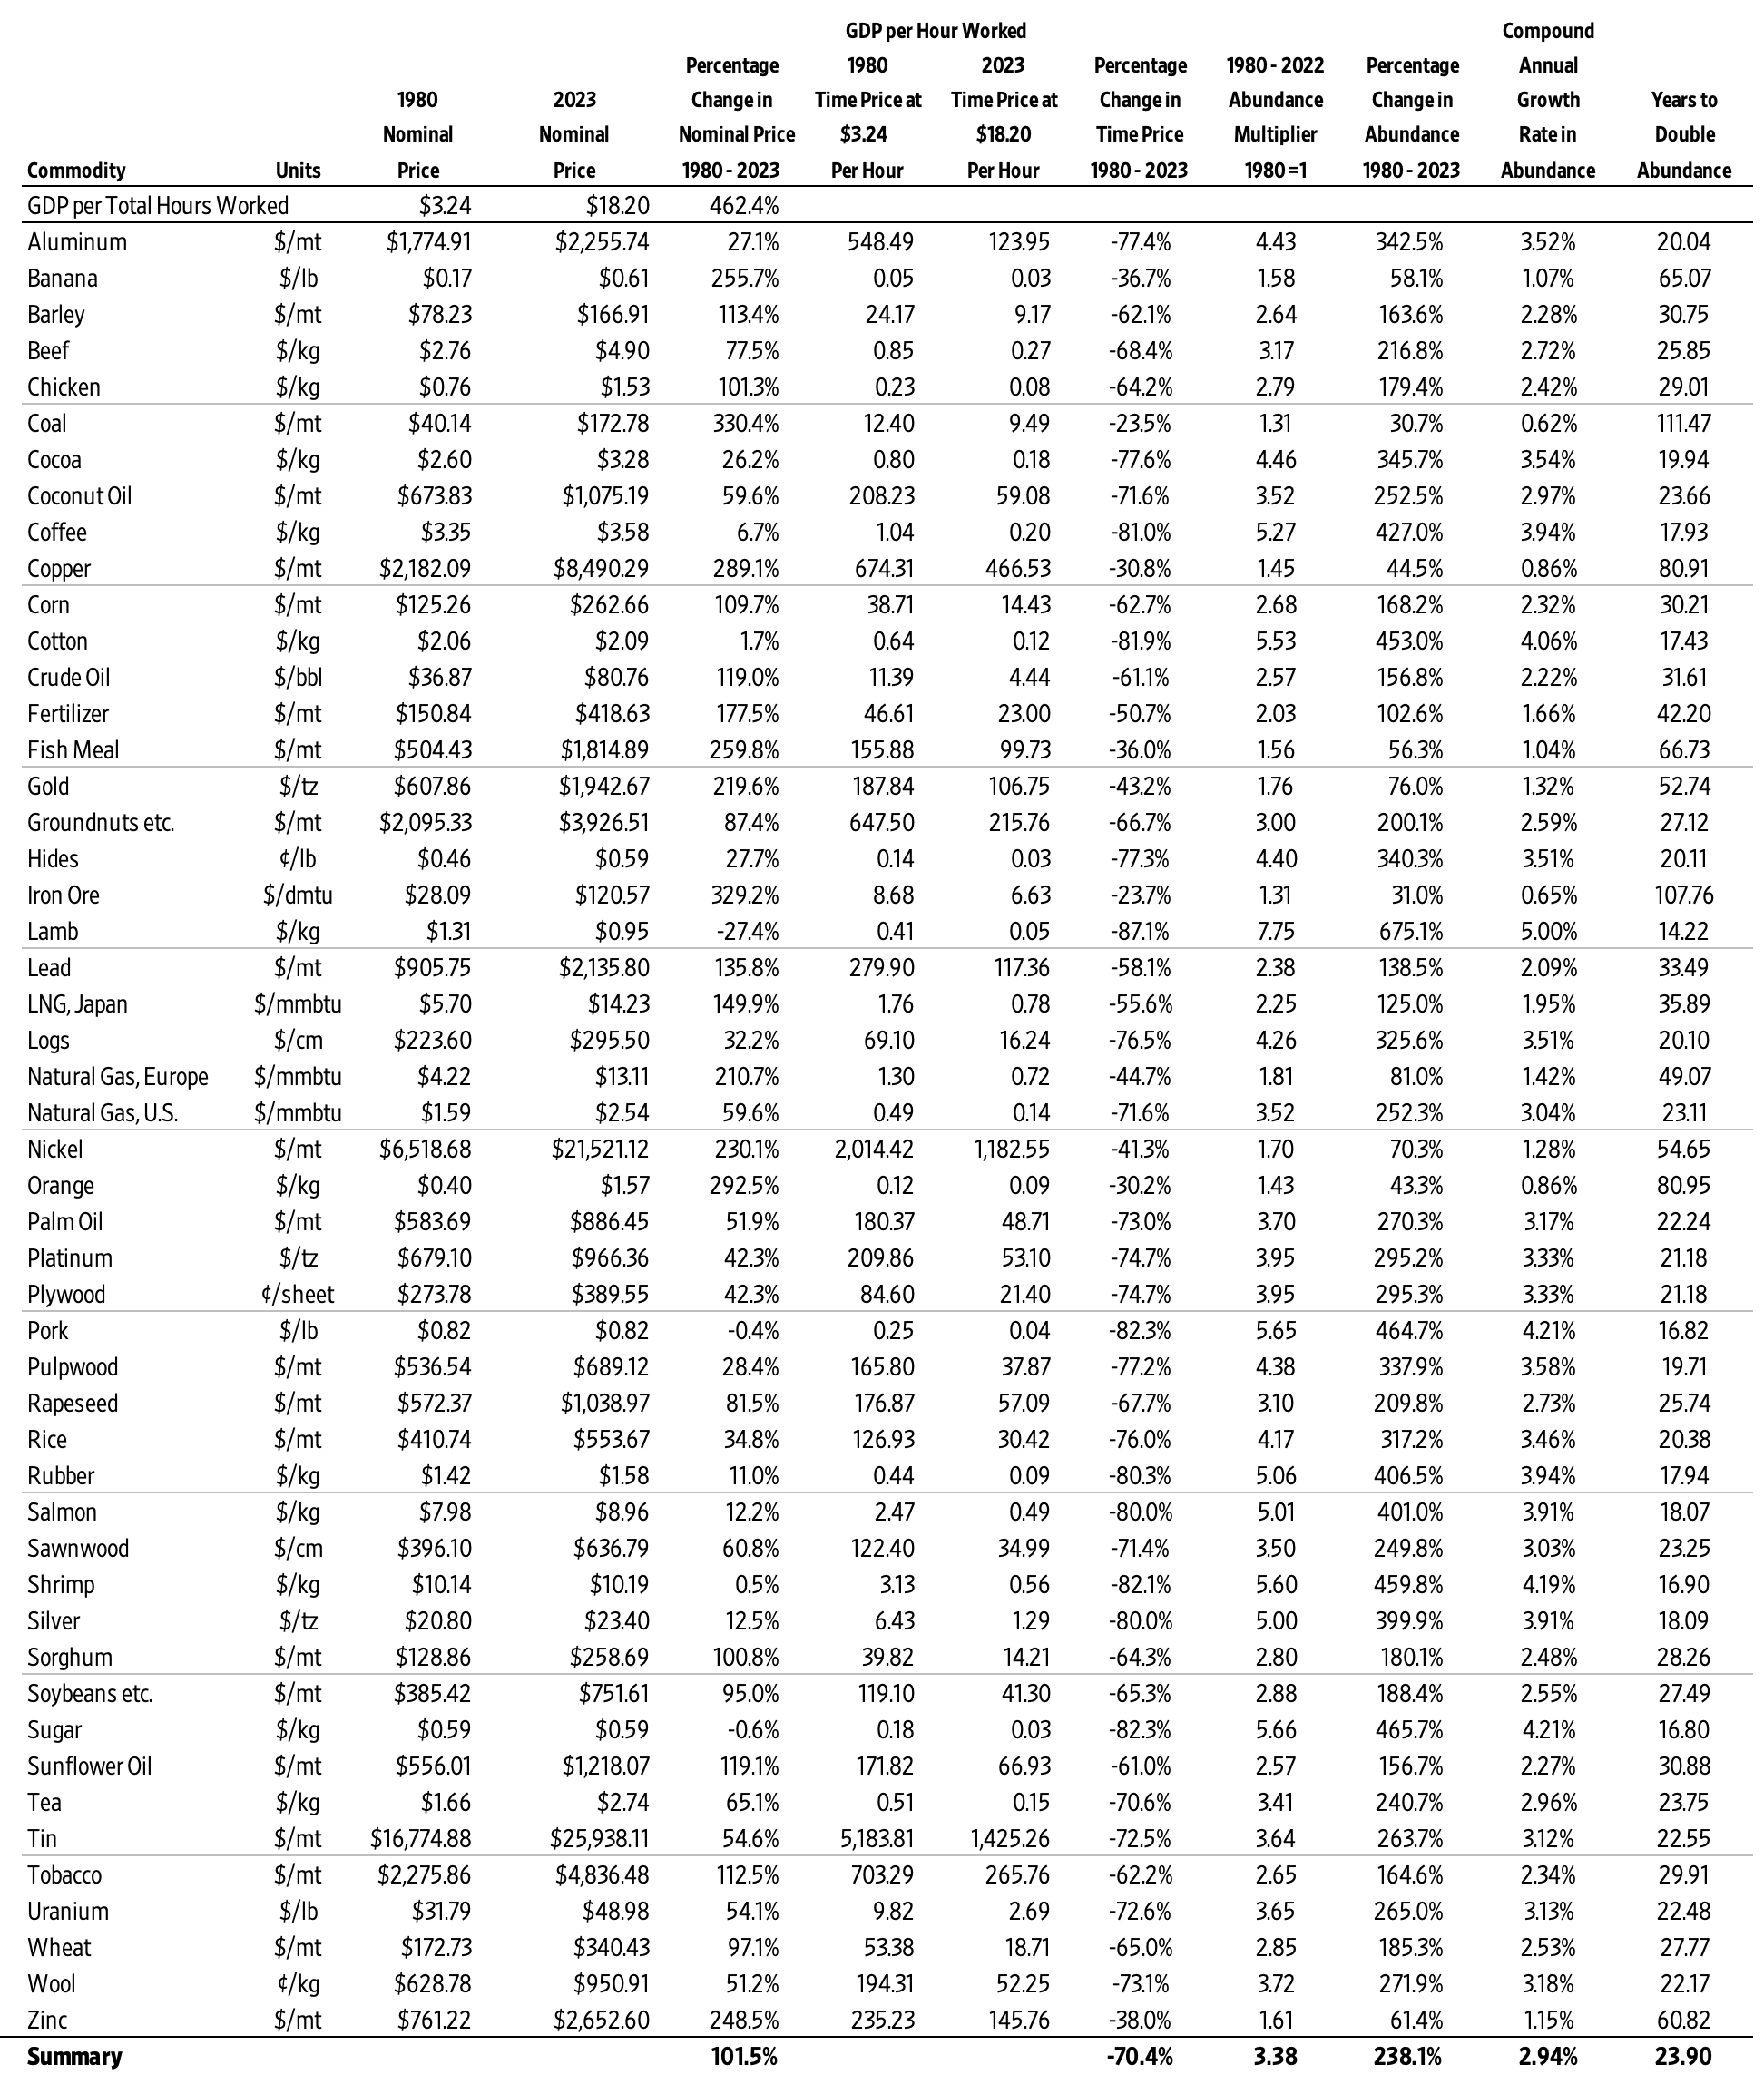
As noted, the average time price of the 50 basic commodities fell by 70.4 percent between 1980 and 2023. As such, the 50 commodities became 238.1 percent more abundant (on average). Lamb grew most abundant (675.1 percent), while the abundance of coal grew the least (30.7 percent).

Figure 3: Individual Commodities, Percentage Change in Time Price and Percentage Change in Abundance: 1980–2023

Individual Commodity Changes: 2022–2023

The SAI increased from a value of 520.1 in 2022 to 609.4 in 2023, indicating a 17.1 percent increase. Over those 12 months, 37 of the 50 commodities in the data set increased in abundance, while 13 decreased in abundance. Abundance ranged from a 220.8 percent increase for natural gas in Europe to a 38.9 percent decrease for oranges.

Figure 4: Individual Commodities, Percentage Change in Abundance: 2022–2023

Conclusion

After a sharp downturn between 2021 and 2022, which was caused by the COVID-19 pandemic, government lockdowns and accompanying monetary expansion, and the Russian invasion of Ukraine, the SAI is making a strong recovery. As noted, since 1980 resource abundance has been increasing at a much faster rate than population. We call that relationship superabundance. We explore this topic in our book Superabundance: The Story of Population Growth, Innovation, and Human Flourishing on an Infinitely Bountiful Planet.

Appendix A: Alternative Figure 1 with a Regression Line, Equation, R-Square, and Population

Appendix B: The Basic 50 Commodities Analysis: 1980–2023

Appendix C: Why Time Is Better Than Money for Measuring Resource Abundance

To better understand changes in our standard of living, we must move from thinking in quantities to thinking in prices. While the quantities of a resource are important, economists think in prices. This is because prices contain more information than quantities. Prices indicate if a product is becoming more or less abundant.

But prices can be distorted by inflation. Economists attempt to adjust for inflation by converting a current or nominal price into a real or constant price. This process can be subjective and contentious, however. To overcome such problems, we use time prices. What is most important to consider is how much time it takes to earn the money to buy a product. A time price is simply the nominal money price divided by the nominal hourly income. Money prices are expressed in dollars and cents, while time prices are expressed in hours and minutes. There are six reasons time is a better way than money to measure prices.

First, time prices contain more information than money prices do. Since innovation lowers prices and increases wages, time prices more fully capture the benefits of valuable new knowledge and the growth in human capital. To just look at prices without also looking at wages tells only half the story. Time prices make it easier to see the whole picture.

Second, time prices transcend the complications associated with converting nominal prices to real prices. Time prices avoid subjective and disputed adjustments such as the Consumer Price Index (CPI), the GDP Deflator or Implicit Price Deflator (IPD), the Personal Consumption Expenditures price index (PCE), and the Purchasing Power Parity (PPP). Time prices use the nominal price and the nominal hourly income at each point in time, so inflation adjustments are not necessary.

Third, time prices can be calculated on any product with any currency at any time and in any place. This means you can compare the time price of bread in France in 1850 to the time price of bread in New York in 2023. Analysts are also free to select from a variety of hourly income rates to use as the denominator when calculating time prices.

Fourth, time is an objective and universal constant. As the American economist George Gilder has noted, the International System of Units (SI) has established seven key metrics, of which six are bounded in one way or another by the passage of time. As the only irreversible element in the universe, with directionality imparted by thermodynamic entropy, time is the ultimate frame of reference for almost all measured values.

Fifth, time cannot be inflated or counterfeited. It is both fixed and continuous.

Sixth, we have perfect equality of time with exactly 24 hours in a day. As such, we should be comparing time inequality, not income inequality. When we measure differences in time inequality instead of income inequality, we get an even more positive view of the global standards of living.

These six reasons make using time prices superior to using money prices for measuring resource abundance. Time prices are elegant, intuitive, and simple. They are the true prices we pay for the things we buy.

The World Bank and the International Monetary Fund (IMF) track and report nominal prices on a wide variety of basic commodities. Analysts can use any hourly wage rate series as the denominator to calculate the time price. For the SAI, we created a proxy for global hourly income by using data from the World Bank and the Conference Board to calculate nominal GDP per hour worked.

With this data, we calculated the time prices for all 50 of the basic commodities for each year and then compared the change in time prices over time. If time prices are decreasing, personal resource abundance is increasing. For example, if a resource’s time price decreases by 50 percent, then for the same amount of time you get twice as much, or 100 percent more. The abundance of that resource has doubled. Or, to use the pizza analogy, an individual slice is twice as large. If the population increases by 25 percent over the same period, there will be 25 percent more slices. The pizza pie will thus be 150 percent larger [(2.0 x 1.25) – 1].

Castanet | Food Production

Company Gets Green Light for GMO Non-browning Apple

“An Okanagan-based company is thrilled that their latest trademarked non-browning apple has been green-lit for sale on Canadian shelves, after a history of public nerves surrounding genetically modified crops.

Okanagan Specialty Fruits is the developer and grower behind ‘Arctic apple’ varieties, sold pre-sliced or diced with the promise of staying fresh and avoiding browning for up to 28 days thanks to bioengineering tweaks to the apples’ genetic codes.”

From Castanet.