
Summary: The Simon–Ehrlich wager famously demonstrated that population growth does not lead to resource scarcity but instead drives innovation and abundance. Since 1900, the production of five metals featured in the bet has risen dramatically. This bolsters Julian Simon’s argument that human ingenuity and technological progress enable us to produce more resources at lower costs, ensuring greater abundance even as populations grow.
Hannah Richie at OurWorldinData.org recently published an insightful article on the five metals featured in the Simon–Ehrlich wager. In 1990, Paul Ehrlich lost the 10-year bet and had to write a check to Julian Simon for $576.07. Simon had let Ehrlich pick the five metals in 1980 when the bet started. The payment reflected the inflation-adjusted decline of 36 percent in the average price of the five metals over the decade. This was despite an extraordinary global population increase during the 1980s of 850 million people (19 percent)—the largest growth in human history. Yet, even with this surge, resource prices dropped, reinforcing Simon’s argument that human population growth, coupled with ingenuity and the freedom to innovate, drives resource abundance rather than scarcity.

Richie highlights an important trend: The long-term abundance of these metals has increased significantly. Take a look at the staggering growth in their production since the early 1900s:
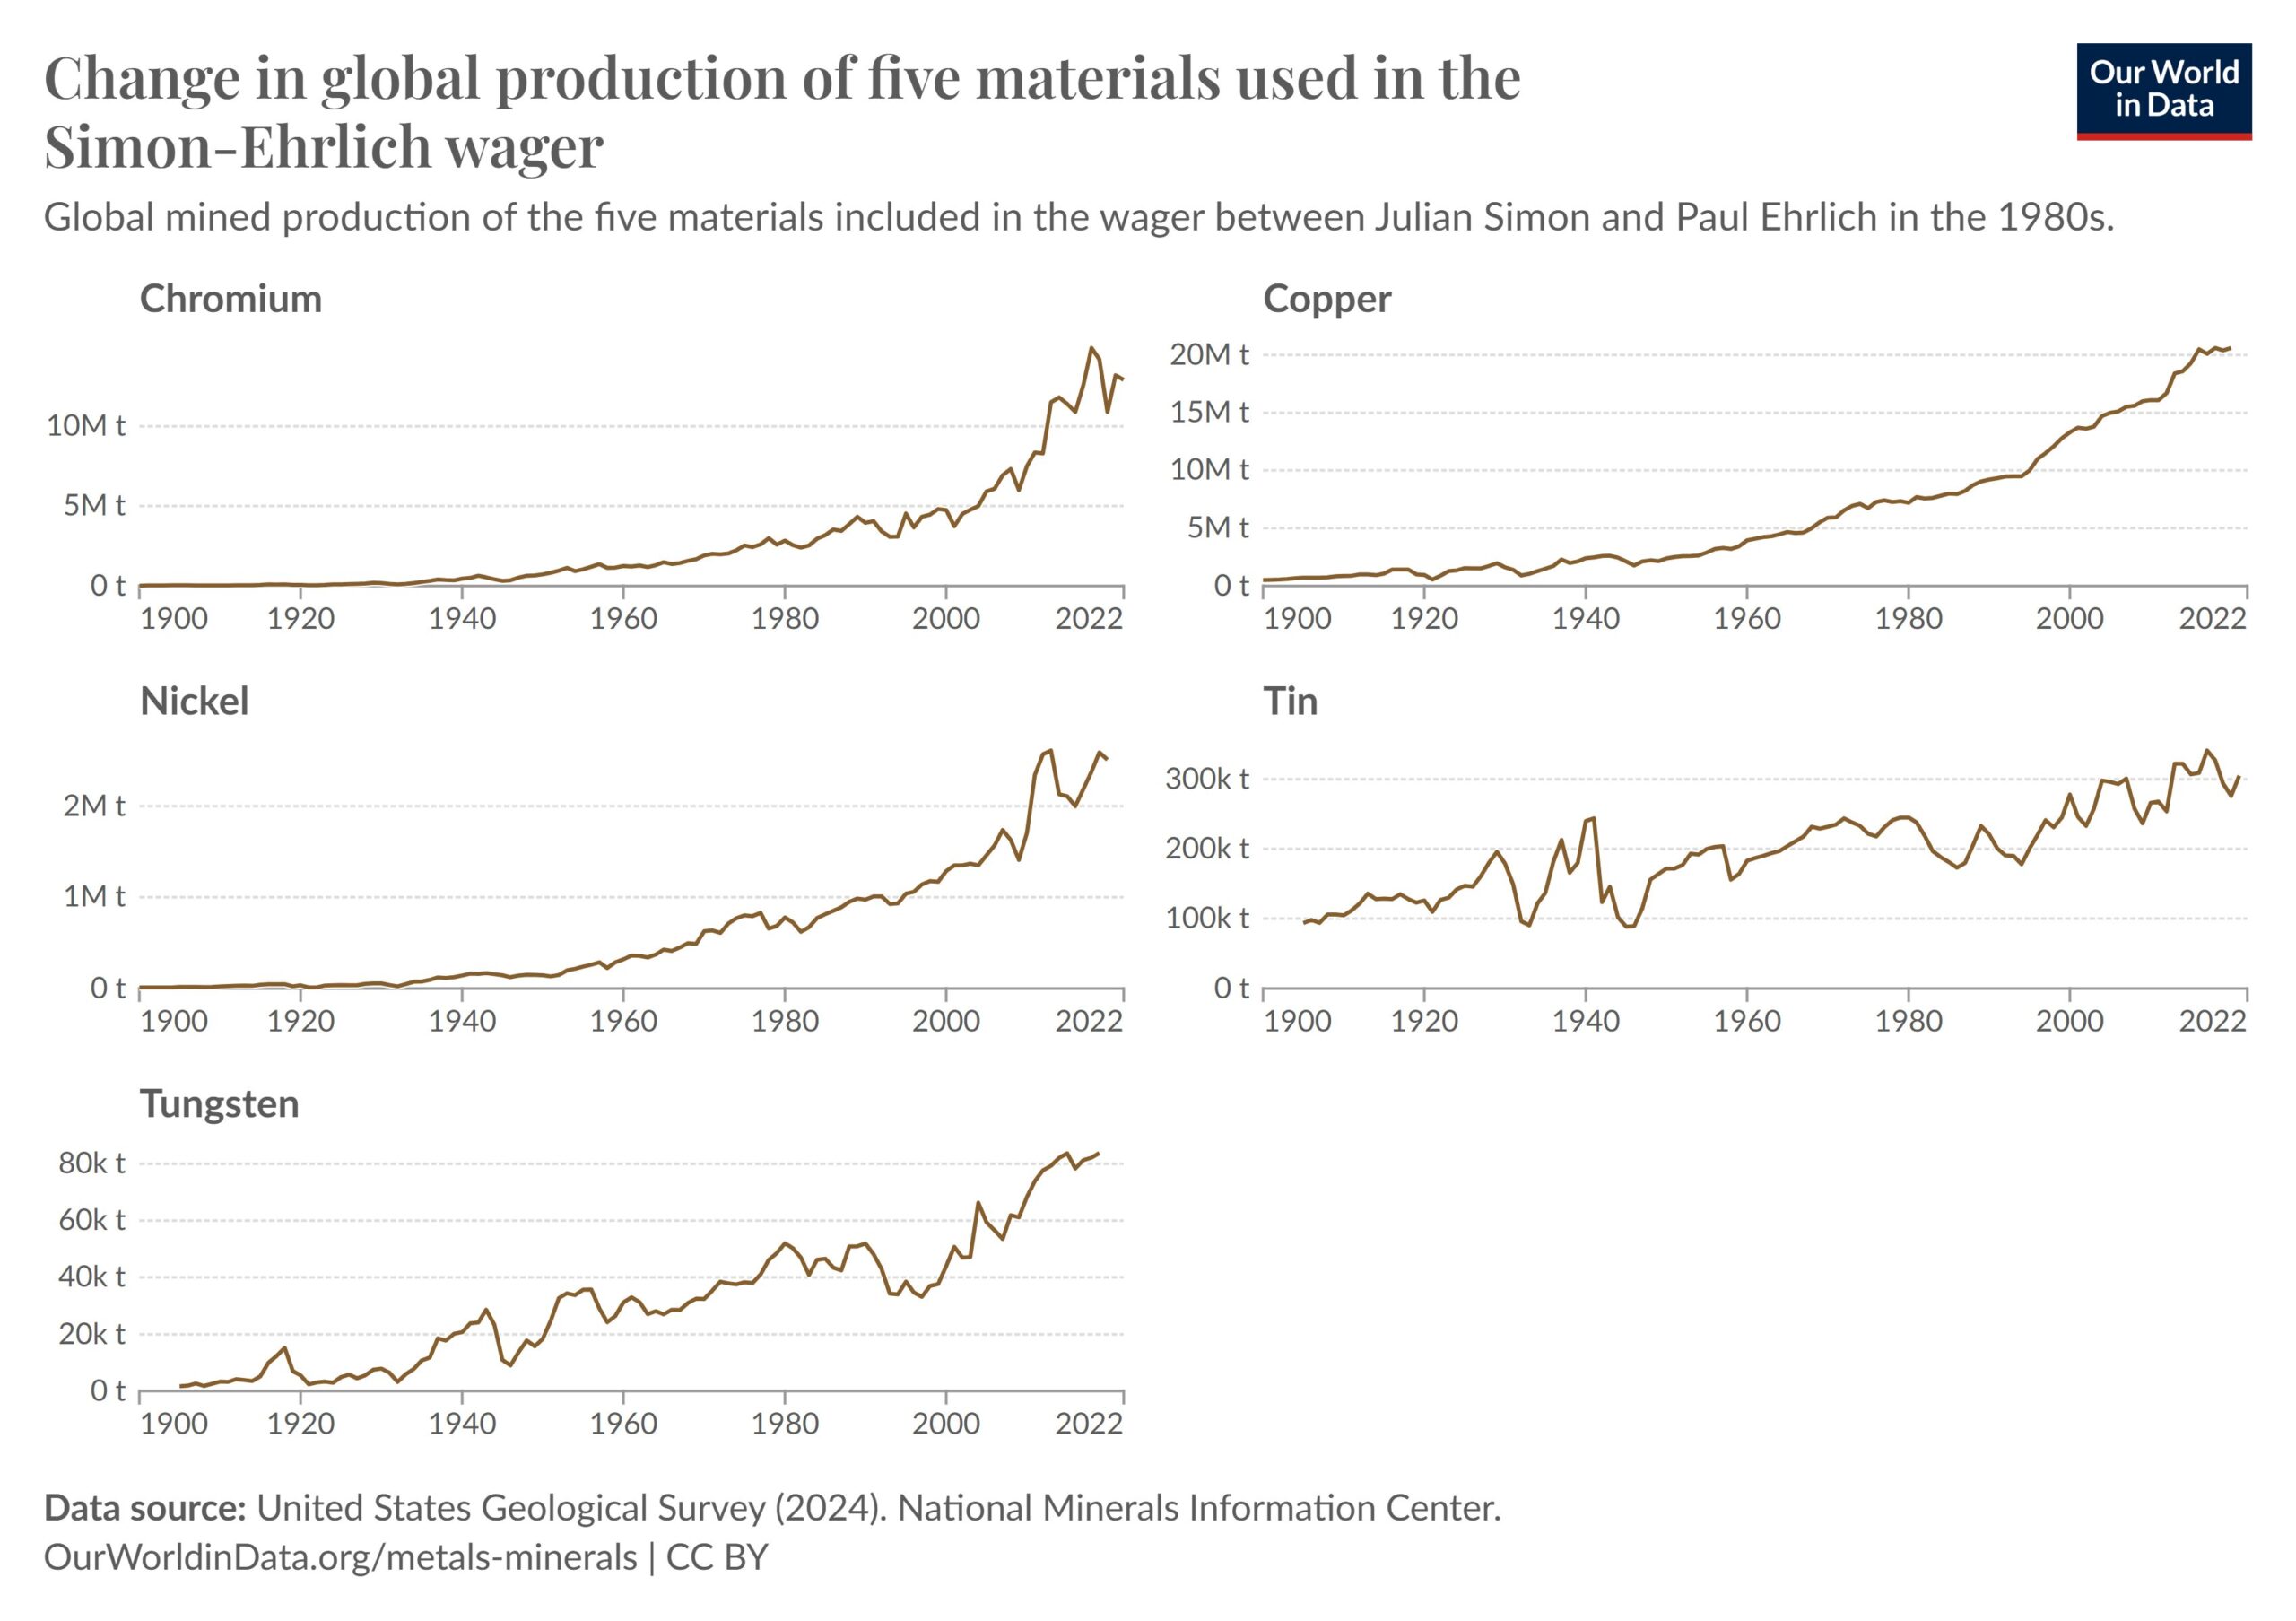
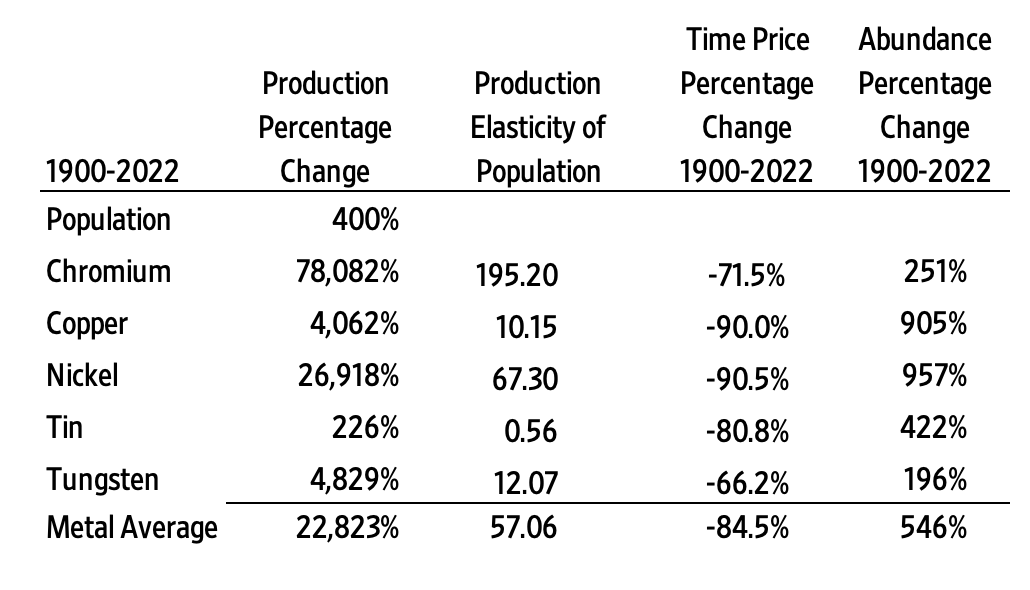
Between 1900 and 2000, the global population grew by 400 percent, from 1.6 billion to 8 billion. During the same period, the production of the five metals soared: Chromium increased by an astounding 78,082 percent, copper by 4,062 percent, nickel by 26,918 percent, tin by 226 percent, and tungsten by 4,829 percent. On average, production of these metals rose by 22,823 percent.
The relationship between population growth and resource production is captured by the production elasticity of the population. It is the ratio of the percentage change in production divided by the percentage change in population. On average, every 1 percent increase in population corresponded to a 57.06 percent increase in the production of these five metals.
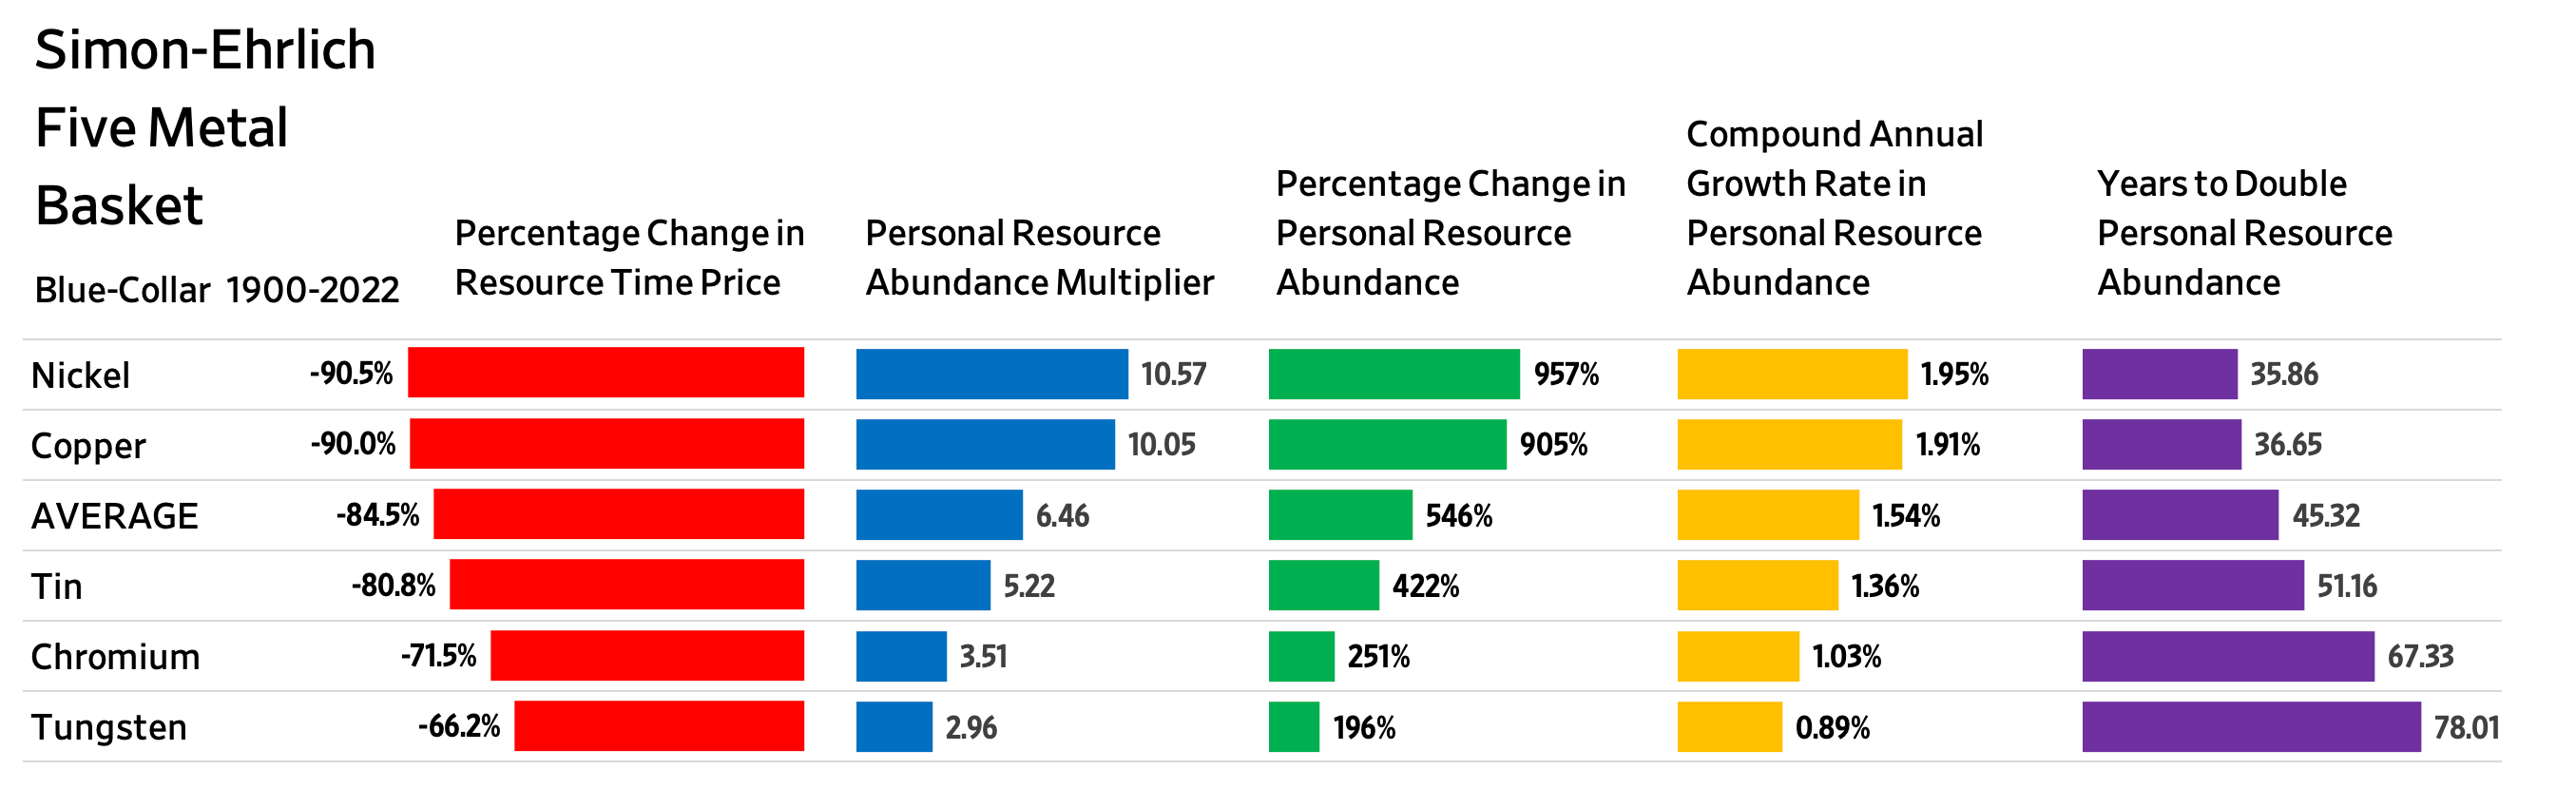
In our book Superabundance, we compared the time prices of these five metals for blue-collar workers from 1900 to 2018 and have since updated the data to 2022.
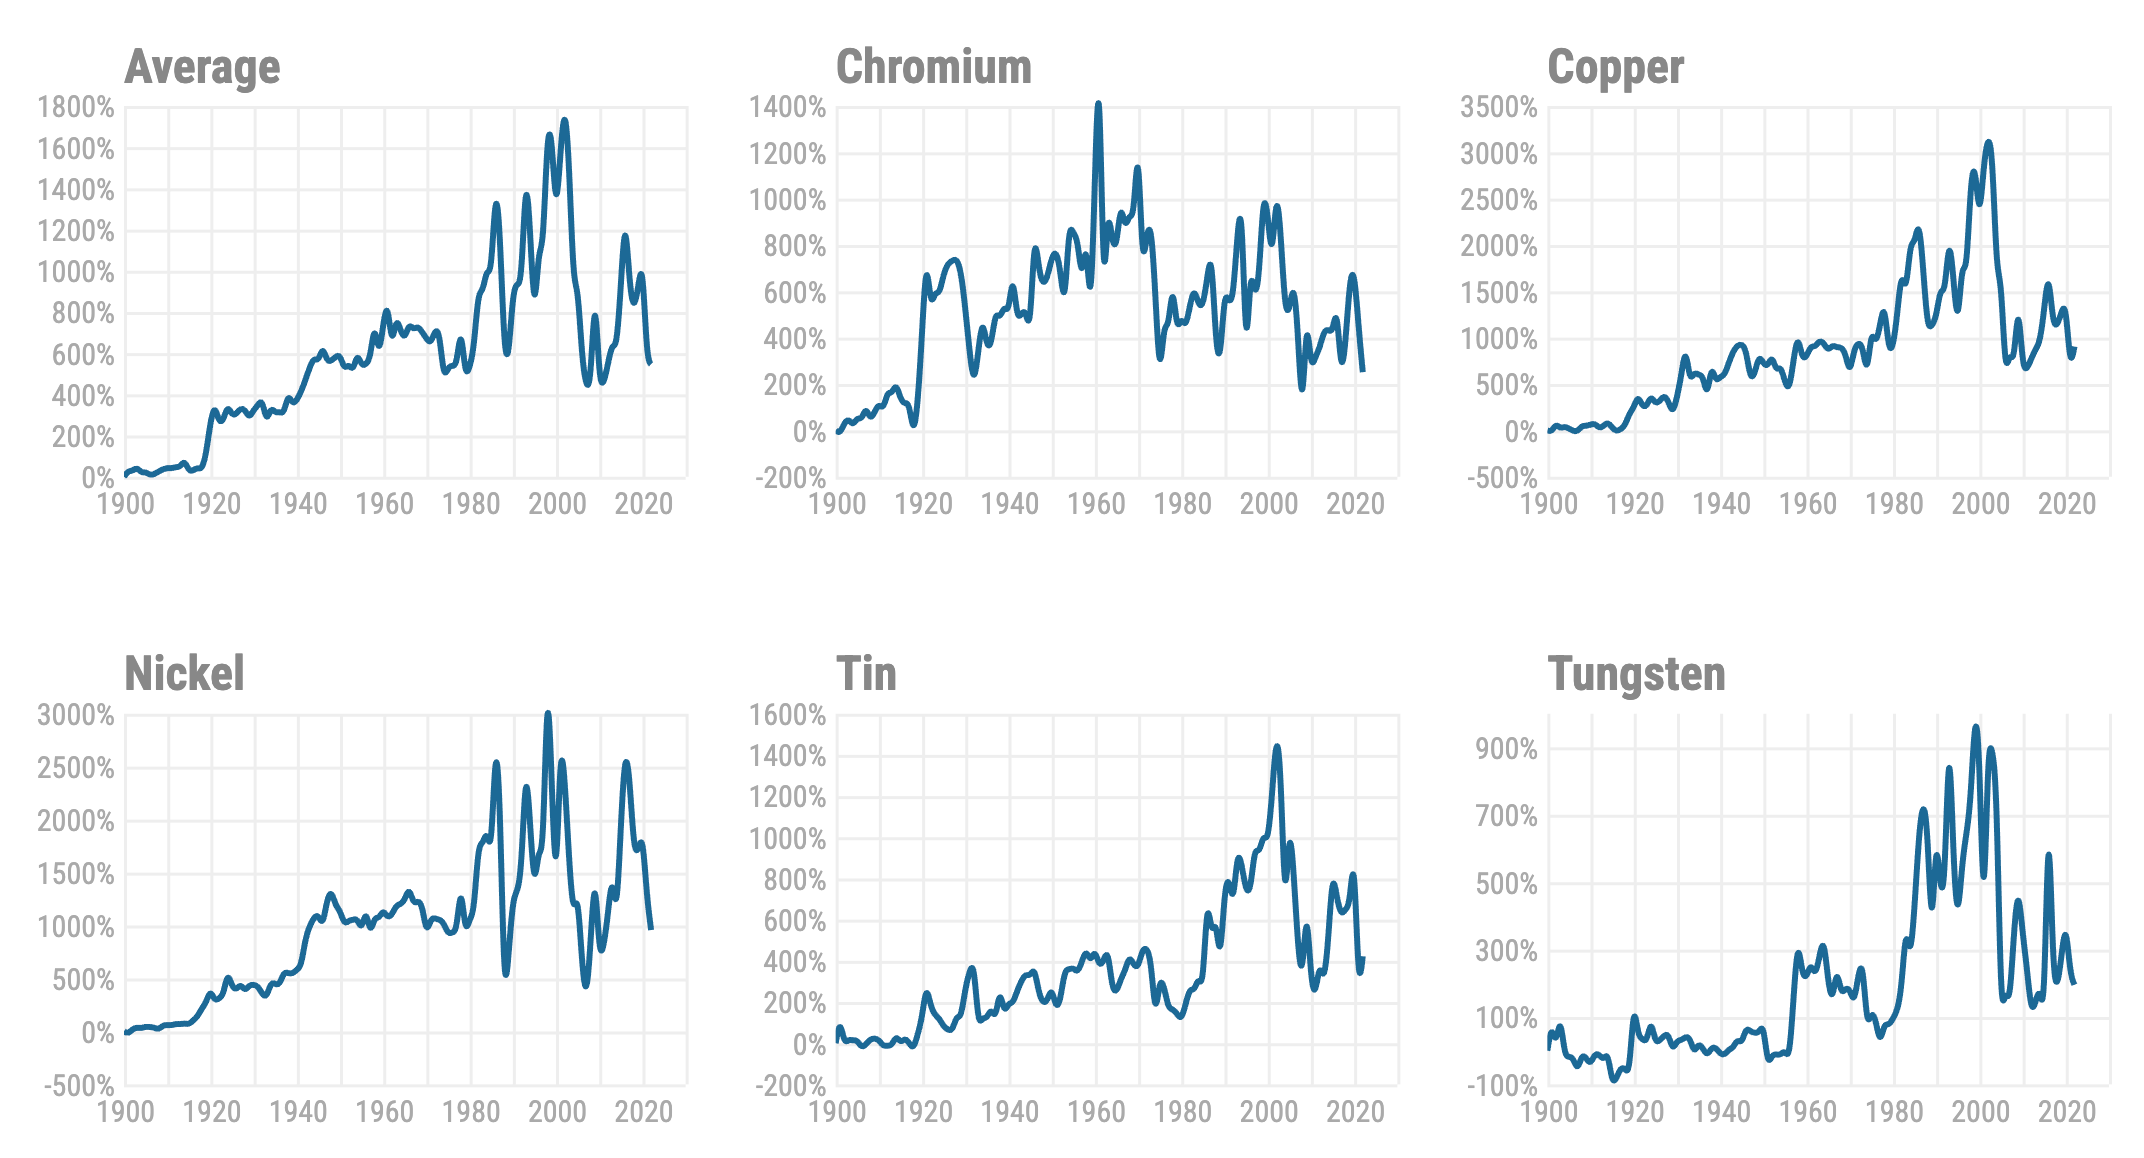
The charts below detail the growth in abundance for each resource since 1900. Please note that vertical scales differ across the charts. The charts generally show the effects of 9/11, the financial crisis of 2008, and COVID-19 lockdown policies.
This table summarizes our findings.
From 1900 to 2022, the global population increased by 400 percent. Over the same period, the abundance of these five metals increased by an average of 546 percent, demonstrating that abundance has grown 36.5 percent faster than the population.
Some have suggested that Simon was just lucky. This is why looking at a much longer time period reveals underlying trends behind temporary fluctuations.
These data reinforce Simon’s prediction: The more people, the more we produce, and the lower the prices.
Tip of the hat: Max More
This article was published at Gale Winds on 1/14/2025.