fbpx
01 / 05
There's Nothing Green About Socialism

Blog Post | Environment & Pollution

There's Nothing Green About Socialism

Historically speaking, environmental damage emanating from socialist production was vastly greater than environmental damage emanating from capitalist production.

Earlier this month, I wrote about the determined efforts of socialists on both sides of the Atlantic to conflate capitalism with racism. No doubt, some promoters of capitalism were racists. But that is hardly surprising, since racism, along with slavery and wanton cruelty, were universal and, until recently, eternal phenomena.

The truth is, no culture in documented history comes close to the high standards of civilised behaviour that we expect from one another in the contemporary, which is to say democratic and capitalist, West. What I objected to in my column was the implicit notion that socialism was, somehow, less racist. And, as I showed by looking at the history of socialism, the opposite comes closer to the truth.

Yet Jean-Jacques Rousseau’s noble savage – a mythological creature living in harmony with nature and fellow beings – maintains a stronghold on socialist imagination. Consider the recent articles in The New York Times titled, The Climate Crisis? It’s Capitalism, Stupid, and Lenin’s Eco-Warriors. In the first, Benjamin Y Fong recommends democratic socialism as a solution to global environmental problems, while in the second, Fred Strebeigh praises Lenin as “a longtime enthusiast for hiking and camping” who turned Russia into “a global pioneer in conservation”.

Before delving deeper into The Times’ peculiar take on the environmental legacy of socialism, a little bit of background is in order.

This year marks 100 years since the Bolshevik putsch in Russia – an event that unleashed upon the world the most destructive ideology ever conceived by the human mind. The Times, which is the main source of news for progressive intelligentsia in the United States, has chosen to commemorate the cataclysmic events of 1917 in a series of sympathetic (and much-ridiculed) articles with titles such as, When Communism Inspired AmericansThanks to Mom, the Marxist RevolutionaryMake It So: Star Trek and Its Debt to Revolutionary Socialism, and Why Women Had Better Sex Under Socialism.

Recall that The Times was complicit in whitewashing the crimes perpetrated by communist regimes for close to century, beginning with the discredited reportage of Walter Duranty – an Anglo-American correspondent who famously described concerns over man-made famine in Ukraine as “malignant propaganda”. Duranty’s crime against journalistic standards of truth-telling (from 1932 to 1934, the Holodomor claimed between 2.4 and 7.5 million lives), earned him a Pulitzer Prize – a high honour that The Times has repeatedly refused to relinquish.

But, let’s return to the newspaper’s recipes for saving the planet. According to the writers in The Times, capitalism is destroying the planet, while socialism (both in its original Leninist form and in its “democratic” form that is currently advocated by the US Senator Bernie Sanders) could save it. As Fong writes:

“The real culprit of the climate crisis is not any particular form of consumption, production or regulation but rather the very way in which we globally produce, which is for profit rather than for sustainability. So long as this order is in place, the crisis will continue and, given its progressive nature, worsen. This is a hard fact to confront. But averting our eyes from a seemingly intractable problem does not make it any less a problem. It should be stated plainly: It’s capitalism that is at fault…

“We have a much better chance of making it past the 22nd century if environmental regulations are designed by a team of people with no formal education in a democratic socialist society than we do if they are made by a team of the most esteemed scientific luminaries in a capitalist society. The intelligence of the brightest people around is no match for the rampant stupidity of capitalism….

“On the defensive for centuries, socialists have become quite adept at responding to objections from people for whom the basic functions of life seem difficult to reproduce without the motive power of capital. There are real issues here, issues that point to the opacity of sociability, as Bini Adamczak’s recent book, ‘Communism for Kids’, playfully explores. But the burden of justification should not fall on the shoulders of those putting forward an alternative. For anyone who has really thought about the climate crisis, it is capitalism, and not its transcendence, that is in need of justification.”

Bini Adamczak’s “playful” Communism for Kids aside, I think it is possible to answer most of Fong’s concerns by looking at the actual environmental records of socialist and capitalist economies.

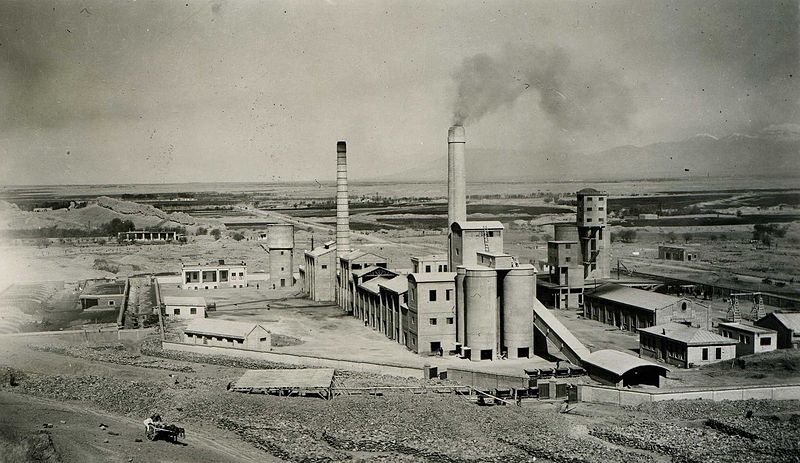
To start with, all forms of production result in some environmental damage. Agricultural production clears forests, displaces wildlife and destroys the biosphere. Industrial production spews harmful gases into the atmosphere and releases pollutants into rivers. Even the service sector pollutes, given its reliance on electricity and the concomitant CO2 emissions. So the real question is not which economic system is the perfect steward of the environment, but which economic system is the better steward.

When answering that question, the following concepts should be kept in mind: economic efficiency, tragedy of the commons and the environmental Kuznets curve.

Socialist economies were very inefficient. (That’s still the case in the surviving ones in Cuba, Venezuela and North Korea.) To compensate for the inefficiency of central planning, which emanated from the lack of a market-based price mechanism, socialist economies generally ignored environmental damage and other negative externalities. To maximise production (in order to try to keep pace with the much more efficient capitalist economies), socialist countries had low, or non-existent, emission standards. Health and safety regulations were either ignored or lacking altogether. Socialist economies also banned independent trade unions and, often, resorted to slave labour.

The socialists’ disregard for the environment was further exacerbated by their contempt for property rights. In capitalist economies, farms and factories are owned by individual people or corporations. If they cause damage to the environment or the workforce, they can be held accountable in the court of law. In socialist economies, land and air (and, in the most extreme cases, people) were owned by the state and suffered from the “tragedy of the commons”.

A state-owned factory tasked by the central planners with producing a certain quantity of iron bars, for example, was not only allowed, but actively urged, to meet its production quota irrespective of the damage caused to the environment and to the populace. In capitalist economies, the state is entrusted with enforcing environmental standards and protection of workers. In socialist economies, the state is both the enforcer of production quotas, and the supposed protector of the environment and the workers. When it came to choosing between the two, the socialists almost invariably chose the former: they cut corners in order to compensate for the inefficiency of central planning.

That problem is clearly illustrated by the comparison of the amount of CO2 emissions per dollar of output in socialist and capitalist countries. Note that, over time, emissions declined in the United States from already low levels. A similar trend can be observed in Russia after the collapse of the Soviet Union in 1991 (regrettably, I do not have data for the USSR prior to 1991).

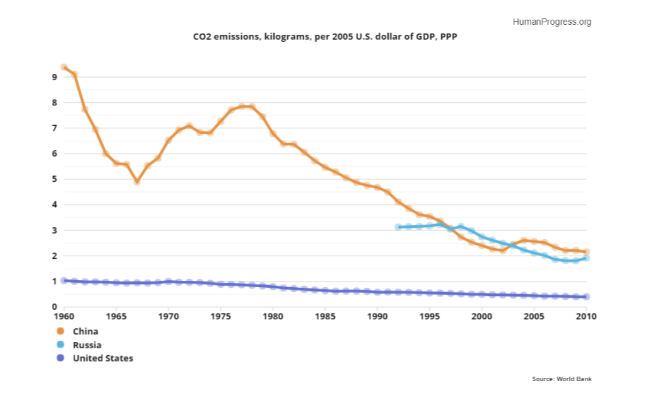
Perhaps the best example of socialist disregard for the environment can be seen in data for China. Emissions during Mao Zedong’s Great leap Forward (1958-1962) were, compared to the United States, stratospheric. They declined afterwards, but remained very high until the late 1970s, when China abandoned socialism. Since China started liberalising its economy (by introducing the price mechanism and property rights), its emissions drastically declined.

Last but not least, socialist countries were, in large part as a result of central planning, much poorer than their capitalist counterparts. That is important, because of a phenomenon known as the environmental Kuznets curve. As a general rule, the richer the people are, the more likely they are to pay for “luxury goods”, such as clean air and rivers, as well as high health and safety standards in the workplace. It may sound strange to the modern ear, but clean environment and happy labour force are, in a very real sense, “luxuries” that were unavailable to our much poorer ancestors.

Really poor people, such as those in large parts of Africa and Asia, are primarily concerned with their survival. All other considerations are secondary. Don’t believe me? Following the collapse of the Zimbabwean economy, people started slaughtering the previously protected wildlife in order to feed their families. Following the collapse of the Venezuelan economy, animals from the zoo in the nation’s capital found themselves on the menu. During the Holodomor in Ukraine, people ate one another. My point here is not to denigrate environmental concerns, but to point to the real trade-offs that poor people in dysfunctional socialist economies have to face on daily basis.

Socialism, then, is not the answer. Historically speaking, environmental damage emanating from socialist production was vastly greater than environmental damage emanating from capitalist production. All and I repeat all academic studies done in the aftermath of the collapse of the Soviet empire found the quality of the environment in the formerly socialist countries to be inferior to those in capitalist countries.

The best way to protect the environment is to get rich. That way, there is enough money not only to meet the needs of ordinary people, but also to pay for cleaner power plants and better water-treatment facilities. Since capitalism is the best way to create wealth, humanity should stick with it.

This first appeared in CapX.

Blog Post | Energy & Natural Resources

The Simon Abundance Index 2024

The Earth was 509.4 percent more abundant in 2023 than it was in 1980.

The Simon Abundance Index (SAI) quantifies and measures the relationship between resources and population. The SAI converts the relative abundance of 50 basic commodities and the global population into a single value. The index started in 1980 with a base value of 100. In 2023, the SAI stood at 609.4, indicating that resources have become 509.4 percent more abundant over the past 43 years. All 50 commodities were more abundant in 2023 than in 1980.

Figure 1: The Simon Abundance Index: 1980–2023 (1980 = 100)

The SAI is based on the ideas of University of Maryland economist and Cato Institute senior fellow Julian Simon, who pioneered research on and analysis of the relationship between population growth and resource abundance. If resources are finite, Simon’s opponents argued, then an increase in population should lead to higher prices and scarcity. Yet Simon discovered through exhaustive research over many years that the opposite was true. As the global population increased, virtually all resources became more abundant. How is that possible?

Simon recognized that raw materials without the knowledge of how to use them have no economic value. It is knowledge that transforms raw materials into resources, and new knowledge is potentially limitless. Simon also understood that it is only human beings who discover and create knowledge. Therefore, resources can grow infinitely and indefinitely. In fact, human beings are the ultimate resource.

Visualizing the Change

Resource abundance can be measured at both the personal level and the population level. We can use a pizza analogy to understand how that works. Personal-level abundance measures the size of an individual pizza slice. Population-level abundance measures the size of the entire pizza pie. The pizza pie can get larger in two ways: the slices can get larger, or the number of slices can increase. Both can happen at the same time.

Growth in resource abundance can be illustrated by comparing two box charts. Create the first chart, representing the population on the horizontal axis and personal resource abundance on the vertical axis. Draw a yellow square to represent the start year of 1980. Index both population and personal resource abundance to a value of one. Then draw a second chart for the end year of 2023. Use blue to distinguish this second chart. Scale it horizontally for the growth in population and vertically for the growth in personal resource abundance from 1980. Finally, overlay the yellow start-year chart on the blue end-year chart to see the difference in resource abundance between 1980 and 2023.

Figure 2: Visualization of the Relationship between Global Population Growth and Personal Resource Abundance of the 50 Basic Commodities (1980–2023)

Between 1980 and 2023, the average time price of the 50 basic commodities fell by 70.4 percent. For the time required to earn the money to buy one unit of this commodity basket in 1980, you would get 3.38 units in 2023. Consequently, the height of the vertical personal resource abundance axis in the blue box has risen to 3.38. Moreover, during this 43-year period, the world’s population grew by 3.6 billion, from 4.4 billion to over 8 billion, indicating an 80.2 percent increase. As such, the width of the blue box on the horizontal axis has expanded to 1.802. The size of the blue box, therefore, has grown to 3.38 by 1.802, or 6.094 (see the middle box in Figure 2).

As the box on the right shows, personal resource abundance grew by 238 percent; the population grew by 80.2 percent. The yellow start box has a size of 1.0, while the blue end box has a size of 6.094. That represents a 509.4 percent increase in population-level resource abundance. Population-level resource abundance grew at a compound annual rate of 4.3 percent over this 43-year period. Also note that every 1-percentage-point increase in population corresponded to a 6.35-percentage-point increase in population-level resource abundance (509.4 ÷ 80.2 = 6.35).

Individual Commodity Changes: 1980–2023

As noted, the average time price of the 50 basic commodities fell by 70.4 percent between 1980 and 2023. As such, the 50 commodities became 238.1 percent more abundant (on average). Lamb grew most abundant (675.1 percent), while the abundance of coal grew the least (30.7 percent).

Figure 3: Individual Commodities, Percentage Change in Time Price and Percentage Change in Abundance: 1980–2023

Individual Commodity Changes: 2022–2023

The SAI increased from a value of 520.1 in 2022 to 609.4 in 2023, indicating a 17.1 percent increase. Over those 12 months, 37 of the 50 commodities in the data set increased in abundance, while 13 decreased in abundance. Abundance ranged from a 220.8 percent increase for natural gas in Europe to a 38.9 percent decrease for oranges.

Figure 4: Individual Commodities, Percentage Change in Abundance: 2022–2023

Conclusion

After a sharp downturn between 2021 and 2022, which was caused by the COVID-19 pandemic, government lockdowns and accompanying monetary expansion, and the Russian invasion of Ukraine, the SAI is making a strong recovery. As noted, since 1980 resource abundance has been increasing at a much faster rate than population. We call that relationship superabundance. We explore this topic in our book Superabundance: The Story of Population Growth, Innovation, and Human Flourishing on an Infinitely Bountiful Planet.

Appendix A: Alternative Figure 1 with a Regression Line, Equation, R-Square, and Population

Appendix B: The Basic 50 Commodities Analysis: 1980–2023

Appendix C: Why Time Is Better Than Money for Measuring Resource Abundance

To better understand changes in our standard of living, we must move from thinking in quantities to thinking in prices. While the quantities of a resource are important, economists think in prices. This is because prices contain more information than quantities. Prices indicate if a product is becoming more or less abundant.

But prices can be distorted by inflation. Economists attempt to adjust for inflation by converting a current or nominal price into a real or constant price. This process can be subjective and contentious, however. To overcome such problems, we use time prices. What is most important to consider is how much time it takes to earn the money to buy a product. A time price is simply the nominal money price divided by the nominal hourly income. Money prices are expressed in dollars and cents, while time prices are expressed in hours and minutes. There are six reasons time is a better way than money to measure prices.

First, time prices contain more information than money prices do. Since innovation lowers prices and increases wages, time prices more fully capture the benefits of valuable new knowledge and the growth in human capital. To just look at prices without also looking at wages tells only half the story. Time prices make it easier to see the whole picture.

Second, time prices transcend the complications associated with converting nominal prices to real prices. Time prices avoid subjective and disputed adjustments such as the Consumer Price Index (CPI), the GDP Deflator or Implicit Price Deflator (IPD), the Personal Consumption Expenditures price index (PCE), and the Purchasing Power Parity (PPP). Time prices use the nominal price and the nominal hourly income at each point in time, so inflation adjustments are not necessary.

Third, time prices can be calculated on any product with any currency at any time and in any place. This means you can compare the time price of bread in France in 1850 to the time price of bread in New York in 2023. Analysts are also free to select from a variety of hourly income rates to use as the denominator when calculating time prices.

Fourth, time is an objective and universal constant. As the American economist George Gilder has noted, the International System of Units (SI) has established seven key metrics, of which six are bounded in one way or another by the passage of time. As the only irreversible element in the universe, with directionality imparted by thermodynamic entropy, time is the ultimate frame of reference for almost all measured values.

Fifth, time cannot be inflated or counterfeited. It is both fixed and continuous.

Sixth, we have perfect equality of time with exactly 24 hours in a day. As such, we should be comparing time inequality, not income inequality. When we measure differences in time inequality instead of income inequality, we get an even more positive view of the global standards of living.

These six reasons make using time prices superior to using money prices for measuring resource abundance. Time prices are elegant, intuitive, and simple. They are the true prices we pay for the things we buy.

The World Bank and the International Monetary Fund (IMF) track and report nominal prices on a wide variety of basic commodities. Analysts can use any hourly wage rate series as the denominator to calculate the time price. For the SAI, we created a proxy for global hourly income by using data from the World Bank and the Conference Board to calculate nominal GDP per hour worked.

With this data, we calculated the time prices for all 50 of the basic commodities for each year and then compared the change in time prices over time. If time prices are decreasing, personal resource abundance is increasing. For example, if a resource’s time price decreases by 50 percent, then for the same amount of time you get twice as much, or 100 percent more. The abundance of that resource has doubled. Or, to use the pizza analogy, an individual slice is twice as large. If the population increases by 25 percent over the same period, there will be 25 percent more slices. The pizza pie will thus be 150 percent larger [(2.0 x 1.25) – 1].

Board of Governors of the Federal Reserve System | Economic Growth

Income Growth Over Five Generations of Americans

“We find that each of the past four generations of Americans was better off than the previous one, using a post-tax, post-transfer income measure constructed annually from 1963-2022 based on the Current Population Survey Annual Social and Economic Supplement.”

From Board of Governors of the Federal Reserve System.

Blog Post | Human Development

1,000 Bits of Good News You May Have Missed in 2023

A necessary balance to the torrent of negativity.

Reading the news can leave you depressed and misinformed. It’s partisan, shallow, and, above all, hopelessly negative. As Steven Pinker from Harvard University quipped, “The news is a nonrandom sample of the worst events happening on the planet on a given day.”

So, why does Human Progress feature so many news items? And why did I compile them in this giant list? Here are a few reasons:

  • Negative headlines get more clicks. Promoting positive stories provides a necessary balance to the torrent of negativity.
  • Statistics are vital to a proper understanding of the world, but many find anecdotes more compelling.
  • Many people acknowledge humanity’s progress compared to the past but remain unreasonably pessimistic about the present—not to mention the future. Positive news can help improve their state of mind.
  • We have agency to make the world better. It is appropriate to recognize and be grateful for those who do.

Below is a nonrandom sample (n = ~1000) of positive news we collected this year, separated by topic area. Please scroll, skim, and click. Or—to be even more enlightened—read this blog post and then look through our collection of long-term trends and datasets.

Agriculture

Aquaculture

Farming robots and drones

Food abundance

Genetic modification

Indoor farming

Lab-grown produce

Pollination

Other innovations

Conservation and Biodiversity

Big cats

Birds

Turtles

Whales

Other comebacks

Forests

Reefs

Rivers and lakes

Surveillance and discovery

Rewilding and conservation

De-extinction

Culture and tolerance

Gender equality

General wellbeing

LGBT

Treatment of animals

Energy and natural Resources

Fission

Fusion

Fossil fuels

Other energy

Recycling and resource efficiency

Resource abundance

Environment and pollution

Climate change

Disaster resilience

Air pollution

Water pollution

Growth and development

Education

Economic growth

Housing and urbanization

Labor and employment

Health

Cancer

Disability and assistive technology

Dementia and Alzheimer’s

Diabetes

Heart disease and stroke

Other non-communicable diseases

HIV/AIDS

Malaria

Other communicable diseases

Maternal care

Fertility and birth control

Mental health and addiction

Weight and nutrition

Longevity and mortality 

Surgery and emergency medicine

Measurement and imaging

Health systems

Other innovations

Freedom

    Technology 

    Artificial intelligence

    Communications

    Computing

    Construction and manufacturing

    Drones

    Robotics and automation

    Autonomous vehicles

    Transportation

    Other innovations

    Science

    AI in science

    Biology

    Chemistry and materials

      Physics

      Space

      Violence

      Crime

      War