fbpx
01 / 05
The Simon Abundance Index 2023

Blog Post | Energy & Natural Resources

The Simon Abundance Index 2023

The Earth was 420.1 percent more abundant in 2022 than it was in 1980.

Does population growth lead to greater resource scarcity, as argued by the English scholar Thomas Malthus and, more recently, by the Stanford University biologist Paul Ehrlich? Or does population growth coincide with—and even contribute to—greater resource abundance, as the University of Maryland economist and Cato Institute senior fellow Julian Simon has argued? The Simon Abundance Index (SAI) measures the relationship between population growth and the abundance of 50 basic commodities, including food, energy, materials, minerals, and metals.

Main Findings

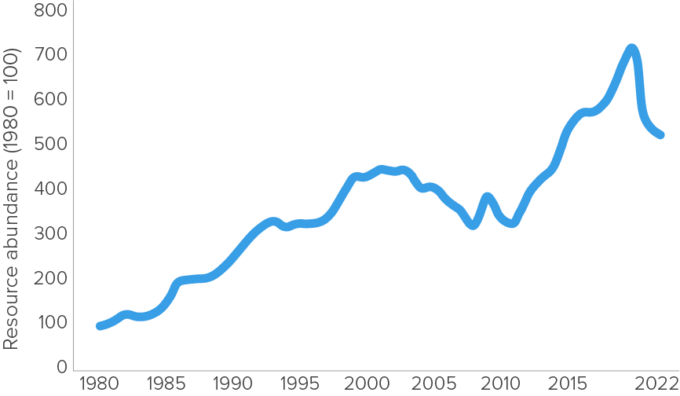
Global resource abundance fell by 3.55 percent in 2022, according to the sixth annual Simon Abundance Index. The base year of the index is 1980, and the base value of the index is 100. In 2022, the index stood at 520.1. In other words, the index rose by 420.1 percent over the last 42 years, implying a compound annual growth rate in global resource abundance of 4 percent and a doubling of global resource abundance every 17.65 years.

Figure 1: The Simon Abundance Index (1980–2022)

The graph shows resource abundance increasing since 1980.

Analysis

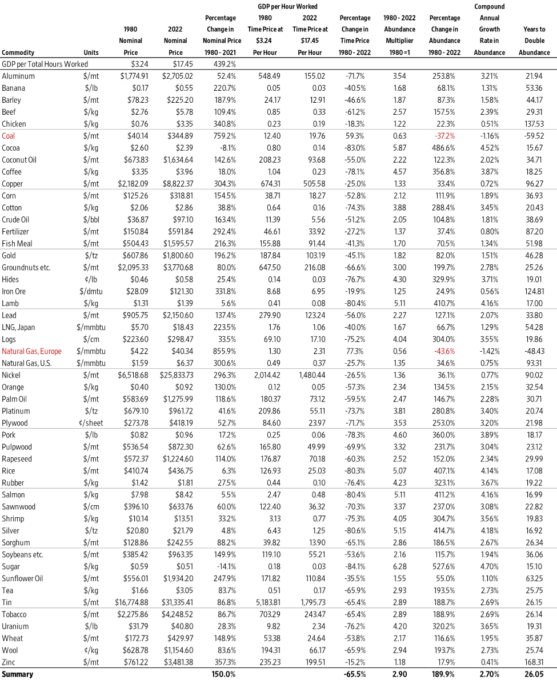
The SAI is measured in time prices. To calculate a commodity’s time price, the nominal price of a commodity is divided by the average global nominal income per hour worked. Over the last 42 years, the average of the nominal prices of the Basic 50 commodities rose by 150 percent, while the average global nominal income per hour worked rose by 439.2 percent. That means that the time price of the Basic 50 commodities fell by a geometric average of 65.5 percent.

The personal resource abundance multiplier is calculated by dividing the average of the time prices of the Basic 50 commodities in 1980 by the average of the time prices of the Basic 50 commodities in 2022. The multiplier tells us how much more of a resource a person can get for the same hours of work between two points in time. Given that the average of the time prices of the Basic 50 commodities fell by 65.5 percent, the same number of hours of work that bought one unit in the basket of the Basic 50 commodities in 1980 bought 2.9 units in the same basket in 2022.

That means that personal resource abundance of the average inhabitant of the planet rose by 190 percent between 1980 and 2022. The compound annual growth rate in personal resource abundance amounted to 2.7 percent, implying that personal resource abundance doubled every 26 years.

While the average of the time prices of the Basic 50 commodities fell by 65.5 percent, the world’s population increased by 79.4 percent. So, for every 1 percent increase in the world’s population, the average of the time prices of the Basic 50 commodities fell by 0.825 percent (-65.5 percent ÷ 79.4 percent = -0.825).

Note that the personal resource abundance analysis looks at resource abundance from the perspective of an individual human being. The question that we aim to answer is: “How much more abundant have resources become for the average inhabitant of the planet?”

Population resource abundance analysis, in contrast, allows us to quantify the relationship between the overall (or global) resource abundance and the overall (or global) population growth. You can use a pizza analogy to consider the difference between the two levels of analysis. Personal resource abundance measures the size of a slice of pizza per person, while population resource abundance adds up all the slices to measure the size of the entire pizza pie.

Population resource abundance is calculated by multiplying the growth in personal resource abundance by the growth in global population ([1 + percentage change in personal resource abundance] x [1 + percentage change in population]). The resulting product of 5.201 (2.9 x 1.794) corresponds to the 520.1 value in the SAI 2023. Consequently, we can also say that population resource abundance increased at a compound annual growth rate of 4 percent, thus doubling every 17.65 years.

Figure 2: Visualization of the Relationship between Global Population Growth and Personal Resource Abundance of the 50 Basic Commodities (1980–2022)

The figure shows the increase in personal resource abundance for 50 basic commodities since 1980.

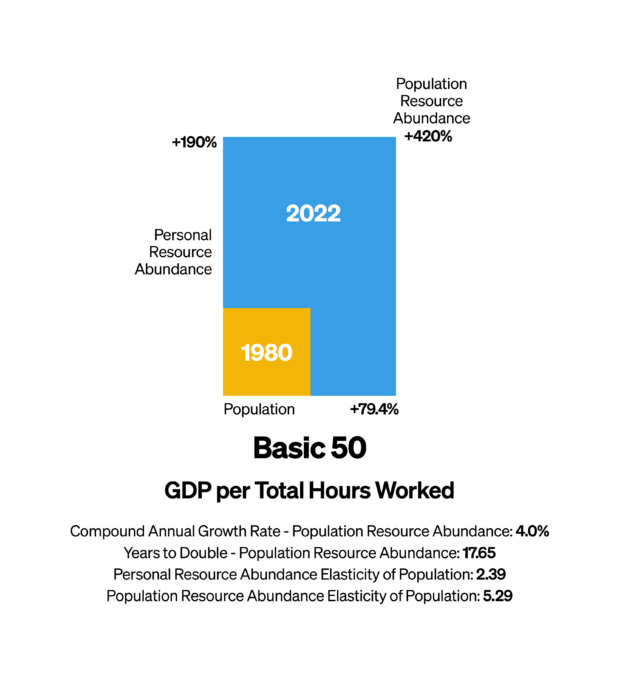
Let us also say a few words about the resource abundance elasticity of population. In economics, elasticity measures one variable’s sensitivity to a change in another variable. If variable X changes by 10 percent, while variable Y, because of the change in X, changes by 5 percent, then the elasticity coefficient of X relative to Y is 2 (10 ÷ 5). A coefficient of 2 can be interpreted as a 2 percent change in X corresponding to a 1 percent change in Y.

We found that every 1 percent increase in population corresponded to an increase in personal resource abundance (the size of the slice of pizza) of 2.39 percent (190 ÷ 79.4). We also found that every 1 percent increase in population corresponded to an increase in population resource abundance (the size of the pizza pie) of 5.29 percent (420 ÷ 79.4).

Changes between 2021 and 2022

Over the last 12 months, the SAI declined from 539.3 to 520.1 or by 3.55 percent. While regrettable, last year’s decline was much smaller than the 22 percent drop in 2021, which was caused by the COVID-19 pandemic and pandemic-related policies. That said, note that the index increased by an average 4.46 percent per year between 1980 and 2022.

Figure 3: The Simon Abundance Index, Annual Percentage Change (1980–2022)

The graph shows the average annual change in the Simon abundance index between 1980 and 2022.

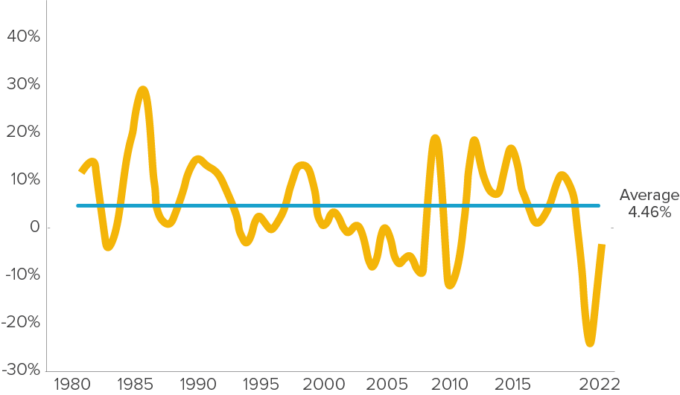
Going forward we expect the SAI to start growing again in 2023. Humanity has witnessed shocks like those caused by the pandemic and experienced accompanying reductions in resource abundance before. Mercifully, history suggests that growth in the abundance of resources can be restored. The SAI, for example, grew by 28.4 percent, 20.0 percent, and 19.3 percent in 1986, 1985, and 2009, respectively.

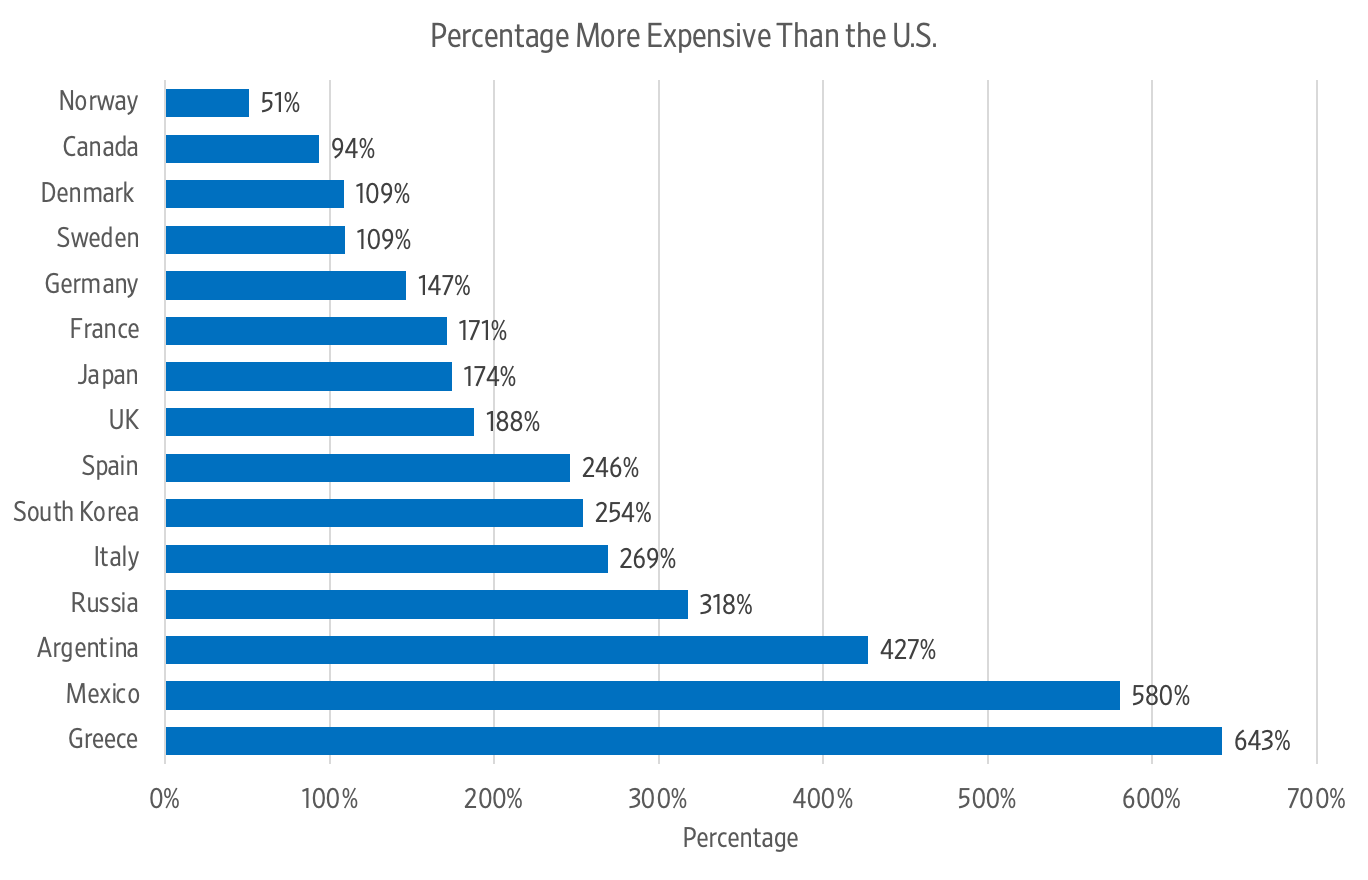
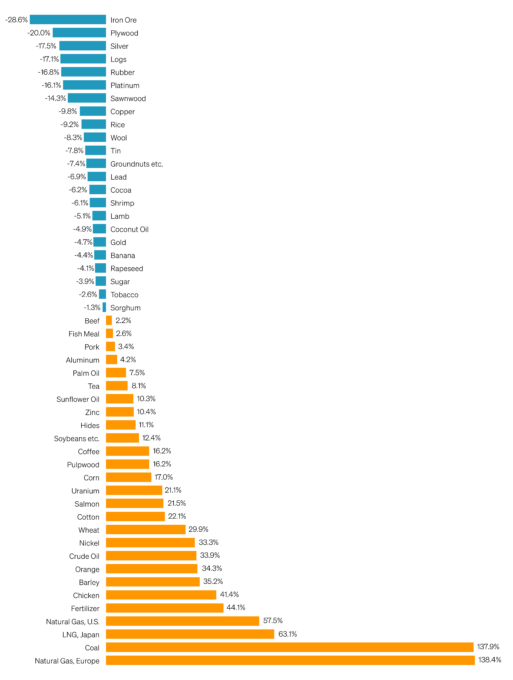
Figure 4: The Simon Abundance Index, Percentage Change in Time Prices of Individual Resources (2021–2022)

The figure shows the percentage change in the time price of individual resources between 2021 and 2022.

Conclusion

Despite the recent decline in SAI, resource abundance is still increasing at a faster rate than the population is growing. We call that relationship superabundance. We explore this topic in our book Superabundance: The Story of Population Growth, Innovation, and Human Flourishing on an Infinitely Bountiful Planet.

Additional Information

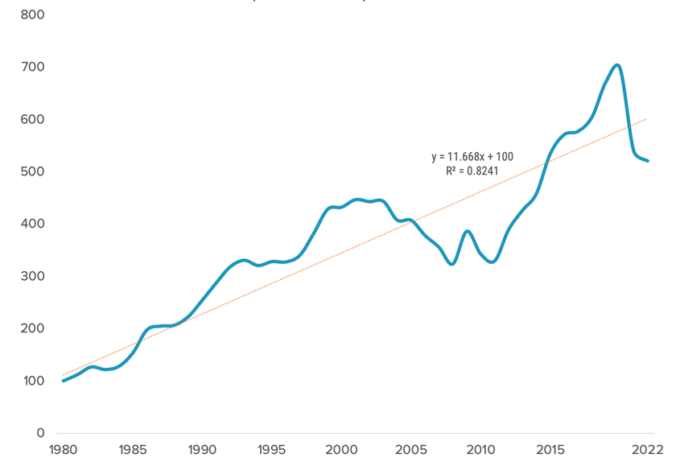
Appendix A: Alternative Figure 1 with a Regression Line, Equation, and R-Square.

The graph shows the Simon Abundance Index from 1980 to 2022 with a regression line.

Appendix B: The Basic 50 Commodities Analysis (1980–2022)

The figure gives more detail on the abundance of fifty commodities that compose the Simon Abundance Index.

Appendix C: The Basic 50 Commodities, Percentage Change in Personal Resource Abundance (1980–2022)

The figure shows the percentage change in personal resource abundance for fifty commodities

Blog Post | Energy Prices

Gasoline Abundance Increases with Population Growth

Since 1950, the global population has increased by 229 percent while the time price of gasoline fell by 35 percent.

Summary: Since 1950, the global population has grown by 229%, yet the time price of gasoline for US blue-collar workers has fallen by 35 percent, illustrating an enormous increase in personal gasoline abundance. By fostering free markets and entrepreneurial energy, societies like the United States have shown how the power of knowledge and innovation can transform finite physical resources into increasingly abundant commodities.


Since 1950, the time price of gasoline for US blue-collar workers has fallen by 35 percent. For the time it took to earn enough money to buy a gallon of gasoline in 1950, today’s blue-collar workers can buy 1.54 gallons. That means personal gasoline abundance has increased by 54 percent.

Crude oil is refined to make gasoline, and the market for crude oil is global. Since 1950, the world population increased by 229 percent, from 2.5 billion to almost 8.2 billion. How is that possible, since, according to Thomas Robert Malthus and Thanos, the opposite should occur? It’s because Malthus and Thanos mistakenly assumed that only atoms could be resources and that since we have a finite number of atoms, we must also have a finite number of resources.

The truth is that atoms without knowledge are not, in fact, resources; they have no intrinsic economic value. It’s only when we add knowledge to atoms that they become resources. Since there’s no limit to the amount of knowledge yet to be discovered, created, and shared, resources can be infinite.

The gasoline-population chart shows that more people mean more abundant gasoline, proving Malthus and Thanos wrong in their assumptions.

In the 1970s, people obsessed over the number of barrels of oil in proven reserves. They thought we had discovered all the oil. By dividing the quantity in proven reserves by the annual consumption, they calculated the date we would run out. That flawed approach of Malthus and Thanos fails to recognize that it’s the price of a resource, not its quantity, that matters. Humans react to increasing prices in a variety of ways; they consume less, search for more, look for substitutes, recycle, etc. These actions ultimately reduce prices and increase abundance. What increasing prices really does is focus our energy on discovering new knowledge, which transforms scarcity into abundance.

When prices go up, we not only look for more oil, but we also innovate ways to use it more efficiently. The top-selling car in 1980 was the Oldsmobile Cutlass. Gas mileage on this vehicle averaged 20 miles per gallon (17 city/23 highway). By 2023, the Honda CR-V was the most popular two-wheel drive car. The CR-V reported mileage at 31 miles per gallon (28 city/34 highway). This improvement in mileage represents an increase of 55 percent over this 43-year period (1980–2023). Mileage has been increasing at a compound rate of around 1 percent a year. Today’s cars are also much safer and more reliable, durable, and comfortable.

The lesson of gasoline over the past 74 years is that as the price increases, we find more of it, and we find more productive ways of using it. Then the price goes down. That has been true for all kinds of products, not just gasoline.

The exceptions are those manipulated by the government on the supply and/or demand side. President Richard Nixon imposed price controls in the early 1970s that were not fully removed until President Ronald Reagan did so in the early 1980s, allowing the free market to work its magic. Then fracking and horizontal drilling were applied to oil exploration, thanks in part to Harold Hamm’s Continental Resources in Oklahoma City. That company was a major player in the development of the Bakken formation in North Dakota, which led directly to massively increased domestic production and eventually resulted in the United States becoming a net exporter of oil.

With government price controls, there was almost immediate scarcity for nearly a decade, but when prices were allowed to freely operate, abundance soon overflowed. That shows how governments tend to create scarcity while entrepreneurs (such as Hamm) produce abundance. In the United States, property owners have subsurface property rights. In most other countries, the government owns all the underground oil. These private property rights, a free market and lots of entrepreneurs and innovators have made the United States the most productive energy producer on the planet. The country has led the world in crude oil production since 2018:

Can you guess where gasoline is the most affordable on the planet? Please read “Where Gasoline is Most Affordable.”

Entrepreneurs create abundance; bureaucrats almost always create scarcity. Choose wisely.

Find more of Gale’s work at his Substack, Gale Winds.

Bloomberg | Energy Prices

French Power at Record Discount to Germany on Cheap Nuclear

“French year-ahead power prices traded at a record discount to those in Germany, underlining France’s strong nuclear generation and its neighbor’s continued reliance on gas.

French power futures for 2026 are about 27% cheaper than the equivalent contract in Germany, according to data from European Energy Exchange. Nuclear power output in France reached its highest level since 2019 this month, pushing down futures to a three-year low.

While the energy transition may potentially bring lower long-term costs across Europe, the intermittency of solar and wind power means countries are facing short-term price spikes. France has smoothed those out with its nuclear fleet, but Germany is relying on more expensive gas and coal-fired stations after shutting its last atomic plant in 2023.”

From Bloomberg.

CBS News | Energy Prices

Gas Prices Recede and Could Continue Dropping in 2025

“Motorists can expect modestly lower U.S. gas prices in 2025 as inflation eases and amid booming domestic oil production.

After accelerating for much of the first half of the year, prices at the pump dipped in the second half of 2024, AAA data shows. Nationwide, a gallon of regular gas now averages $2.98 a gallon, down nearly 12 cents from a year ago, according to tracking service GasBuddy.”

From CBS News.