fbpx
01 / 04
The Gift of Life Years

Blog Post | Life Expectancy

The Gift of Life Years

The number of life years has grown by a factor of 20 since 1800.

Summary: This article explores the remarkable increase in total life years, which is the product of population growth and life expectancy. It shows how life years have grown by a factor of 20 since 1800, thanks to more people with the freedom to learn and innovate.


We measure life in quality and quantity. Quality can be a challenge because it is different for everyone. Measuring quantity is much easier­—just count how many people there are and multiply that figure by how long those people are expected to live.

According to the website OurWorldinData, in 1800, there were 1 billion people on the planet. Today there are over 7.8 billion of us. That website also reports that life expectancy in 1800 was around 28.5 years. Fortunately for all of us, life expectancy has increased to 73.2 years, with men at 70.8 years and women at 75.6. 

Total life years, then, is the combination of population growth and increase in life expectancy. In the last 220 years, life expectancy increased by 157 percent, and the population increased by 680 percent. Multiply those together, and you find that life years increased by 1,903 percent. 

Life years, population growth and life expectancy progress graphic

We can also look at this extraordinary growth by using a different kind of visualization. In the chart below, the population, measured in billions, is on the horizontal axis, and life expectancy, measured in years, is on the vertical axis. In 1800, there were 1 billion people and the average life expectancy was 28.5 years. The red box, then, represents 28.5 billion or the total number of life years in 1800.

Life expectancy in years v. Population in Billions graphic

We will use a green box to represent the total life years in 2020. That year, life expectancy was 73.2 years (i.e., 157 percent higher than it was in 1800). Between 1800 and 2020, the world’s population increased to 7.8 billion, or by 680 percent. So, the total life years in 2020 amounted to 571 billion – a 1,903 percent increase since 1800. 

More people with the freedom to learn and innovate can share their creations in the marketplace, thus making life safer, healthier, and longer for everyone. People today get 16,315 more days to enjoy living compared to those in 1800. Since 1800, every one percent increase in population corresponded to 24 days of additional life expectancy. Total life years increased 2.8 percent for every one percent increase in population. Life years have grown by a factor of 20 since 1800, coming out to an average annual increase of 1.38 percent for the last 220 years. At this rate, life years double every 51 years.

You can watch a video of this story here:

Blog Post | Economic Growth

The Great Decline in Poverty Over Time

We must understand the conditions which led to human flourishing and utilize the knowledge and tools at our disposal to encourage its further propagation.

“He related the case of one woman whose two little boys, freezing and on the brink of starvation, had been caught stealing food. When a policeman took the boys home, he found the mother with six other children ‘literally huddled in a little back room, with no furniture but two old rush-bottomed chairs with the seats gone, a small table with two legs broken, a broken cup and a small dish. On the hearth was scarcely a spark of fire, and in one corner lay as many old rags as would fill a woman’s apron, which served the whole family as a bed.” – Friedrich Engels, Condition of the Working-Class in England.

For the British working class, the crippling misery during the initial stages of the Industrial Revolution amounted to suffering that citizens of modern highly developed nations could scarcely imagine. To be poor during that time was to suffer chronic exposure to cold, wet, unhygienic living conditions, unrelenting undernourishment, illness, disease, and astonishingly dangerous working conditions.

Before widespread industrialization, even the wealthy merchants, landed gentry and royalty lived lives that would, in many ways, feel dreadfully inadequate by modern standards. The wealthy elite may have had access to large tracts of land, power, privilege, and the esteem and respect of their peers and subordinates. However, even the nobility lacked access to the most basic securities, amenities, and luxuries of modern life.

George III (1760 – 1820) may well have ruled over an Empire, yet the king lacked access to truly clean water, instantaneous communication, decentralized knowledge databases, effective medications, modern anesthetics, advanced dental care, intercontinental high-speed travel, inexpensive light, vaccinations, air-conditioning, central heating, and a thousand other advantages that we take for granted today.

Unlocking the seemingly limitless energy of coal and harnessing its chemical potential in driving steam engines kicked off the greatest transformation in human civilization since the Agricultural Revolution. For the 15,000 years preceding the Industrial Revolution, humans struggled to produce a surplus of goods, materials, and, most importantly, food. Pre-industrial poverty resulted in punishingly crushing and short lives.

Before industrialization, British child mortality was over 43 percent, and more than 900 women died in childbirth for every 100,000 births. More than 89 percent of the population lived in extreme poverty, and less than 13 percent of the population was literate. For nearly everyone, pre-industrial life was a hand to mouth fight for survival that looked nothing like the romantic settings of Downton Abbey. Between 1800 and 1900, industrialization gradually improved the standards of living in the West, driving down poverty and increasing access to everything from clean water to food and from education to healthcare. As standards of living rose, so did our definition of poverty change.

Today, it is possible to be poor in the United States, Canada, Australia, the United Kingdom, and other developed nations while having access to a mobile phone, a sheltered home with heating and air-conditioning, an inexpensive car, a refrigerator, television, laptop, access to the internet and advanced healthcare. In the United Kingdom, the Child Poverty Action Group points out that “3.2 million children in the UK don’t have access to a one-week holiday once a year” – something that would have been unheard of in the 1800s and tough to come by as recently as 70 years ago.

The same agency estimates that 100,000 children in the UK lack three meals a day, or a warm winter coat, which by 2020 standards is truly unacceptable. But while this number is high, skipped meals and poor winter clothing were commonplace in the pre-industrial era. That does not mean that life in the West in general and the UK in particular is perfect or that problems don’t exist. However, it is important to note that industrialization has consistently driven down the prevalence of extreme poverty while continuing to raise the bar on the definition of various forms of poverty.

Let’s turn to the world as a whole. Access to clean water, food, education, abundant and inexpensive energy, fertilizer, advanced agriculture, vaccination and modern health care, science, technology, the internet, and democracy – all made easier through the wealth that free-market generates – improved global standards of living at an unprecedented speed. Freedom, in other words, has done more to improve humanity’s quality of life in the last 200 years than have any other systems or tools over the last 15,000 years.  As a result, child mortality fell from over 43 percent to less than 4 percent, while doubling life expectancy for nearly every human on the planet. We have lifted the global literacy rate from 12 percent to over 86 percent and reduced extreme poverty from over 89 percent to less than 9 percent.

Finally, consider the following comparison. In 1800, life expectancy in the United Kingdom was 38.6 years, and GDP per capita was $3280. By 2019, life expectancy in the UK was 81.1 years, and GDP per capita was hovering around $40,000. At 59.2 years, life expectancy in today’s Somalia, which is the world’s poorest country, is more than 20 years higher than that in the world’s wealthiest country 220 years ago. Our goal as individuals and as a civilization must be to understand those conditions which led to human flourishing – and to utilize the knowledge and tools at our disposal to encourage its further propagation.

Blog Post | Economic Growth

Improvements in Human Well-Being in the New Millennium

Humanity's gains in the 21st century are a cause for considerable optimism.

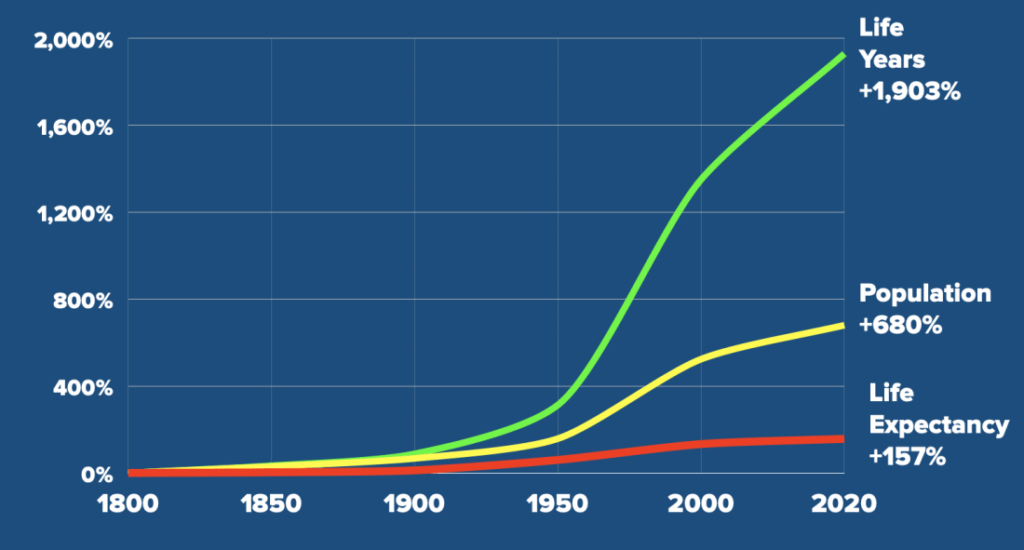
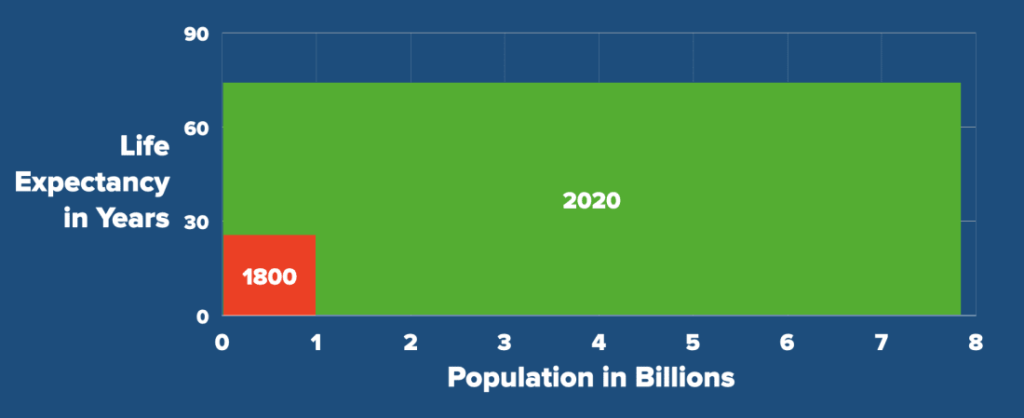
The story of humanity over the course of the last two centuries is nothing short of remarkable. As late as 1870, life expectancy in Europe and the world was 36 and 30 years, respectively. Today, it is 81 and 72 years, respectively. In 1820, 90 percent of humanity lived in extreme poverty. Today, less than 10 percent does. In 1800, 88 percent of the world’s population was illiterate. Today, 13 percent of the world’s population is illiterate. In 1800, 43 percent of children died before their fifth birthday. Today, less than 4 percent do. In 1816, 0.87 percent of the world’s population lived in a democracy. In 2015, 56 percent did. In 1800, food supply per person per day in France, which was one of the most advanced countries in the world, was a mere 1,846 calories. In 2013, food supply per person per day in Africa, the world’s poorest continent, amounted to 2,624 calories. Slavery, which was rampant in most parts of the world in 1800, is now illegal in every country. Finally, for the first time since the start of industrialization in the mid-18th century, global inequality is declining as developing countries catch up with the developed world.

The long-term trends in human welfare are undeniable, but indicators of human well-being have continued to improve at a dizzying speed within the lifespans of the teenagers in the West, many of whom are either ignorant of the real state of humanity or dissatisfied with the speed of progress. Opinion polls indicate that they have soured on free enterprise and are answering the siren calls of such socialists as Jeremy Corbyn in the United Kingdom and Alexandria Ocasio-Cortez in the United States. The hearts of the young are in the right place, but that does not absolve them of not knowing the facts. After all, if they want to change the world, they need to know something about it. To that end, I have looked at some of the most important indicators of human wellbeing, especially in the poor countries, since the start of the new millennium. The results are encouraging and ought to give us reasons for optimism.

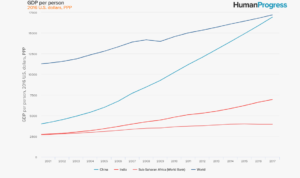
1. GDP per person, 2016 U.S. dollars, PPP, 2001-2017

Global: $11,347 → $17,196 (or a 52 percent increase)

Sub-Saharan Africa (SSA): $2,698 → $3,948 (or a 46 percent increase)

India: $2,773 → $6,950 (or a 78 percent increase)

China: $4,147 → $16,924 (or a 308 percent increase)

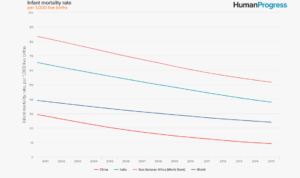
2. Infant mortality rate, per 1,000 live births, 2001-2015

Global: 38.4 → 23.9 (or a 38 percent decline)

SSA: 82.2 → 51.7 (or a 37 percent decline)

India: 64.2 → 37.9 (or a 41 percent decline)

China: 28.3 → 9.2 (or a 68 percent decline)

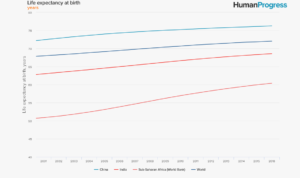
3. Life expectancy at birth, years, 2001-2016

Global: 67.9 → 72 (or a 6 percent increase)

SSA: 50.9 → 60.4 (or a 19 percent increase)

India: 62.9 → 68.6 (or a 9 percent increase)

China: 72.4 → 76.3 (or a 5 percent increase)

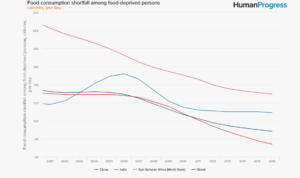
4. Food consumption shortfall among food-deprived persons, calories, per day, 2001-2016*

Global: 132.3 → 88.3 (or a 33 percent decline)

SSA: 202.7 → 129.6 (or a 39 percent decline)

India: 118 → 109 (or a 8 percent decline)

China: 130 → 74 (or a 43 percent decline)

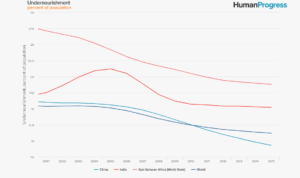
5. Undernourishment as a percentage of population, 2001-2015

Global: 15.4 → 11.2 (or a 27 percent decline)

SSA: 27 → 18.8 (or a 30 percent decline)

India: 17.5 → 15.2 (or a 15 percent decline)

China: 16 → 9.3 (or a 42 percent decline)

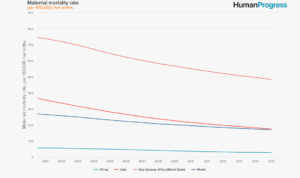
6. Maternal mortality rate, per 100,000 live births, 2001-2015

Global: 263.9 → 168.7 (or a 36 percent decline)

SSA: 736.9 → 481.9 (or a 35 percent decline)

India: 354 → 174 (or a 59 percent decline)

China: 56 → 27 (or a 52 percent decline)

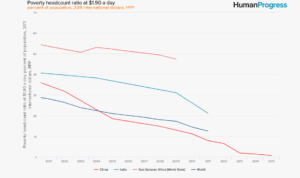
7. Poverty headcount ratio at $1.90 a day, adjusted for inflation and PPP, percent of population, 2001-2015

Global (2011): 28 → 12.5 (or a 55 percent decline)

SSA (2009): 53.5 → 47.3 (or a 12 percent decline)

India (2011): 40 → 21 (or a 48 percent decline)

China (2015): 34.5 → .7 (or a 98 percent decline)

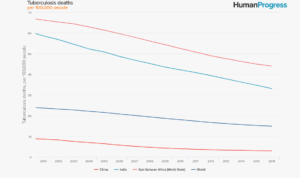
8. Tuberculosis deaths per 100,000 people, 2001-2016

Global: 23.6 → 15 (or a 36 percent decline)

SSA: 66 → 44 (or a 33 percent decline)

India: 58.6 → 33 (or a 44 percent decline)

China: 8.6 → 2.9 (or a 66 percent decline)

The world is not a perfect place and never will be. As long as there are people who go hungry or die from preventable diseases, there will always be room for improvement. Everyone has a role to play in helping those in need. Genuine help, however, should start with a clear understanding of what works and what does not. Free societies characterized by the rule of law, property rights, domestic competition and free trade have a much better record of tackling human misery than their socialist alternatives. The young followers of Corbyn and Ocasio-Cortez should, therefore, keep the Hippocratic Oath in mind: If you want to help, first do no harm.

*The depth of the food deficit indicates how many calories would be needed to lift the undernourished from their status, everything else being constant. The average intensity of food deprivation of the undernourished, estimated as the difference between the average dietary energy requirement and the average dietary energy consumption of the undernourished population (food-deprived), is multiplied by the number of undernourished to provide an estimate of the total food deficit in the country, which is then normalized by the total population.

This first appeared in CapX. 

Blog Post | Education & Literacy

Improving Africa's Education System

Liberia's education system is both increasingly effective and affordable.

Improving educational standards in Africa

Great strides have been made on many fronts when it comes to global education. In 2000 the average child went to school for 7 years. By 2010 it was over 8 years. Literacy rates have gone up from 76 percent to 81 percent over the same period. Millions of children are in school and learning. But, clearly, more progress is needed. Over 617 million children and adolescents are not achieving minimum proficiency levels in reading and mathematics. Globally, 330 million children are in school, but they are not learning. Some 263 million children are not in school at all.

Sub-Saharan Africa is particularly deficient when it comes to provision of quality education. But innovative policies are spreading throughout the continent, with dramatic effect. Liberia, for example, is the fourth poorest country in the world and has a literacy rate of less than 50 percent. The majority of children are out of school, with a 43 percent net attendance ratio according to UNICEF, indicating the percentage of those eligible to attend primary school, and who actually do so within that group.

So, rather than settle for incremental improvements, the country is trying to leapfrog forward. A few years ago, a public private partnership between the Ministry of Education and non state operators saw the establishment of seven independent school providers, who are running a small number of state elementary schools. These partners are a mix of non-profit and for-profit outfits.

One of the seven school operators helping Liberia is Bridge. Bridge equips local teachers with quality lesson plans via a digital e-reader device. These are given to every teacher working in a school run by Bridge. Teachers are following the digital lesson guides and systematically working their way through the local Liberian national curriculum. The technology enables Bridge staff in Monrovia to monitor the progress of children’s learning, check student and teacher attendance, and give highly accurate reports of what’s happening in the classroom to the Ministry of Education. Parents and teachers up and down the country have been embracing this new approach and are seeing dramatic changes in the speed, quantity and quality of learning.

A gold standard independent evaluation of the program by the Centre for Global Development and Innovations Poverty Action showed that schools being used to trial the new policies had seen learning improvements of 60 percent in a single academic year. That’s the average across all seven school operators. At Bridge public schools, the study showed, students learnt twice as fast as their peers in neighborhood schools. The focus on learning outcomes rather than access as a success benchmark is a notable shift taking place in the global education eco-system and one that resonates in Liberia.

These schools have experienced such an acceleration in learning that the newly elected government has given the go-ahead for the pilot program to continue into the next academic year with a few modifications. As the education minister Professor Ansu D.Sonii says, it will ensure that “the significant learning gains delivered under the program could be maintained.”

More than that, the Liberian Ministry for Education is already starting to roll-out across the whole education system some of the policies that have been tested successfully in the pilot program, like a longer school day. At present, normal government elementary schools only run until noon. But from next academic year they will continue until 3pm, as in the schools run by the program partners. The pilot program has shown that this extended day really is having a positive impact.

So far these improvements to basic education have cost the Liberian government very little – generally having relied on the commitment of generous donors for financing. For example, Bridge’s work in Liberia has cost the government $0 U.S. dollars over the last two years. The Government has an aspiration of providing quality education to every child for $100 a year by 2020 – currently they spend $50 – although not all providers receive this subsidy.

My view is that this innovative approach, integrating the private sector and others, has enabled the rapid improvement to Liberia’s education system and is both increasingly effective and affordable.

Even in the most remote corner of Liberia, children who are refugees from Ivory Coast are getting the same free, high quality learning as those in the capital Monrovia. Because Bridge gives every teacher an e-reader, they are all able to download the lesson guides and they are all supported by local teacher trainers. The remoteness of the school has no impact of the quality of the teaching or the materials. This is good news for Liberia and the rest of sub-Saharan Africa as it shows that it is possible for governments with very small education budgets to make huge learning gains quickly that directly impact children. The combination of brave new education policies plus high quality support through a PPP approach shows that the tide is against the learning crisis in Liberia.

The public in the USA agrees that this novel approach is a great way to quickly improve education in parts of the world that struggle to run enough quality schools. According to the public survey organization ONE Poll, three-quarters of the American public surveyed believe there should be more education public-private partnerships in developing countries. The same proportion of Americans also agree that Bridge International Academies are good for children. 

The current and previous Liberian governments both deserve high praise for their leadership in working to deliver transformative education opportunities for children using non state actors and innovative policies. Other governments across the continent should take note of Liberia’s success story and such a fast, effective and low-cost way to improve education for children who have the potential to change the world.