Summary: Modern society enjoys immense wealth through access to products created with high fixed costs but low marginal costs, thanks to mass markets. By leveraging technology and innovation, products from smartphones to streaming music and affordable medicine provide people with benefits once unimaginable. This abundance illustrates capitalism’s ability to generate shared prosperity, contrary to the views of critics who focus solely on the relative distribution of wealth.
Sen. Bernie Sanders (I-VT) has tweeted “There should be no billionaires.” Compared to 100 years ago, the United States is a country where everyone is a billionaire. We may not have a billion dollars in the bank, but we enjoy the benefits of many billions of dollars invested on our behalf in the products and services we use every day. Let me explain.
Fixed costs and marginal costs. In economics, we consider the cost to create a new product and then the cost to manufacture each additional unit. Many products have high fixed costs but low per unit costs when manufactured at scale. This per unit cost is also called marginal cost. The marginal costs on some products can reach zero.
More people mean we are all richer. We can enjoy products with such high fixed costs and low marginal costs because there are so many of us. Creators of these high fixed costs products can recoup these costs from millions, if not billions, of customers. The Scottish economist Adam Smith understood that in 1776. If you want to get rich, have lots of potential customers. Large markets also allow people to develop their skills and specialize in such things as drug and software development. The bigger the population and the more we specialize, the more variety and lower costs we enjoy in the marketplace.
Here are five examples:
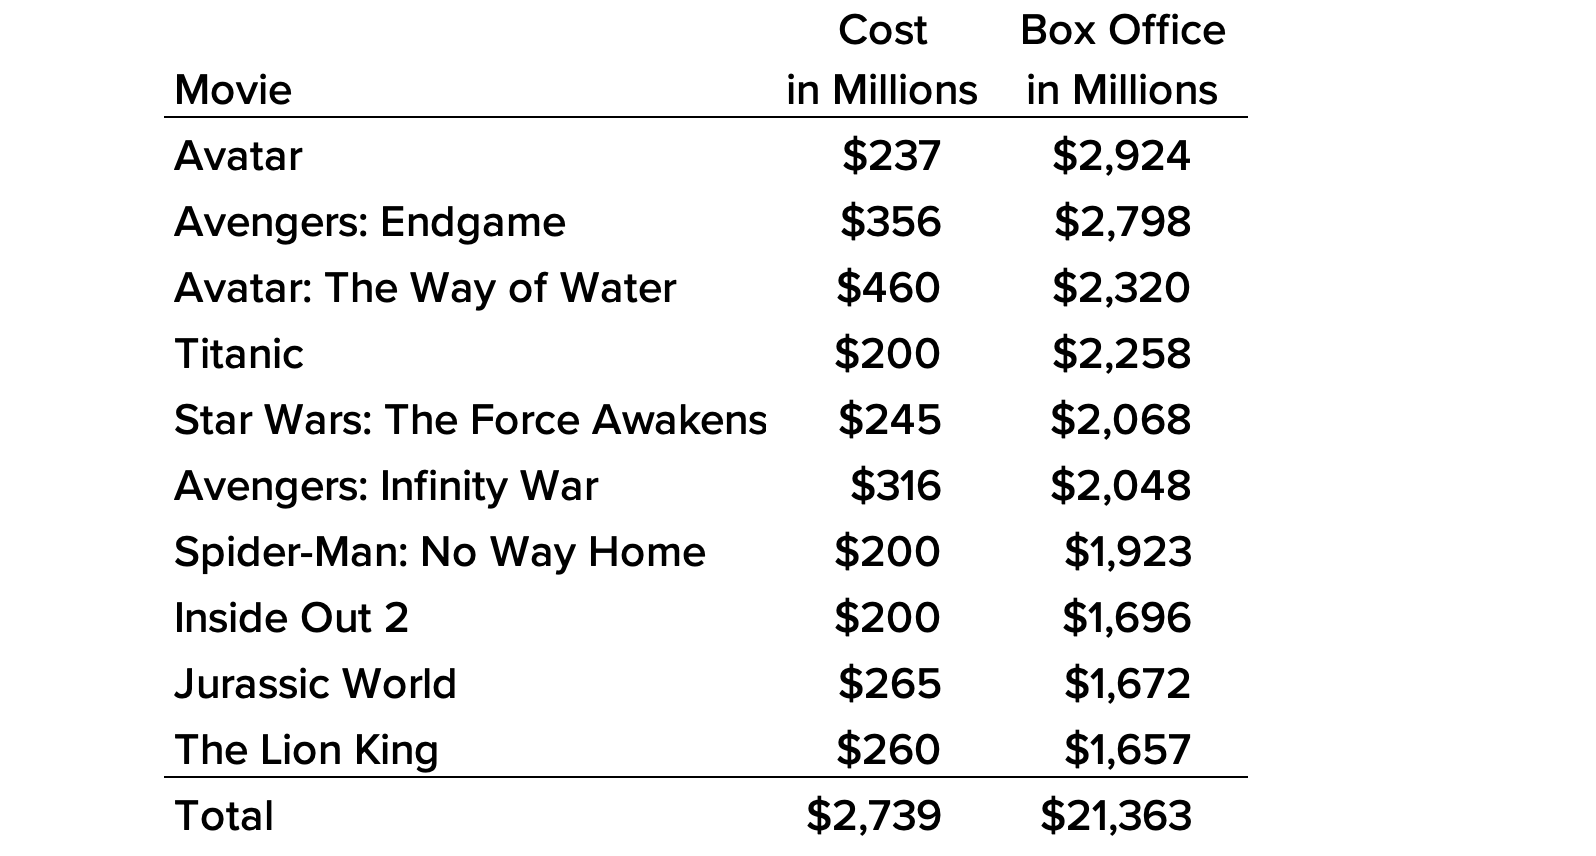
Movie billionaires. The top 10 highest-grossing films cost a total of $2.8 billion to create. You can now stream those movies at home on your $250, 55-inch large-screen high-definition TV along with 1,900 other movies for around $9.99 a month on Disney+. Unskilled workers earn around $17.17 an hour today, so it takes around 14.5 hours to buy the TV and 35 minutes of work each month to enjoy this multibillion-dollar benefit.
iPhone billionaires. It’s estimated that Apple spent $150 million over three years to develop the first iPhone, which was released in 2007. It sold for $499. How could it be sold so cheap if it cost so much? According to CNBC, Apple has sold over 2.3 billion iPhones and has over 1.5 billion active users. That’s how.
In 2009, Apple spent $1.33 billion on research and development. This year, it will have risen to $32 billion. The company has spent $208 billion on developing new products over the past 16 years. About half of Apple’s revenue comes from iPhone sales. Assuming half of its research and development investment has gone into the iPhone, we are enjoying a product that costs over $100 billion for about $30 a month, or around an hour and 45 minutes of work for a typical unskilled worker.
Note: In 2009, Amazon spent $1.24 billion on research and development, similar to Apple. This year, it expects to spend over $85 billion. In the past 16 years, Amazon has spent $485 billion.
Medicine billionaires. The cost to develop a new drug is estimated to range from less than $1 billion to more than $2 billion. The U.S. Congressional Budget Office notes, “Those estimates include the costs of both laboratory research and clinical trials of successful new drugs as well as expenditures on drugs that do not make it past the laboratory-development stage, that enter clinical trials but fail in those trials or are withdrawn by the drugmaker for business reasons, or that are not approved by the FDA.” Once a drug is approved, the marginal cost can be very low, maybe under a dollar.
If it costs $1 billion to develop a new drug, but each new unit of the pill only costs a dollar, how much should you charge the customer for it? The answer depends on the size of the market. If the market is 1,000 people, your costs will be $1 billion plus $1,000. You would have to sell each pill for $1 million plus $1 to break even. If your market was a million people, the breakeven price would drop to $1,001. If your market was a billion potential customers, the price per pill drops to $2.00. This is why new drugs are typically developed for widespread medical conditions. The fixed costs must be spread across a sufficiently extensive market. This is amazing when you think about it. You get a pill that required $1 billion to develop for $2.00 if a billion other people have the same medical problem.
Book billionaires. The Harry Ransom Center estimates that before the invention of the printing press, the total number of books in Europe was around 30,000. The United Nations Educational, Scientific and Cultural Organization estimates there are roughly 158,464,880 unique books in the world as of 2023.
When Gutenberg innovated printing in 1440, an average book cost around 135 days of labor, ranging from 15 days for a short book to 256 days for a major work. If workers put in eight hours a day, they’d have to work 1,080 hours to afford an average book. Today, blue-collar compensation (wages and benefits) is around $37 an hour. If there had been no printing innovation, it would cost about $40,000 to buy a book today.
Google has become the new Gutenberg. It has a library of more than 10 million free books available for users to read and download. Assuming the average book is around 250 pages and a half inch thick, you would need a bookshelf around 80 miles long to hold this library.
Before Gutenberg and his press, Google and the internet, Amazon and its digital tablet, and the manufacture of computer memory chips, it would have cost $400 billion to have a library of 10 million volumes. It would have taken 5.4 million people working full time for a year to create this library in 1439.
Today, you can have this library for around $43. That’s $35 for the tablet and $8 for the 2 TB memory stick. Another valuable feature we enjoy today is being able to search for a word or phrase in any of these books.
Music billionaires. Thomas Edison developed the original phonograph record in 1877. Suddenly people did not have to be present at a live performance to hear music. In 1949, RCA Victor became the first label to roll out 45 RPM vinyl records, and by the 1950s, the price was around 65 cents each. Unskilled workers at the time were earning around 97 cents an hour. This put the time price of a song at 40 minutes.
Steve Jobs introduced the iTunes Store on April 28, 2003, and sold songs for 99 cents. By this time, unskilled wages had increased to $9.25 an hour. The time price of a song had dropped 84 percent to 6.42 minutes. Listeners in 2003 got six songs for the price of one in 1955.
Apple Music was launched on June 30, 2015. Today, a student can access 90 million songs for $5.99 a month. Soundcloud is another popular music streaming service with over 320 million songs priced at $4.99 a month, or 18 minutes of time for an unskilled worker.
In 1955, the time to earn the money for an unskilled worker to buy the Soundcloud catalog of 320 million songs on 45 RPM records would have taken 106,666,667 hours. At today’s rate of $17.17 an hour, it would have cost $1,831,466,666.
Capitalist billionaires. Under capitalism, the only way wealth can grow is if entrepreneurs create it in the form of new products and services. Becoming a billionaire is a by-product of how successful a person is at creating and producing. When someone creates a product based on knowledge, it is non-rivalrous. (Paul Romer won a Nobel prize economics in part for explaining this truth.) Non-rivalry means we can all use a product at the same time. It’s as if we all own the product. Knowledge products make us all billionaires.
Bernie Sanders’s does not seem to understand or appreciate these economic truths. He wants to expropriate capital from Elon Musk and other innovators and give the money to his fellow politicians and bureaucrats to enrich their friends and supporters. Once this capital is seized, however, entrepreneurs will be much less motivated to create more. Ask all the entrepreneurs who lived in the former Soviet Union, and those in China under Mao Zedong, how 100 percent taxation disincentivized them from creating and taking risks.
This article was published at Gale Winds on 11/7/2024.