fbpx
01 / 05
The Economic Madness of Malthusianism | Podcast Highlights

Blog Post | Health & Medical Care

The Economic Madness of Malthusianism | Podcast Highlights

Chelsea Follett interviews economist Stephen Barrows about the intellectual history of population economics, the benefits of population growth, and what we can expect from a future of falling fertility.

Read the full transcript or listen to the full podcast episode with Chelsea Follett and Stephen Barrows here.

The world population recently reached 8 billion people, sparking considerable debate about the consequences of population growth size. These concerns, of course, aren’t new. Can you walk us through the history of concerns about overpopulation?

Those concerns are traceable back to Thomas Robert Malthus, who lived in the UK in the late 18th century. Malthus observed that the population grew at a geometric rate, while the resources of the Earth, particularly food, only grew at an arithmetic rate. As a result, he argued that there is a limit to population that is enforced by famine and plague.

But Malthus was shortsighted. He saw poverty and a lack of resources, but he didn’t see the other side of the ledger, which is what humans can do to overcome population pressures. However, his concerns never went away.

Could you walk through some of the reactions from economists to these Malthusian ideas? How were they received?

Not all economists are pro-population growth, but generally speaking, they see a different dimension to human activity than what you might find from environmentalists and other experts in different fields.

Individuals like Jean-Baptiste Say and Frederick Bastiat began to interact with Malthus’s work and acknowledged some truths behind what he was saying. For example, as you employ agricultural land for crop production, you use the most productive land first, and then as you expand agricultural production, you use the less fertile land, and yields decline. But at the same time, these economists emphasize that human ingenuity is not static. Individuals adapt to their circumstances and find new ways to make the Earth’s resources more productive. We adapt to our circumstances in ways that you don’t see elsewhere in the animal kingdom.

In the late 19th century, Böhm-Bawerk and Friedrich Wieser bring up other factors. Böhm-Bawerk argued that the interest rate regulates prices through time and helps us accommodate some of the pressures from population growth. Similarly, Friedrich Wieser pointed out that in his own day, there was a significant increase in crop yields due to technology.

Economists like Ludwig von Mises, Friedrich Hayek, and Murray Rothbard emphasize the division of labor. Individuals have unique talents; if they specialize in what they do best, it benefits the whole population and helps us overcome pressures on the Earth’s resources. Murray Rothbard also pointed out that the idea of overpopulation presupposes an optimum population. And so, the question becomes, “what is the optimum population? And is it fixed?” And the answer is no because the environment is changing all the time, along with individual knowledge and technology. So, the so-called optimum population is also constantly changing, meaning that over or underpopulation is just a theoretical concept, not a concrete reality.

So, economists have been pushing back on this idea in various ways. One of the more recent prominent examples is the bet between the late University of Maryland economist Julian Simon and Paul Ehrlich. Could you talk to our listeners about that?

Ehrlich was an entomologist who wrote The Population Bomb in 1968, which made all sorts of apocalyptic predictions about mass famine and so forth. At around the same time, Julian Simon was investigating population and initially agreed that population growth was detrimental to the Earth’s resources. However, after he examined the data, he saw that his concerns were misplaced and that, in fact, population growth is associated with economic improvement.

They began debating back and forth, and eventually, Julian Simon proposed a bet. They created a price index of five metals and watched it for ten years. Simon bet that the price index would fall, and Ehrlich said that it would rise. Paul Ehrlich lost the bet.

Why did he lose? What is the relationship between population and prosperity?

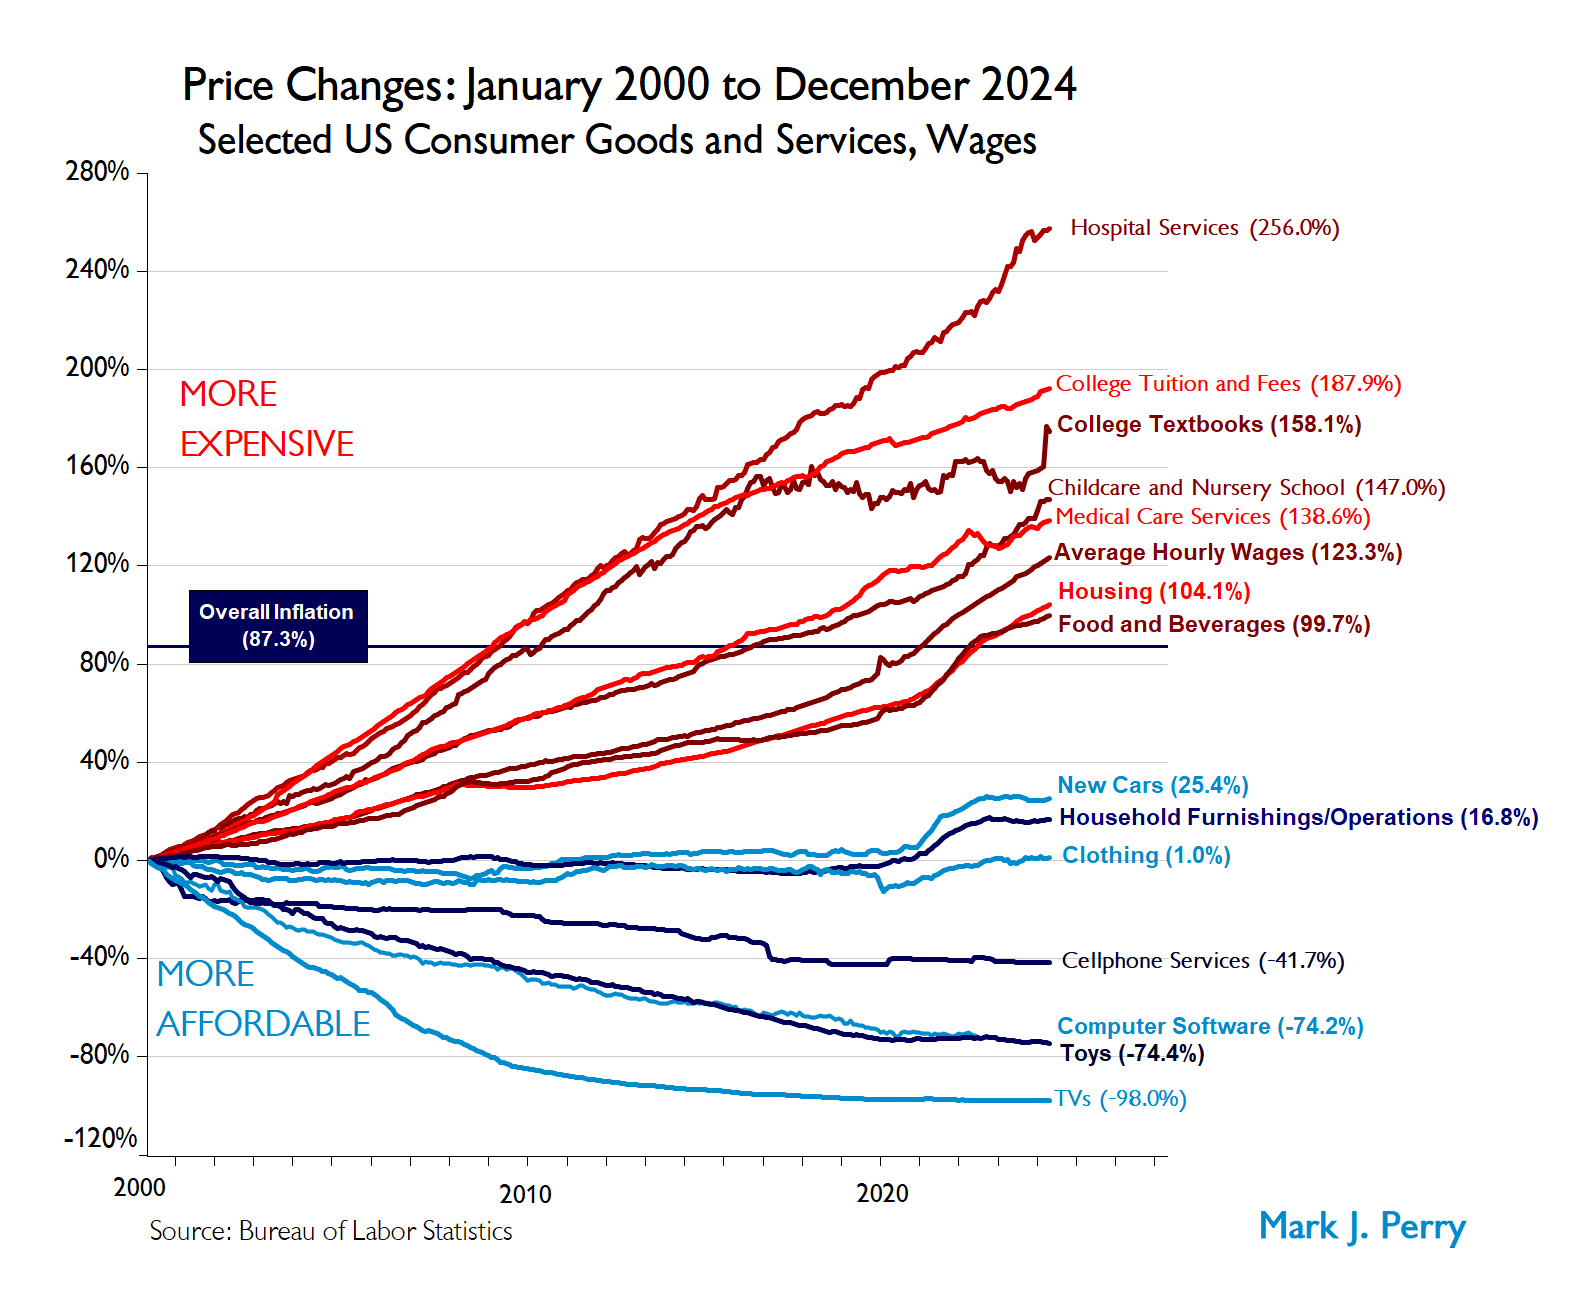
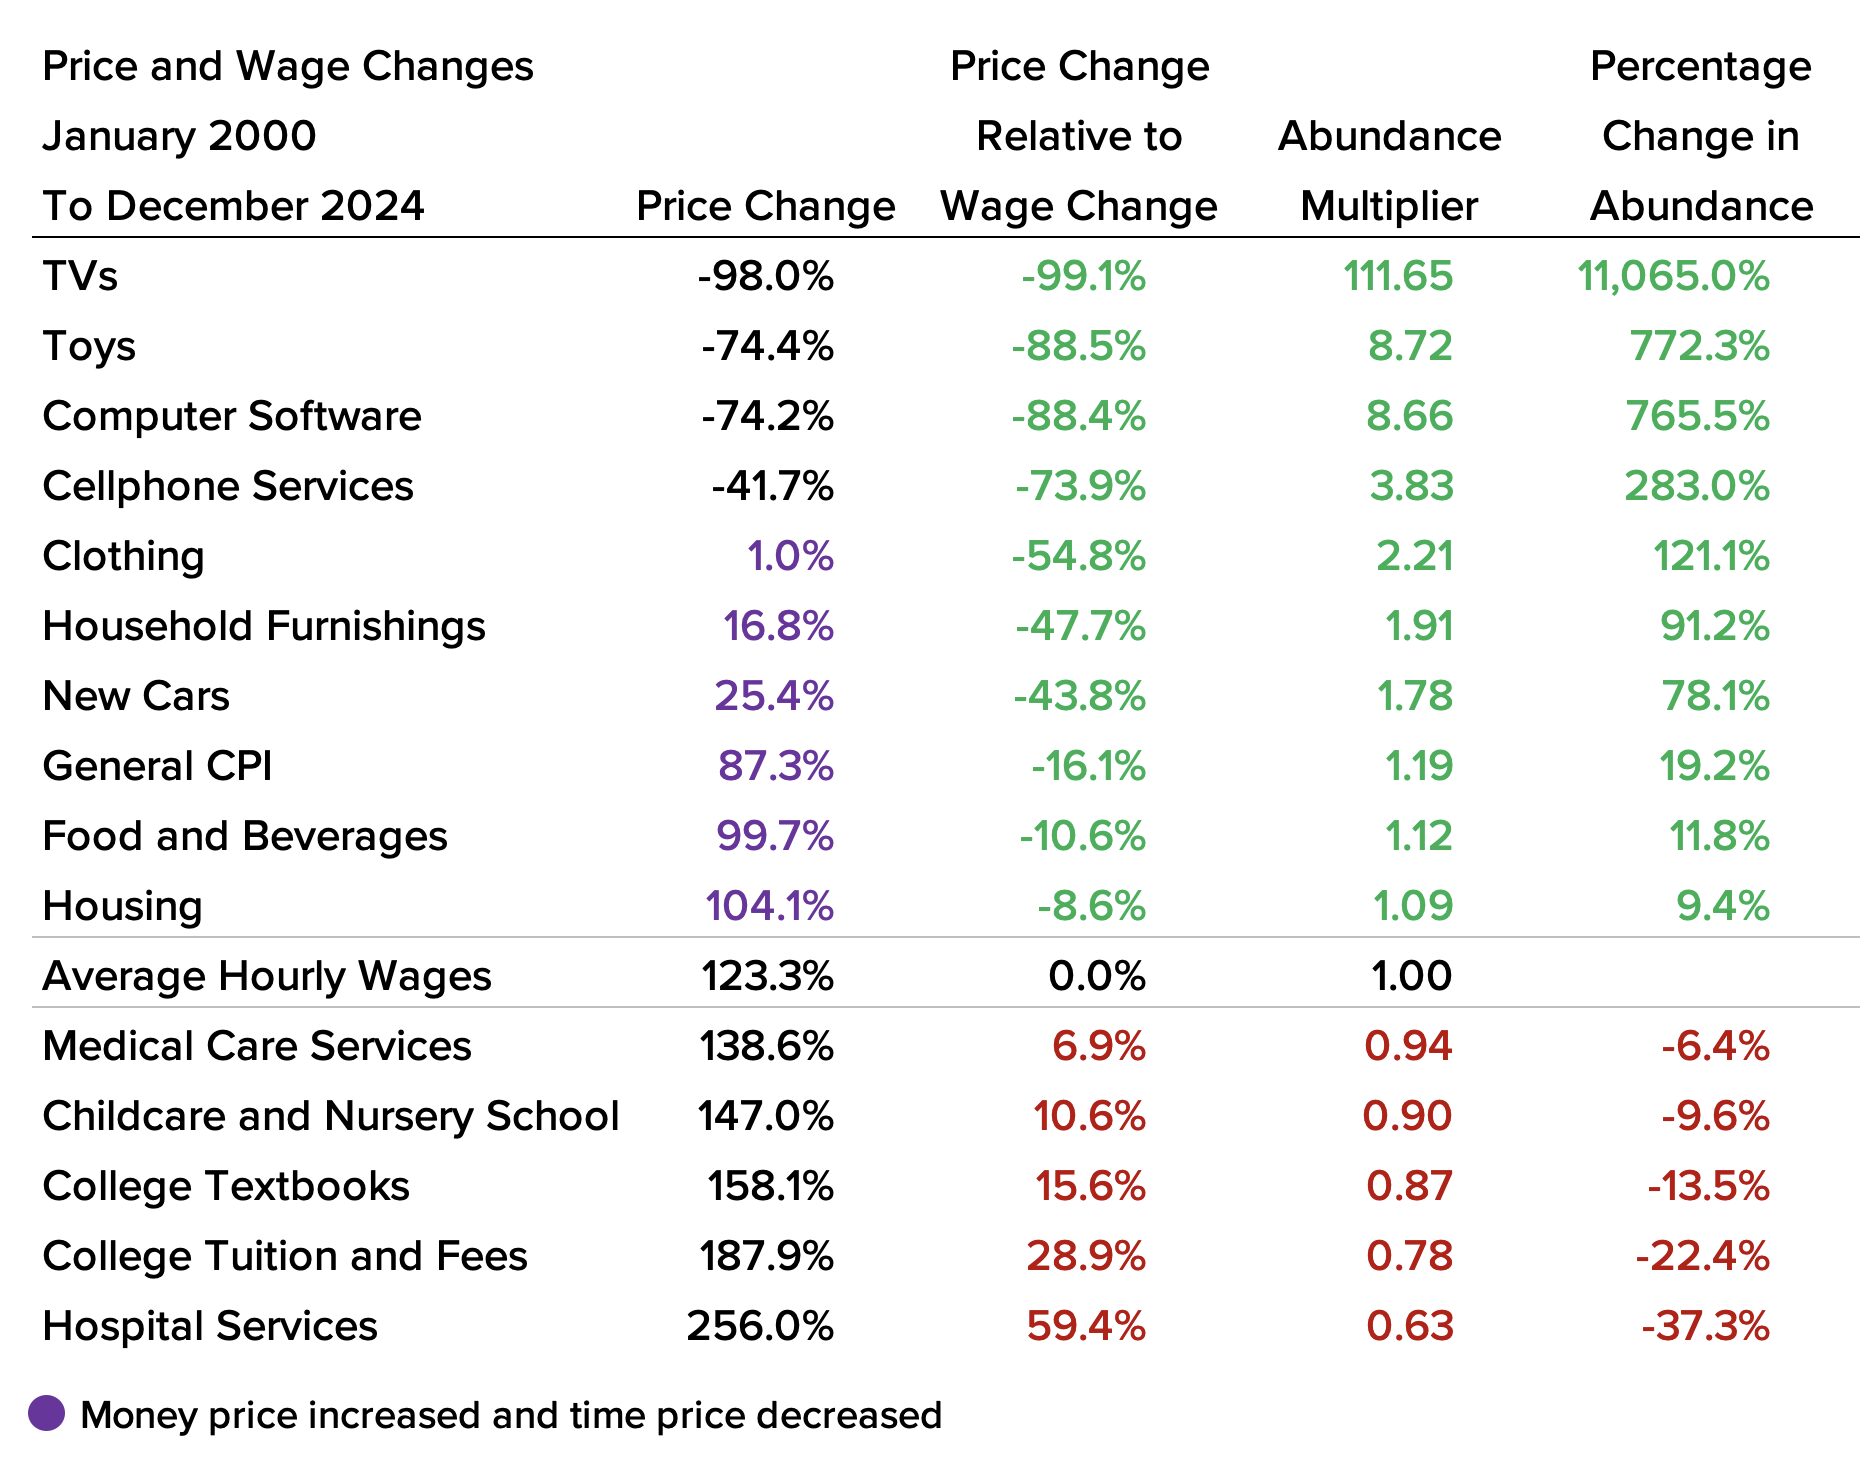
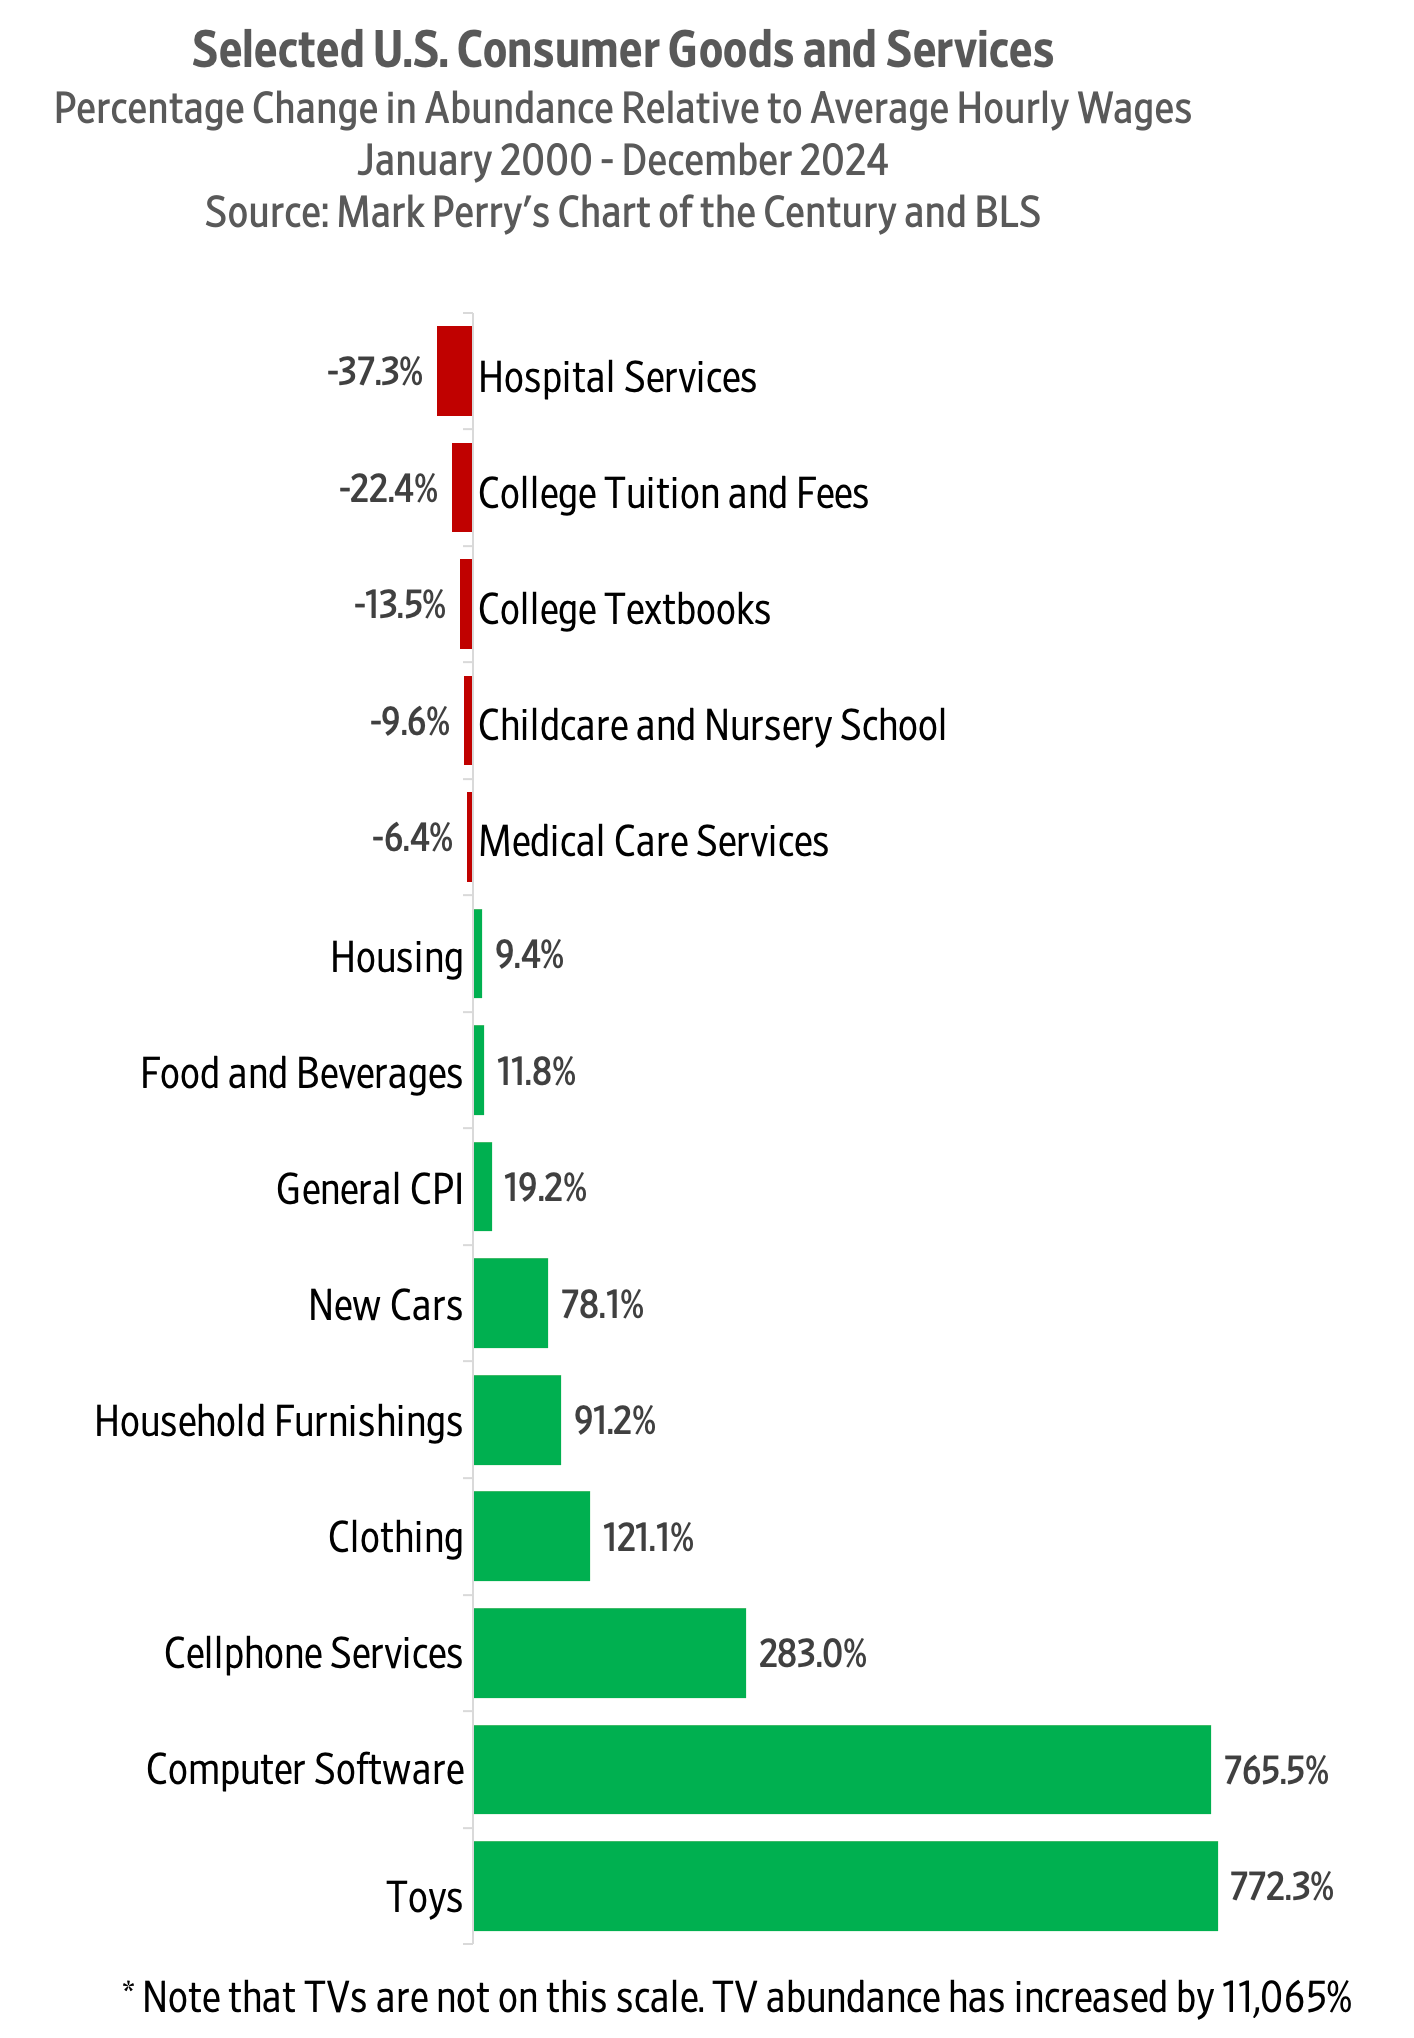
When people think of population growth, I think too often they think in terms of stomachs and not minds. Humans have needs; we need to consume to survive, and it’s true that the Earth is finite in terms of its concrete materials. But the human mind is infinite. There’s no limit to ideas and ingenuity; the human mind can get effectively infinite value out of fixed resources. Think about the smartphone and all the objects that we no longer produce because we all have them in our pockets.

In short, the mind trumps the stomach.

Today, birth rates are falling below the replacement rate in advanced economies. If all the countries in the world end up on that same trajectory, we could end up even with global sub-replacement fertility. What do you think about the potential effects of global falling birth rates and population decline?

There’s a great book called The Great Demographic Reversal, which points out that not only does population growth matter, but the shape of the global population matters, whether your population skews young or old. As the population ages, there are fewer workers producing and a large older demographic still consuming, which can cause prices to rise.

Some of the challenges of a shrinking population will be addressed through innovation. In Japan, for example, they use exoskeletons to help people work into very old age, even in manual labor jobs. However, as a general rule, low fertility rates lead to a relative lack of new ideas. You need people to solve problems, and as you have fewer people to tap from, you don’t have the kind of ingenuity and division of labor that you had before. Innovativeness also tends to decline as you get older. That’s just the natural cycle of humanity. So, hopefully, we won’t see global population decline. I don’t think we’ve ever seen gradual global population decline in history. We’ve seen shocks to population, plagues, et cetera, but we’ve never seen a steady decline across the globe, and nobody really knows what that entails.

Blog Post | Food Prices

Home Alone with Pizza Abundance

For the time price of one pizza in 1990, unskilled workers get 3.8 pizzas today. Upskilling workers get 8.4.

In the classic 1990 holiday movie Home Alone, the McCallister family orders 10 pizzas and the bill comes to $122.50 (plus tip). Unskilled workers at the time were earning around $6.03 an hour. That would put the time price of the 10 pizzas at 20.3 hours, or about 2 hours per pizza.

Jadrian Wooten and Chris Clarke over at Monday Morning Economist conducted a price check on how much 10 basic cheese and pepperoni pizzas cost today at a Little Caesars near the McCallisters’ home. It came to only $91.98 (plus tip). So, the nominal price of pizza actually shrank!

Unskilled workers are earning closer to $17.17 an hour today, so that would put the time price of 10 pizzas at 5.35 hours, or about 32 minutes per pizza. The time price of pizza has fallen by 73.6 percent. That means that for the time it took to earn the money to buy one pizza in 1990, you get 3.8 pizzas today. That’s a 280 percent increase in personal pizza abundance.

Since 1990, the US population has increased by 36.3 percent, from 248 million to 340 million. Each 1 percent increase in population corresponded to a 7.71 percent increase in pizza abundance.

If you started your first job in 1990 and went from being an unskilled worker to a blue collar worker in 2024, your hourly compensation (wages and benefits) increased from $6.03 an hour to $38 an hour. Your personal pizza abundance went from one pizza to 8.4 pizzas. Enjoy the party.

This article was published at Gale Winds on 10/22/2024.

Blog Post | Food Prices

Thanksgiving Dinner Will Be 8.8 Percent Cheaper This Year

Be thankful for the increase in human knowledge that transforms atoms into valuable resources.

Summary: There has been a remarkable decrease in the “time price” of a Thanksgiving dinner over the past 38 years, despite nominal cost increases. Thanks to rising wages and innovation, the time required for a blue-collar worker to afford the meal dropped significantly, making food much more abundant. Population growth and human knowledge drive resource abundance, allowing for greater prosperity and efficiency in providing for more people.


Since 1986, the American Farm Bureau Federation (AFBF) has conducted an annual price survey of food items that make up in a typical Thanksgiving Day dinner. The items on this shopping list are intended to feed a group of 10 people, with plenty of leftovers remaining. The list includes a turkey, a pumpkin pie mix, milk, a vegetable tray, bread rolls, pie shells, green peas, fresh cranberries, whipping cream, cubed stuffing, sweet potatoes, and several miscellaneous ingredients.

So, what has happened to the price of a Thanksgiving Day dinner over the past 38 years? The AFBF reports that in nominal terms, the cost rose from $28.74 in 1986 to $58.08 in 2024. That’s an increase of 102.1 percent.

Since we buy things with money but pay for them with time, we should analyze the cost of a Thanksgiving Day dinner using time prices. To calculate the time price, we divide the nominal price of the meal by the nominal wage rate. That gives us the number of work hours required to earn enough money to feed those 10 guests.

According to the Bureau of Labor Statistics, the blue-collar hourly wage rate increased by 240.2 percent – from $8.96 per hour in October 1986 to $30.48 in October 2024.

Remember that when wages increase faster than prices, time prices decrease. Consequently, we can say that between 1986 and 2024 the time price of the Thanksgiving dinner for a blue-collar worker declined from 3.2 hours to 1.9 hours, or 40.6 percent.

That means that blue-collar workers can buy 1.68 Thanksgiving Day dinners in 2024 for the same number of hours it took to buy one dinner in 1986. We can also say that Thanksgiving dinner became 68 percent more abundant.

Here is a chart showing the time price trend for the Thanksgiving dinner over the past 38 years:

The lowest time price for the Thanksgiving dinner was 1.87 hours in 2020, but then COVID-19 policies struck, and the time price jumped to 2.29 hours in 2022.

In 2023, the time price of the Thanksgiving dinner came to 2.09 hours. This year, it came to 1.91 hours – a decline of 8.8 percent. For the time it took to buy Thanksgiving dinner last year, we get 9.6 percent more food this year.

Between 1986 and 2024, the US population rose from 240 million to 337 million – a 40.4 percent increase. Over the same period, the Thanksgiving dinner time price decreased by 40.6 percent. Each one percentage point increase in population corresponded to a one percentage point decrease in the time price.

To get a sense of the relationship between food prices and population growth, imagine providing a Thanksgiving Day dinner for everyone in the United States. If the whole of the United States had consisted of blue-collar workers in 1986, the total Thanksgiving dinner time price would have been 77 million hours. By 2024, the time price fell to 64.2 million hours – a decline of 12.8 million hours or 16.6 percent.

Given that the population of the United States increased by 40.4 percent between 1986 and 2024, we can confidently say that more people truly make resources much more abundant.

An earlier version of this article was published at Gale Winds on 11/21/2024.

Business Standard | Food Prices

India’s Average Household Food Spending Falls Dramatically

“According to the paper, the share of total household expenditure on food has declined substantially in rural and urban areas across all states and UTs.

‘It is the first time in modern India (post-independence) that average household spending on food is less than half the overall monthly spending of households and is a marker of significant progress,’ it said.

The paper is a comprehensive analysis of the Household Consumption Expenditure Survey 2022/23 and comparison with 2011/12.

‘Overall, there has been a significant increase in households’ average monthly per capita expenditure across rural and urban India across all states and UTs,’ the paper said, adding that the magnitude of the rise is substantial but varies across states and regions.”

From Business Standard.