fbpx
01 / 05
Thanksgiving Dinner Costs Less and Other Good News

Blog Post | Food & Hunger

Thanksgiving Dinner Costs Less and Other Good News

Abundance is something we can all appreciate.

Watching the news or discussing it with your family at Thanksgiving dinner, it is not hard to fall into the trap of thinking that the world is moving in a negative direction. It may be a challenge to find reasons for optimism, let alone thankfulness. But as the Thanksgiving holiday draws near, know that the data clearly show that a great many things are improving. But please don’t take my word for it. To see the evidence for yourself, just spend some time poking around the data on HumanProgress.org. Our database documents progress in areas as diverse as air travel safety (welcome news for those traveling for the holiday) and declining rates of hunger and poverty.

One thing that has improved over time is the cost of Thanksgiving dinner itself. After declining in recent years, in 2019 the nominal cost of Thanksgiving has increased by just a single cent, according to the latest numbers from the American Farm Bureau Federation, an industry group representing the country’s farms. The AFBF sent a total of 250 volunteer shoppers to check prices at grocery stores in 38 different U.S. states for this year’s survey. The volunteers were instructed not to take advantage of any special promotional coupons or purchase deals. So the AFBF survey may actually overestimate the cost of Thanksgiving dinner. After adjusting for inflation, the cost of Thanksgiving dinner declined slightly from last year, decreasing by nearly 2 percent to reach close to an all-time low.

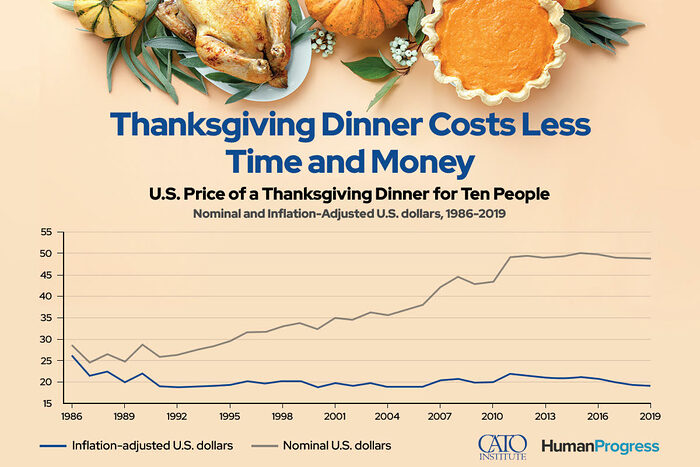
That’s great news for the 90 percent of Americans who celebrate Thanksgiving. Fortunately, the main course on many Thanksgiving tables, the turkey, costs slightly less than last year. In 2019 the average nominal cost of a Thanksgiving turkey stands at $20.80 for a 16-pound bird. That’s roughly $1.30 per pound, a 4 percent decrease from last year. And that’s before adjusting for inflation!

The inflation-adjusted cost of Thanksgiving has fallen every year since 2015, as has the nominal cost, with the exception of this year’s 1 cent increase.

The increasing affordability of Thanksgiving dinner is even more impressive when accounting for population growth. The U.S. population has increased by 37.5 percent since 1986. During the same period, the amount of time it takes a typical blue-collar worker, such as factory workers or machine operators, to earn enough to afford Thanksgiving dinner has declined by 33.8 percent. Moreover, the total bill—or the amount that the U.S. population collectively spends on Thanksgiving dinner—has declined by over 9 percent.

That’s according to Professor Gale Pooley of Brigham Young University at Hawaii, who co-authors the Simon Abundance Index with the editor of HumanProgress.org, Marian Tupy. The Index measures the changing prices of 50 basic commodities and how they relate to changes in the size of the world population.

The Simon Abundance Index for 2019 found that for each percentage increase in the world’s population, the average time price of commodities (e.g., the amount of time working needed to earn enough to buy commodities) has declined by slightly more than one percent. You can explore the Simon Project findings in depth on HumanProgress.org.

It seems that, on average, every child born on our planet over the past decades has grown up to make resources less scarce by contributing to innovation and the global economy. And as resources become more abundant, they also come down in price. That allows each one of us to spend less time working to afford goods like Thanksgiving dinner, and more time on what matters most to us. As you gather around the Thanksgiving table, that is something for which you can be thankful.

Blog Post | Accidents, Injuries & Poisonings

Driving in 2021 Was 225 Percent Safer than in 1970

Deaths per traffic mile have decreased by 69.3 percent while miles per gallon increased by 95.4 percent.

Summary: Over the span of five decades, advancements in vehicle safety technology have contributed to substantial improvements in traffic safety. Meanwhile, significant enhancements in fuel efficiency have been achieved. If you define travel abundance as a combination of these two factors, then abundance has increased by 596 percent.


Between 1970 and 2021, the rate of traffic deaths for every 100 million miles driven decreased by 69.3 percent, from 4.88 to 1.50, according to the National Safety Council.

Vehicle miles driven increased 179.8 percent from 1.12 billion miles in 1970 to 3.13 billion in 2021. During this same period, the number of deaths decreased by 14 percent from 54,633 to 46,980.

If traffic safety hadn’t improved since 1970, there would have been 152,842 traffic deaths in 2021 instead of 46,980. That means 105,862 more people are alive thanks to better traffic safety measures. Adjusted for miles driven, for every traffic death in 2021, there were 3.25 in 1970 (4.88 ÷ 1.5 = 3.25).

The opposite of the death rate would be the life safety rate. If we index traffic safety at a value of 1 in 1970, the rate would be 3.25 in 2021. Measured from this perspective, 2021 was 225 percent safer than 1970. Vehicle safety has been increasing at a compound annual rate of 2.34 percent, doubling every 30 years.

Cars and drivers are both getting safer by getting smarter. Cars today have three-point seat belts, air bags, stability control, backup cameras, blind spot detection, anti-lock brakes, radial belted tires, headrests, tire pressure monitoring, automatic emergency braking, lane departure warning, adaptive headlights, adaptive cruise control, and anchors for child seats.

We also get much better mileage. The full-size Ford Galaxie took the number-one spot in sales for 1970. It got 13 to 16 miles per gallon. Today’s bestseller is the Honda CRV, which gets 28 to 34 miles per gallon. Gas mileage has increased by 114 percent while safety has improved by 225 percent. If you define travel abundance as a combination of these two factors, then abundance has increased by 596 percent.

This article was published at Gale Winds on 4/24/2024.

Blog Post | Cost of Material Goods

The Rise of Contact Lens Abundance

Get almost 16 today for the time price of one in 1971.

Summary: Since the introduction of the first US commercial soft contact lenses, significant advancements have made them more accessible and affordable. This progress in abundance, driven by continuous innovation, underscores the importance of fostering an environment conducive to scientific and entrepreneurial advancements for the prosperity of society.


In 1971, Bausch & Lomb manufactured the first US commercial soft contact lenses. An eye doctor fitting ran around $550, and a pair of contact lenses cost $65, putting total costs around $615. Unskilled workers at the time earned about $2 an hour. This means the time price was about 307.5 hours.

Today an eye exam is about $120, and lenses start at $200 for a 12-month supply, putting the cost at $320. Unskilled workers now earn about $16.51 an hour, indicating a time price of 19.4 hours.

Unskilled workers can now get 15.9 sets of contact lenses for the time price of one set in 1971. Abundance has been growing at a compound annual rate of 5.35 percent, doubling in abundance every 13.3 years.

Today an estimated 45 million Americans wear contact lenses, of which 30 million are women. Imagine if the manufacturers of eyeglasses had used government regulation and coercion to prevent the innovation of contact lenses?

The more we make of something, the more we learn. The more we learn, the lower the price. The lower the price, the higher our standard of living. This truth was described by Adam Smith in 1776 in The Wealth of Nations.

And what is wealth? As George Gilder notes, “Wealth is knowledge and growth is learning.” The nation that is best at growing new knowledge will enjoy the greatest wealth. Artificial intelligence offers the hope that this learning process can be dramatically enhanced.

We can thank the continuous innovations of scientists and entrepreneurs in developing new contact lens designs and manufacturing techniques. America’s comparative advantage has been its visionary leadership in encouraging everyone in discovering and creating valuable new knowledge that can be shared in free markets. We cannot allow fear to blind us to these truths and prevent a future of innovation and greater prosperity.

This article was published at Gale Winds on 3/12/2024.

Blog Post | Cost of Material Goods

The Good Old Days Were Really Expensive

Most things are more abundant and affordable today.

If you had a dime in 1900, you could buy a 1-ounce Hershey chocolate bar and a 6.5-ounce bottle of Coca-Cola. It sounds like those were happy days indeed. That is until you look at wages, which were around 14 cents an hour for blue-collar workers.

At Walmart today, a 1.55-ounce Hershey bar costs $1.17 and a 1.25-liter bottle (42.27 ounces) of Coke is $1.52. Blue-collar workers earn closer to $36.15 an hour in compensation.

We buy things with money but pay for them with our time. Money prices are expressed in dollars and cents, while time prices are expressed in hours and minutes. A time price is simply the money price divided by hourly income.

In 1900, it took more than 21.4 minutes to earn an ounce of chocolate and 3.3 minutes for an ounce of Coca-Cola. By 2023, the chocolate time price had fallen to 1.25 minutes, and sodas were down to 0.06 minutes (3.58 seconds).

Chocolate cost fell 94.2 percent while cola cost fell 98.2 percent. For the time required to earn 1 ounce of chocolate in 1900, you get 17.1 ounces today, and for the time required to earn 1 ounce of Coca-Cola in 1900, you get 55.2 ounces today. Chocolate is 1,611 percent more abundant while cola is 5,425 percent more abundant.

Things can get more expensive and more affordable at the same time. This is why you must always compare prices to wages to see the true price, which is how much time things cost you.

This article was published at Gale Winds on 3/19/2024.

Blog Post | Energy Prices

Where Is Gasoline the Most Affordable?

Remember that it’s the time price, not the money price, that counts.

Summary: The affordability of gasoline varies significantly worldwide due to varying taxes and subsidies. Analyzing the GDP per hour worked against the money price per gallon shows that the United States emerges as the most affordable country for purchasing gasoline, even compared to nations where gasoline prices are heavily subsidized by the government.


According to GlobalPetrolPrices.com, the average price of gasoline around the world is USD5.03 per gallon. However, there is substantial difference in these prices among countries due to the various taxes and subsidies for gasoline. All countries have access to the same petroleum prices of international markets, but countries do not all impose the same taxes. As a result, the retail price of gasoline varies significantly.

Graph displays the gasoline price per gallon in US dollars in various countries

The money price of 16 selected countries ranges from $2.26 in Russia to $8.55 in Denmark. But what about the time price? To calculate the time price, we first calculated the GDP per hour worked in each country. The data to calculate this ratio come from the World Bank and the Conference Board.

Graph displays the GDP per hour worked in various countries

We then divided GDP per hour worked by the money price per gallon. This gave us the gallons of gasoline that one hour of work would buy in each country:

Graph displays the gallons of gasoline per GDP per hour worked in various countries

We also divided the nominal price per gallon by GDP per hour worked to get the minutes required per gallon:

This chart illustrates how much more expensive relative to the US the other 15 countries are in terms of time price:

Chart displays the cost in time price of gasoline in 15 countries

Of the 16 countries analyzed, the US is by far the most affordable place to buy gasoline. There are other countries where gasoline is more affordable, but the gasoline price in those countries is heavily subsidized by government.

Tip of the Hat: Jeremy Horpendahl

This article was published at Gale Winds on 4/1/2024.