fbpx
01 / 05
Prosperity and Income Aren't the Same Thing

Blog Post | Health & Medical Care

Prosperity and Income Aren't the Same Thing

Improvements in standards of living are constantly underestimated.

In recent years, income inequality has become a major political and economic issue in America. Income inequality, the argument goes, was caused not only by the growth of incomes among the wealthy, but also by wage stagnation among middle-class Americans. According to a 2015 report issued by the Economic Policy Institute, a pro-labour think tank based in Washington, DC, “ever since 1979, the vast majority of American workers have seen their hourly wages stagnate or decline”.

The blame, predictably, fell on President Ronald Reagan and his free-market reforms, even though economic liberalisation started under his Democratic predecessor, Jimmy Carter. But, income is an imperfect measure of overall living standards, which are much better than they used to be.

It is true that, adjusted for inflation, average hourly earnings of production and nonsupervisory employees in the private sector (the closest approximation for the quintessential blue-collar worker that I could find) have barely changed between 1979 and 2015. In October 1979, average hourly earnings stood at $6.51, or $21.20 in 2015 dollars. In October 2015, average hourly earnings stood at $21.18 – slightly below the inflation-adjusted 1979 level. But wages do not provide the full picture of workers’ earnings.

In recent decades, for example, non-wage benefits have exploded. Today they include relocation assistance, medical and prescription coverage, vision and dental coverage, health and dependent care, flexible spending accounts, retirement benefit plans, group-term life and long-term care insurance plans, legal and adoption assistance plans, childcare and transportation benefits, paid vacation and sick leave, and employee discount programs from a variety of vendors, etc. These could amount to between 30 and 40 per cent of the workers’ earnings.

Moreover, prices of many important consumer goods have declined dramatically. Comparing the prices of everyday items in the 1979 Sears Catalogue with similar products on Walmart.com at the end of 2015, I found that the inflation-adjusted prices of bicycles, blenders, coffee makers, convection ovens, dishwashers, food processors, refrigerators, gas grills, home entertainment systems, gas stoves, microwaves, slow cookers, toasters, treadmills, television sets and vacuum cleaners fell by an average of 76 per cent.

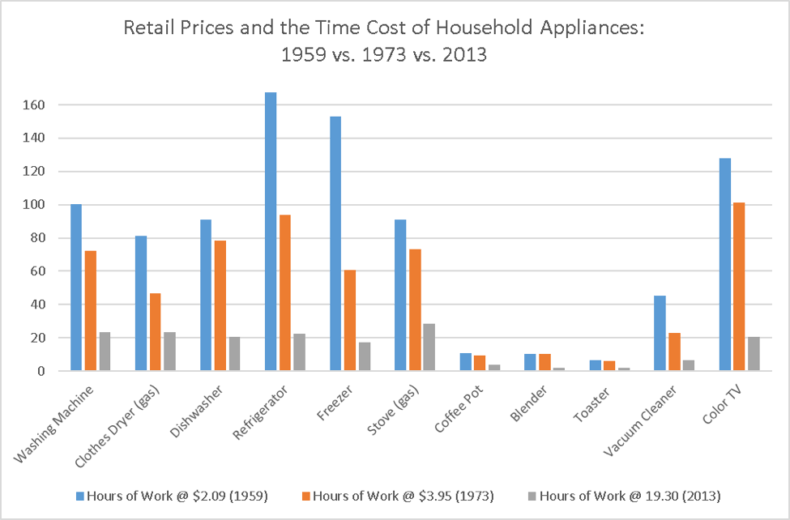
This is not a fluke. Writing in 2015, Professor Steven Horwitz of St. Lawrence University found a similar trend. According to Horwitz, whose data I represent in graph form below, retail prices of common household appliances fell by 81 per cent between 1959 and 2013 in terms of hours of labour needed to purchase those items.

More recently, Bruce Sacerdote from the Department of Economics at Dartmouth College found that “the pessimistic narrative on real wages is somewhat at odds with casual empiricism about material goods consumption”, and that “consumption for below median income families has seen steady progress since 1960”.

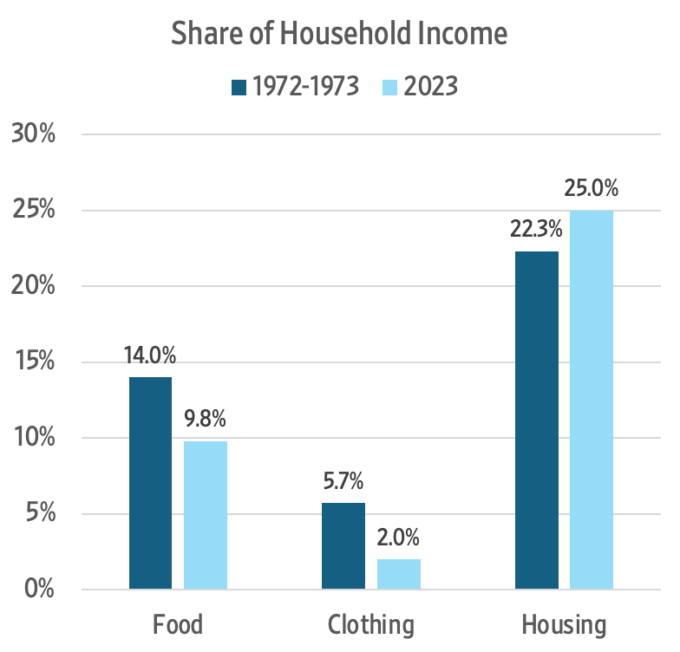
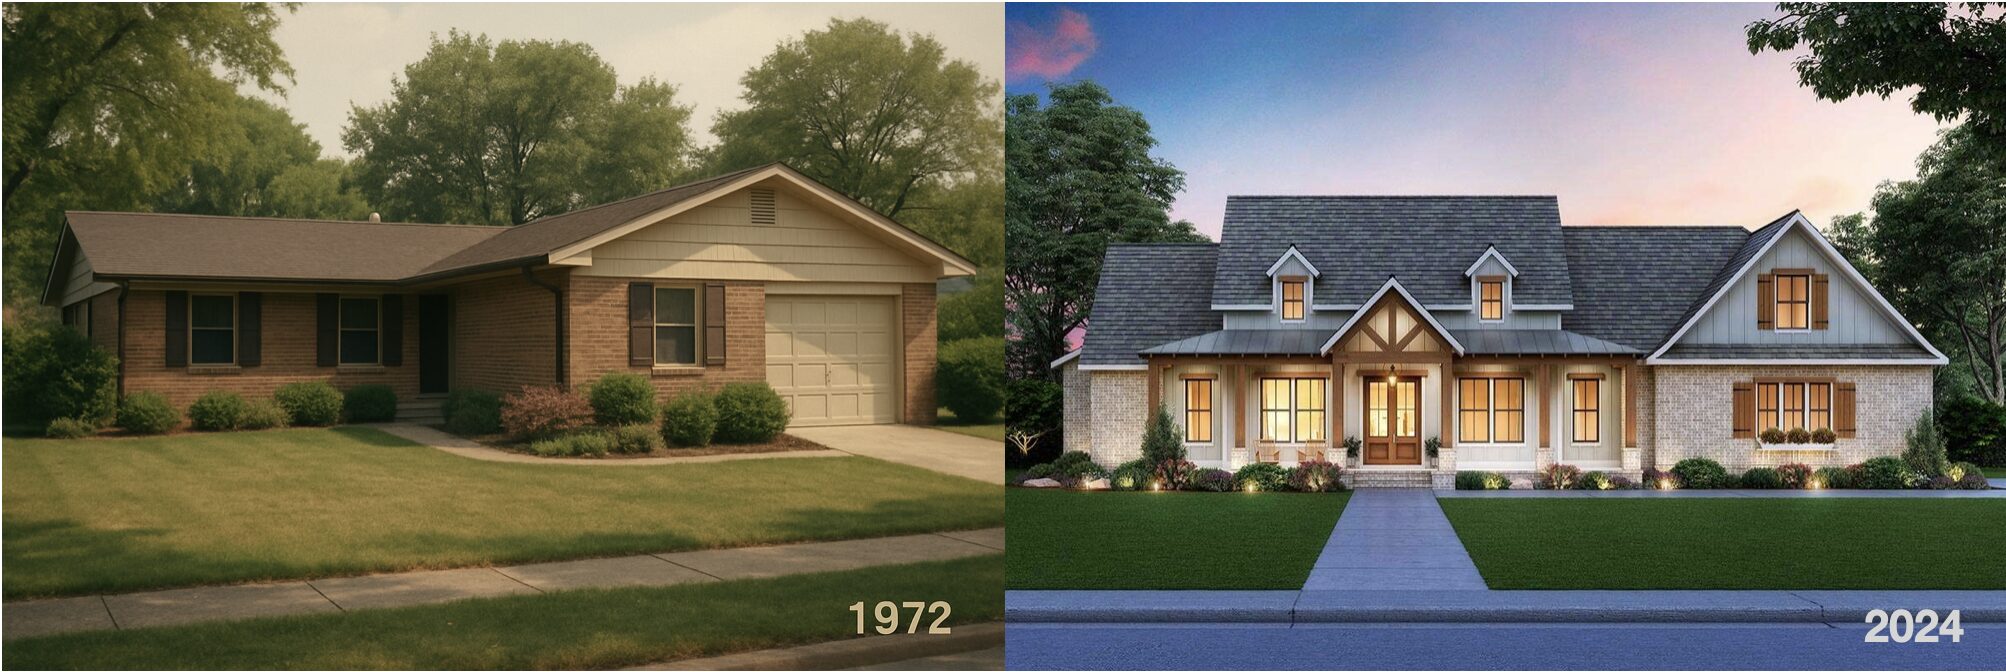
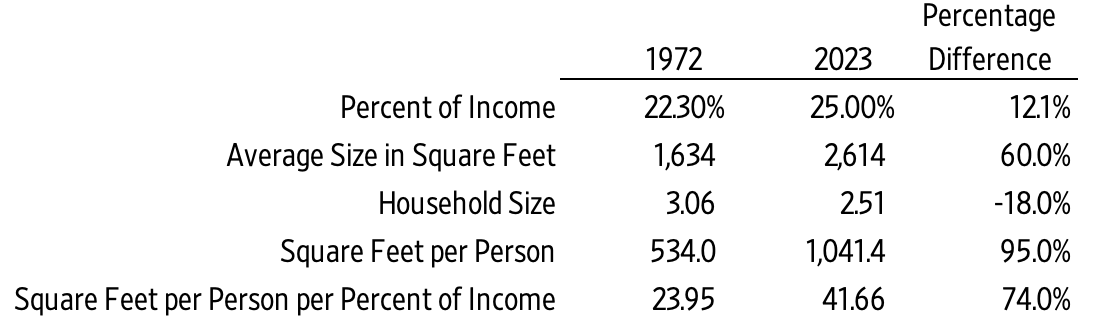
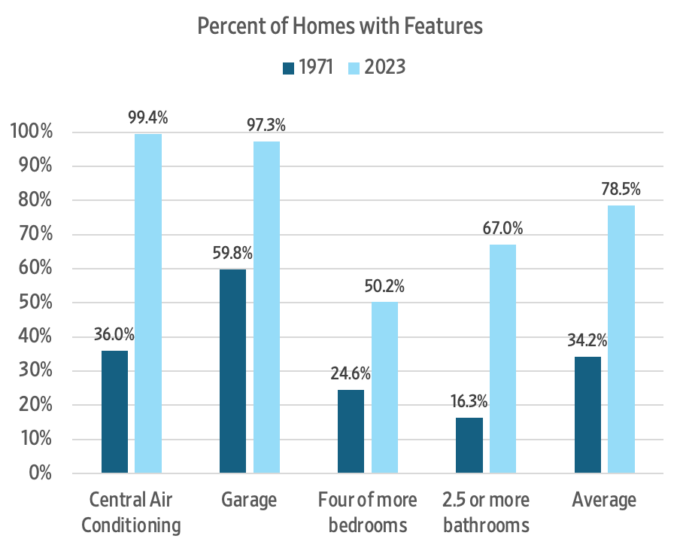
According to Sacerdote, house size inhabited by families below the 50th percentile increased from 1,200 square feet to 1,300 square feet between 1993 and 2009 alone. The number of bathrooms rose by 50 per cent between 1986 and 2015. Families below the 25th percentile owned 0.75 cars in 1970, but 1.4 cars in 2015. In 1960, 35 per cent of those families enjoyed no indoor plumbing. By 2015, virtually all had it. Both groups saw the number of bedrooms per family increase by 10 per cent since 1960. All the above improvements happened, while the average size of the American family declined.

Why is there such a disparity between the reality and perception? Sacerdote claims that improvements in standards of living are underestimated because of “new goods bias” or failure to quickly account for the spread of new goods; “product quality bias” or failure to account for growth in product and service quality; “outlet bias” or failure to incorporate availability of new less expensive outlets such as Walmart; and “substitution bias” or failure to account for consumers’ ability to substitute away from goods and services that have become relatively more expensive.

However, Sacerdote also found some demographic sub-groups, such as less than high school-educated men, might have actually become poorer over the last half-century and noted that many Americans can nevertheless feel poorer, due to more information about the living standards of other Americans.

Social dysfunction among less than high school-educated Americans, misinformation and, unfortunately, envy, contribute toward underestimation of gains that Americans have made in recent decades. Thankfully, none of that diminishes the real progress that ordinary Americans have made thanks to free trade and free markets.

This first appeared in CapX.

Wall Street Journal | Housing

California Ditches Environmental Law to Tackle Housing Crisis

“California lawmakers on Monday night rolled back one of the most stringent environmental laws in the country, after Gov. Gavin Newsom muscled through the effort in a dramatic move to combat the state’s affordability crisis.

The Democratic governor—widely viewed as a 2028 presidential contender—made passage of two bills addressing an acute housing shortage a condition of his signing the 2025-2026 budget. A cornerstone of the legislation reins in the California Environmental Quality Act, which for more than a half-century has been used by opponents to block almost any kind of development project…

The California Environmental Quality Act was signed into law in 1970 by then-Gov. Ronald Reagan, at a time when Republicans were at the forefront of the nation’s burgeoning green movement. President Richard Nixon also signed groundbreaking protections, including the Endangered Species Act.

CEQA, as it is known, requires state and local agencies to review environmental impacts of planned projects and to take action to avoid or lower any negative effects. Opponents of projects have used the law to delay them by years.”

From Wall Street Journal.

Good News Network | Natural Disasters

California’s First Wildfire-Resistant Neighborhood

“One of the nation’s largest homebuilders have created a community of entirely wildfire-resilient homes to help reduce homebuyers’ risks of loss if another Palisades or Dixie fire comes roaring by.

With nothing flammable on the exterior or the roofs and curated desert foliage around the gardens and lawns, the homes aren’t necessarily fireproof, but the design of the entire community was informed by identifying and eliminating the most common causes of homes catching fire.

Available now, and with some already off the market, KB Homes estimates their price at around $1 million, a price consistent with disaster-proof housing around the country.”

From Good News Network.

KVUE | Housing

Austin to Allow Some Apartments to Have Only One Staircase

“On Thursday [4/10/25], Austin City Council members approved a change to building codes that will soon allow apartments up to five stories tall to be built with only one staircase.

The change is set to begin on July 10, after a resolution to the city’s building technical codes was introduced in 2024. Councilmember José ‘Chito’ Vela said the units would include advanced sprinkler systems and protected stairwells.”

From KVUE.

Blog Post | Housing

US Housing Abundance Has Increased Dramatically

Compared to the early 1970s, we get 74 percent more square feet of housing per person, per percent of household income.

Summary: Over the past 50 years, Americans have seen a dramatic increase in housing quality and space. While housing costs appear to have risen, today’s homes offer more value per dollar. We can see this by adjusting for household size and improvements like air conditioning, garages, and extra bathrooms. We now get more housing for the same share of income.


The Bureau of Labor Statistics (BLS) conducts consumer expenditure surveys, collecting data on a wide variety of products and services.

Over the past 50 years, the percentage of household income spent on food fell 30 percent, and spending on clothing has dropped by 64.9 percent, yet housing costs have increased by 12.1 percent. What explains this rise? At least six key differences between homes in the early 1970s and in 2023 help account for the change:

  1. Size: The average home in 1972 measured 1,634 square feet, compared to 2,614 square feet in 2023—a 60 percent increase (980 additional square feet).
  2. Household Size: Average household size declined from 3.06 persons in 1972 to 2.51 in 2023, an 18 percent decrease. We’re buying more house per person.

In 1972, the average living space per person was 534 square feet; by 2023, it had nearly doubled to 1,041.4 square feet. In terms of affordability, one percent of household income bought 23.95 square feet of housing in 1972, compared to 41.66 square feet in 2023. We’re getting 74 percent more housing per person for the same share of income.

Four other factors also help explain the difference:

  1. Air Conditioning: In 1971, only 36 percent of homes had central air; by 2023, that number had reached 99.4 percent.
  2. Garages: The share of homes with garages rose from 59.8 percent in 1971 to 97.3 percent in 2023.
  3. Bedrooms: In 1971, only 24.6 percent of homes had four or more bedrooms; in 2023, 50.2 percent did.
  4. Bathrooms: The percentage of homes with 2.5 or more bathrooms increased from 16.3 percent in 1971 to 67 percent in 2023.

After adjusting for increased square footage and smaller household size, the share of household income spent on housing falls to 14.3 percent. If we further account for improvements—such as the addition of air conditioning, garages, extra bedrooms, and bathrooms—a modest 25 percent quality adjustment brings the rate closer to 10.7 percent. In effect, we’re now spending less than half as much of our household income on basic housing compared to the early 1970s.

We also see this phenomenon clearly when comparing automobiles from the early 1970s to those of today. While both have four wheels, modern cars deliver vastly superior fuel efficiency, comfort, safety, reliability, and performance.

The real question is: how much would someone have to pay you to trade your 2023 home and 2023 car for their 1972 counterparts?

Tip of the Hat: Jeremy Horpendahl

Find more of Gale’s work at his Substack, Gale Winds.