The Simon Abundance Index (SAI) quantifies and measures the relationship between resources and population. The SAI converts the relative abundance of 50 basic commodities and the global population into a single value. The index started in 1980 with a base value of 100. In 2023, the SAI stood at 609.4, indicating that resources have become 509.4 percent more abundant over the past 43 years. All 50 commodities were more abundant in 2023 than in 1980.
Figure 1: The Simon Abundance Index: 1980–2023 (1980 = 100)
The SAI is based on the ideas of University of Maryland economist and Cato Institute senior fellow Julian Simon, who pioneered research on and analysis of the relationship between population growth and resource abundance. If resources are finite, Simon’s opponents argued, then an increase in population should lead to higher prices and scarcity. Yet Simon discovered through exhaustive research over many years that the opposite was true. As the global population increased, virtually all resources became more abundant. How is that possible?
Simon recognized that raw materials without the knowledge of how to use them have no economic value. It is knowledge that transforms raw materials into resources, and new knowledge is potentially limitless. Simon also understood that it is only human beings who discover and create knowledge. Therefore, resources can grow infinitely and indefinitely. In fact, human beings are the ultimate resource.
Visualizing the Change
Resource abundance can be measured at both the personal level and the population level. We can use a pizza analogy to understand how that works. Personal-level abundance measures the size of an individual pizza slice. Population-level abundance measures the size of the entire pizza pie. The pizza pie can get larger in two ways: the slices can get larger, or the number of slices can increase. Both can happen at the same time.
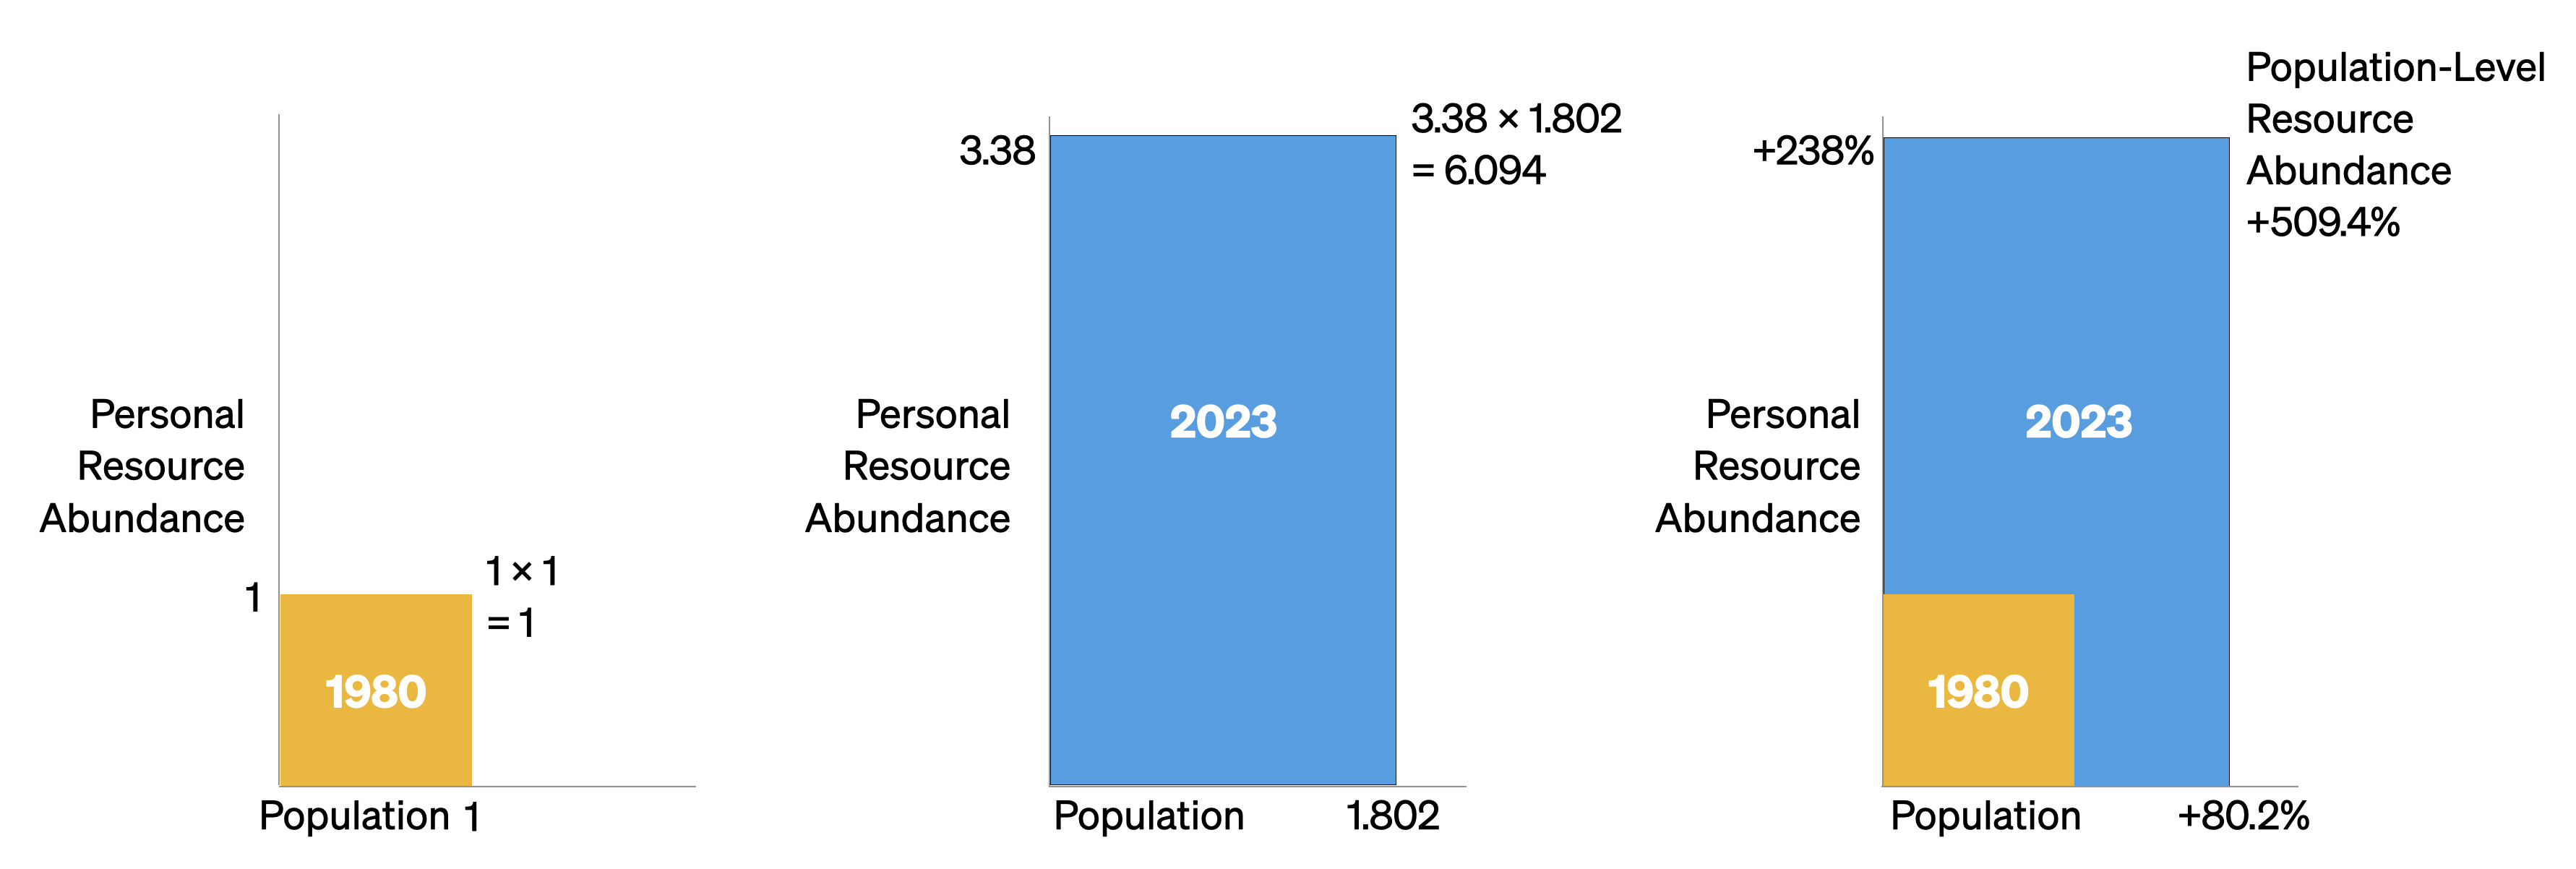
Growth in resource abundance can be illustrated by comparing two box charts. Create the first chart, representing the population on the horizontal axis and personal resource abundance on the vertical axis. Draw a yellow square to represent the start year of 1980. Index both population and personal resource abundance to a value of one. Then draw a second chart for the end year of 2023. Use blue to distinguish this second chart. Scale it horizontally for the growth in population and vertically for the growth in personal resource abundance from 1980. Finally, overlay the yellow start-year chart on the blue end-year chart to see the difference in resource abundance between 1980 and 2023.
Figure 2: Visualization of the Relationship between Global Population Growth and Personal Resource Abundance of the 50 Basic Commodities (1980–2023)
Between 1980 and 2023, the average time price of the 50 basic commodities fell by 70.4 percent. For the time required to earn the money to buy one unit of this commodity basket in 1980, you would get 3.38 units in 2023. Consequently, the height of the vertical personal resource abundance axis in the blue box has risen to 3.38. Moreover, during this 43-year period, the world’s population grew by 3.6 billion, from 4.4 billion to over 8 billion, indicating an 80.2 percent increase. As such, the width of the blue box on the horizontal axis has expanded to 1.802. The size of the blue box, therefore, has grown to 3.38 by 1.802, or 6.094 (see the middle box in Figure 2).
As the box on the right shows, personal resource abundance grew by 238 percent; the population grew by 80.2 percent. The yellow start box has a size of 1.0, while the blue end box has a size of 6.094. That represents a 509.4 percent increase in population-level resource abundance. Population-level resource abundance grew at a compound annual rate of 4.3 percent over this 43-year period. Also note that every 1-percentage-point increase in population corresponded to a 6.35-percentage-point increase in population-level resource abundance (509.4 ÷ 80.2 = 6.35).
Individual Commodity Changes: 1980–2023
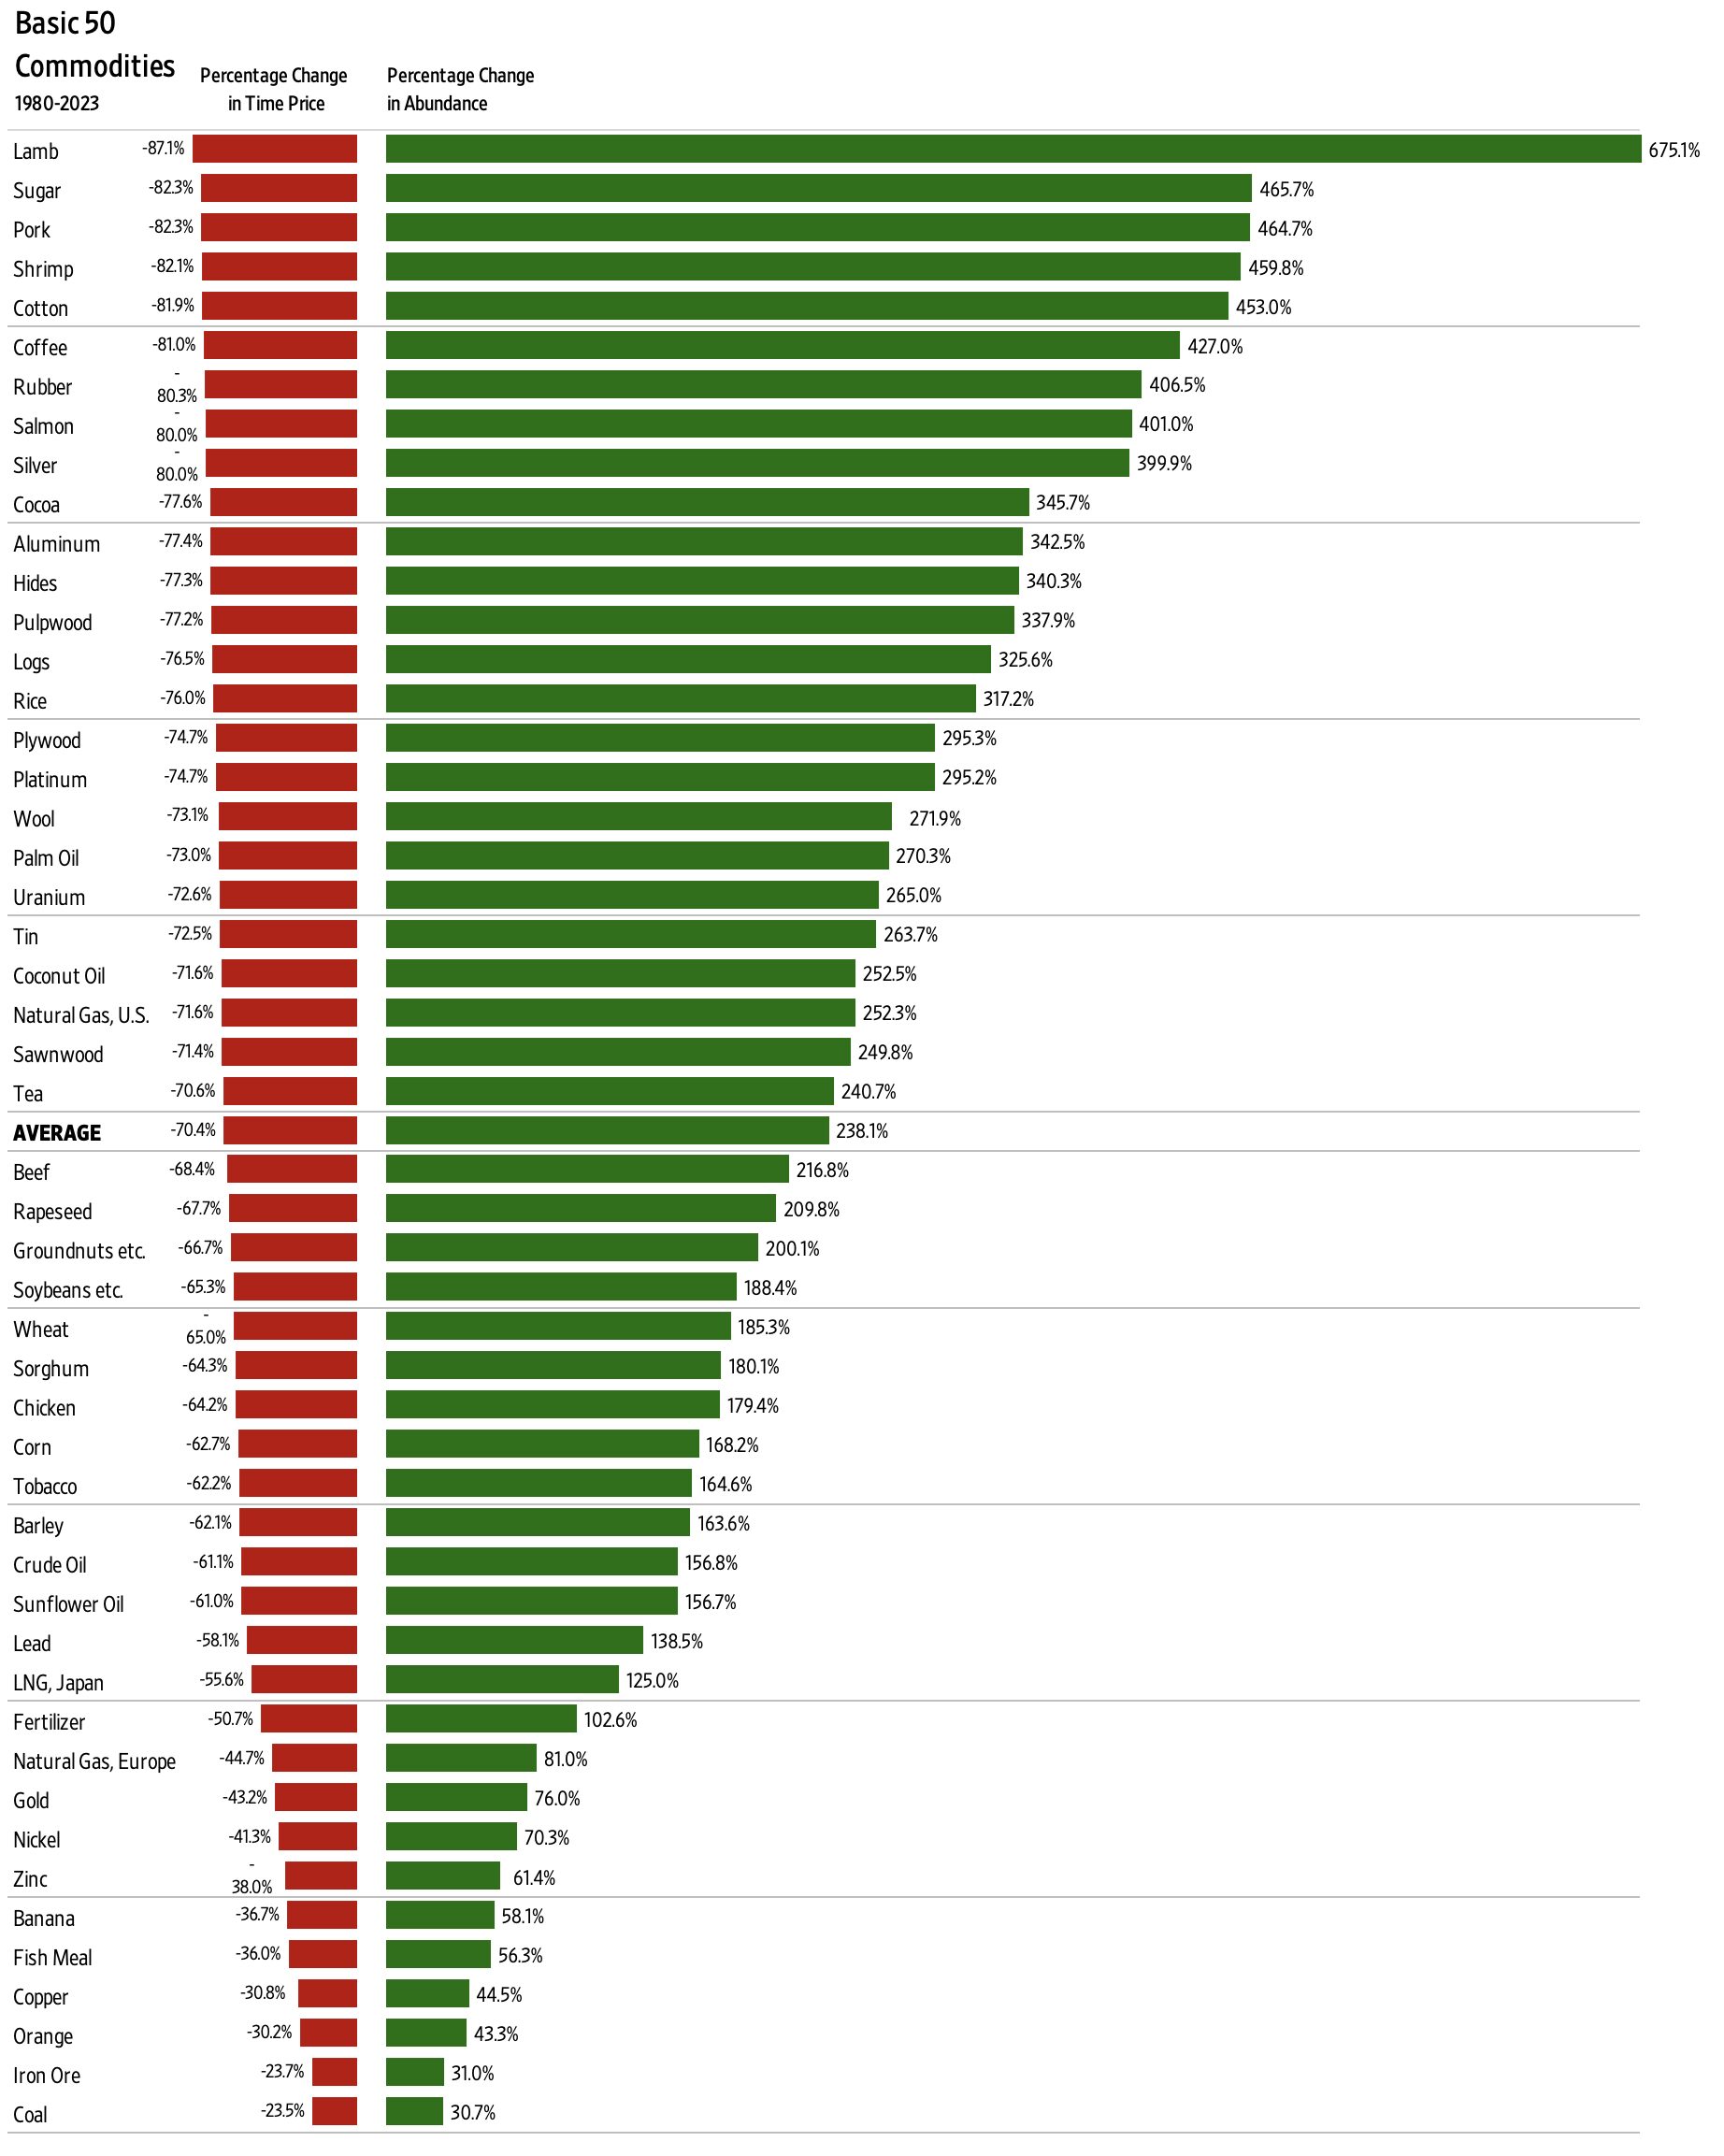
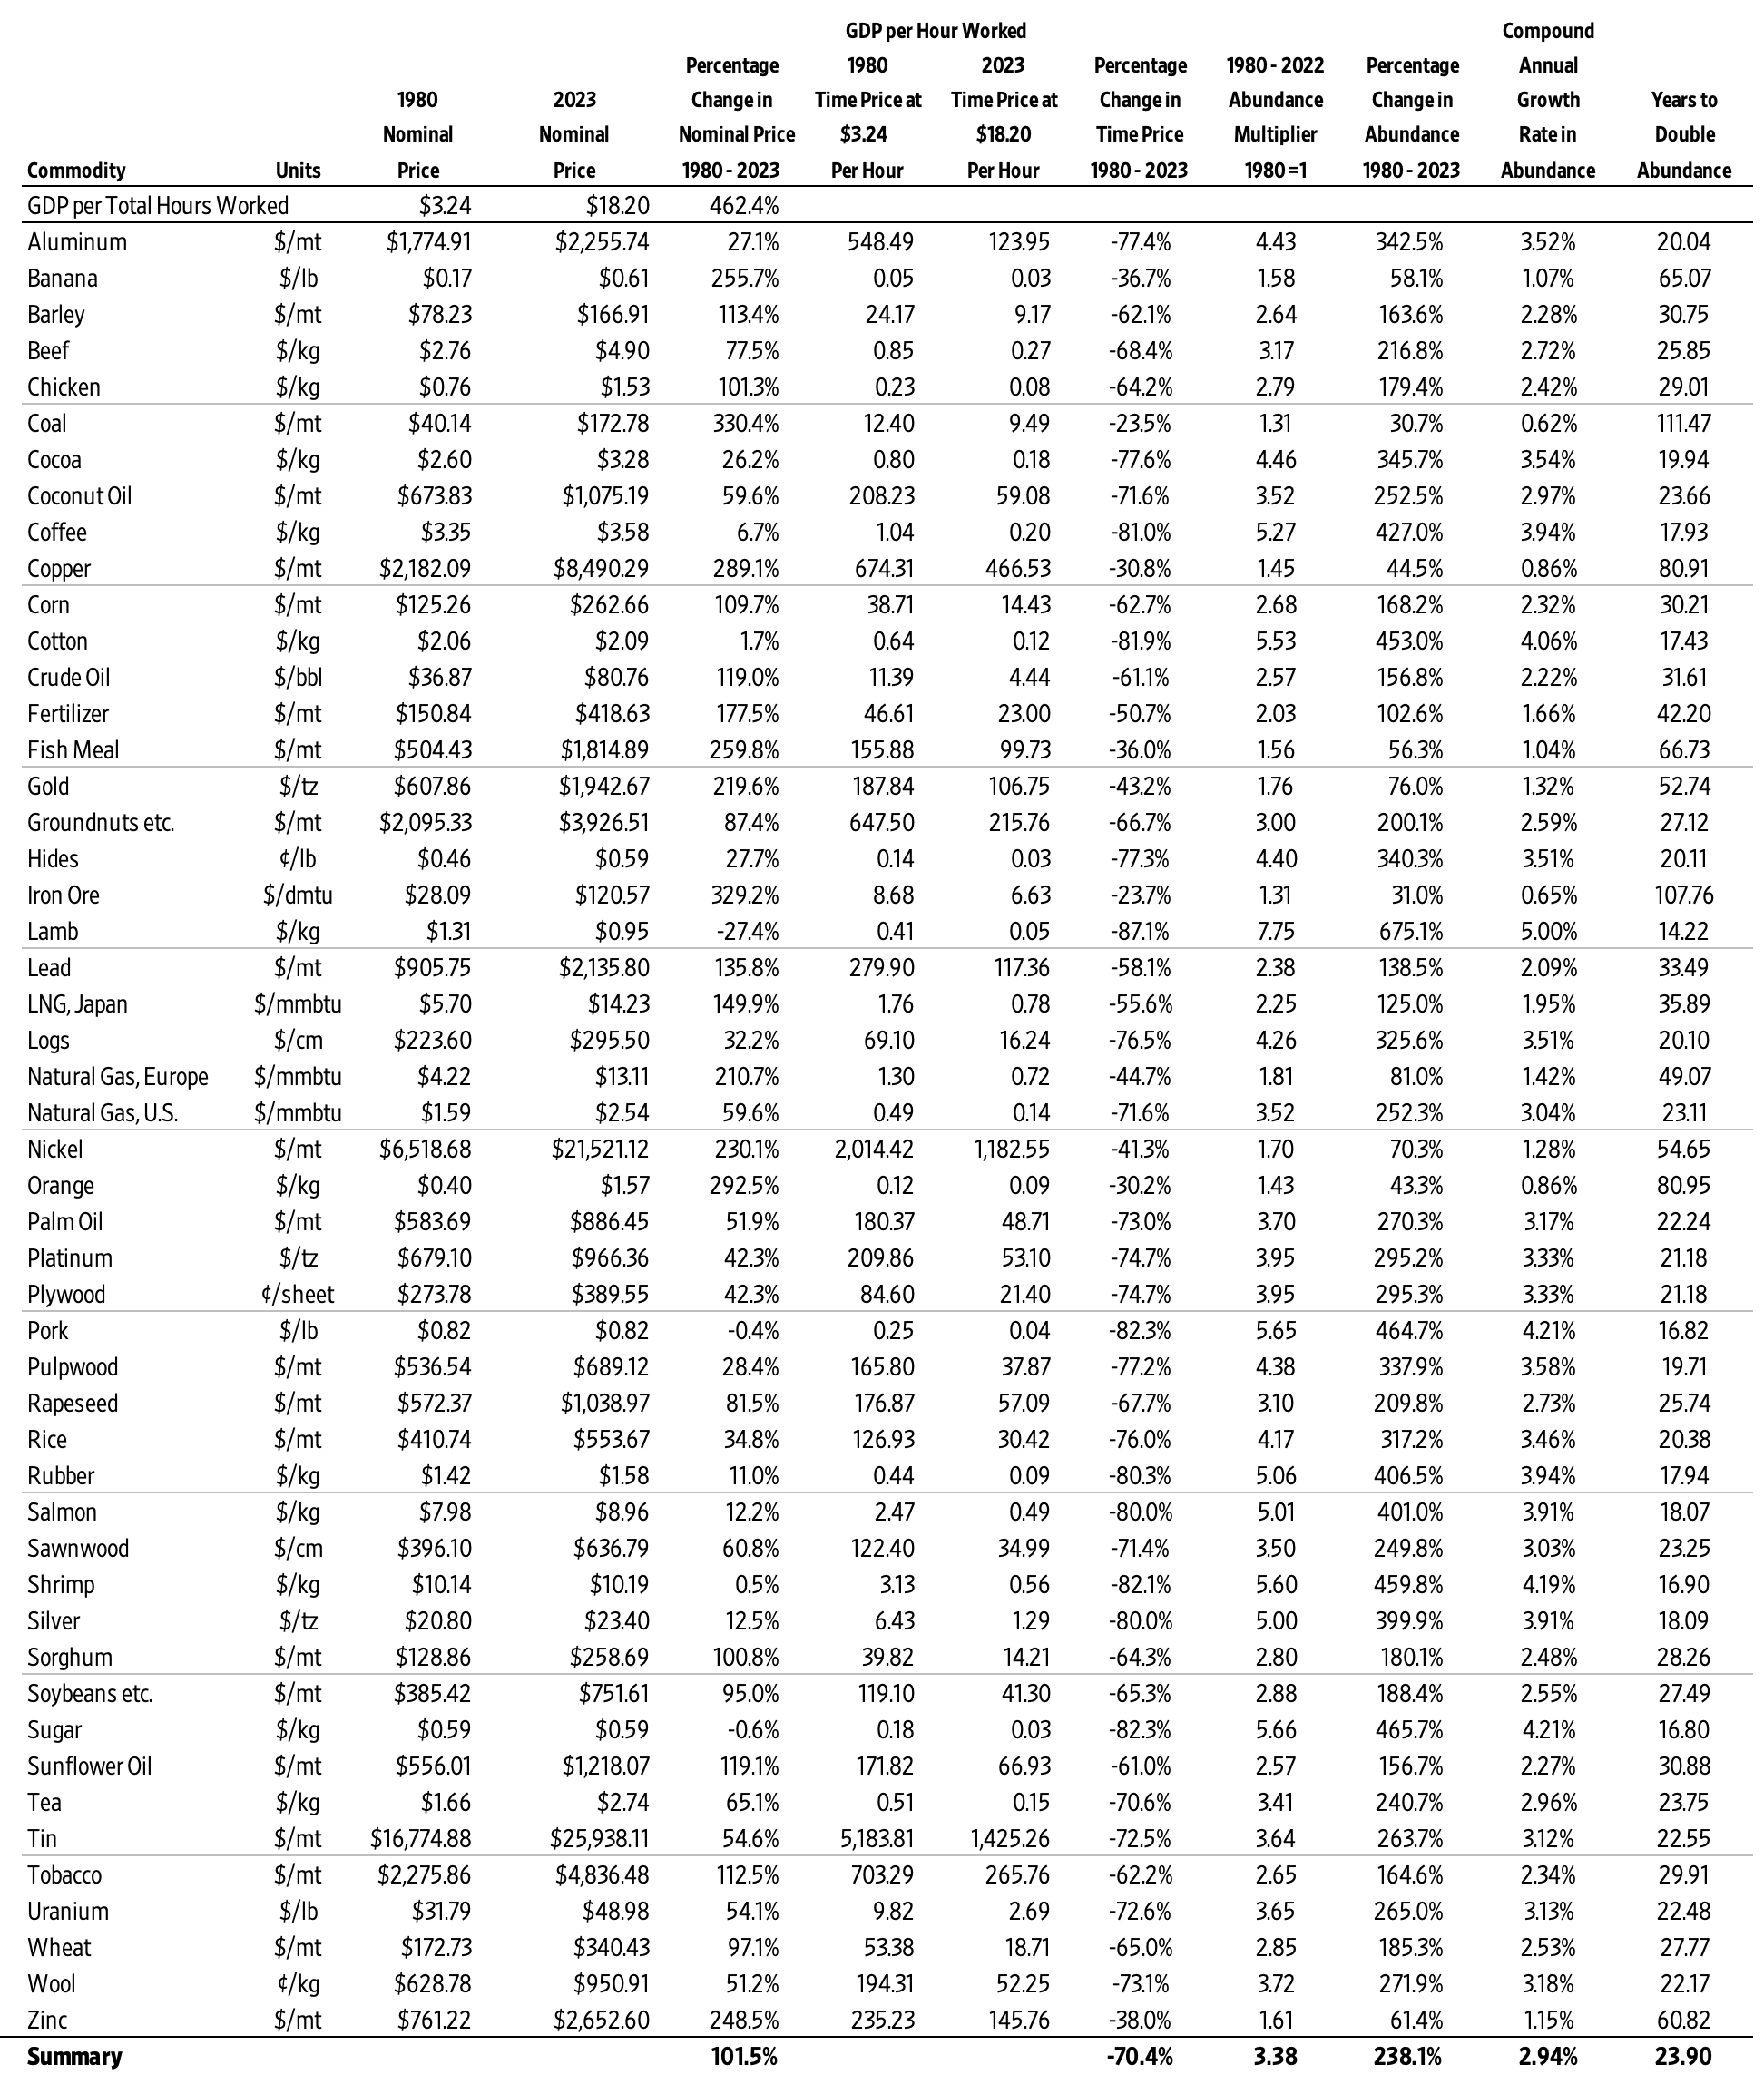
As noted, the average time price of the 50 basic commodities fell by 70.4 percent between 1980 and 2023. As such, the 50 commodities became 238.1 percent more abundant (on average). Lamb grew most abundant (675.1 percent), while the abundance of coal grew the least (30.7 percent).
Figure 3: Individual Commodities, Percentage Change in Time Price and Percentage Change in Abundance: 1980–2023
Individual Commodity Changes: 2022–2023
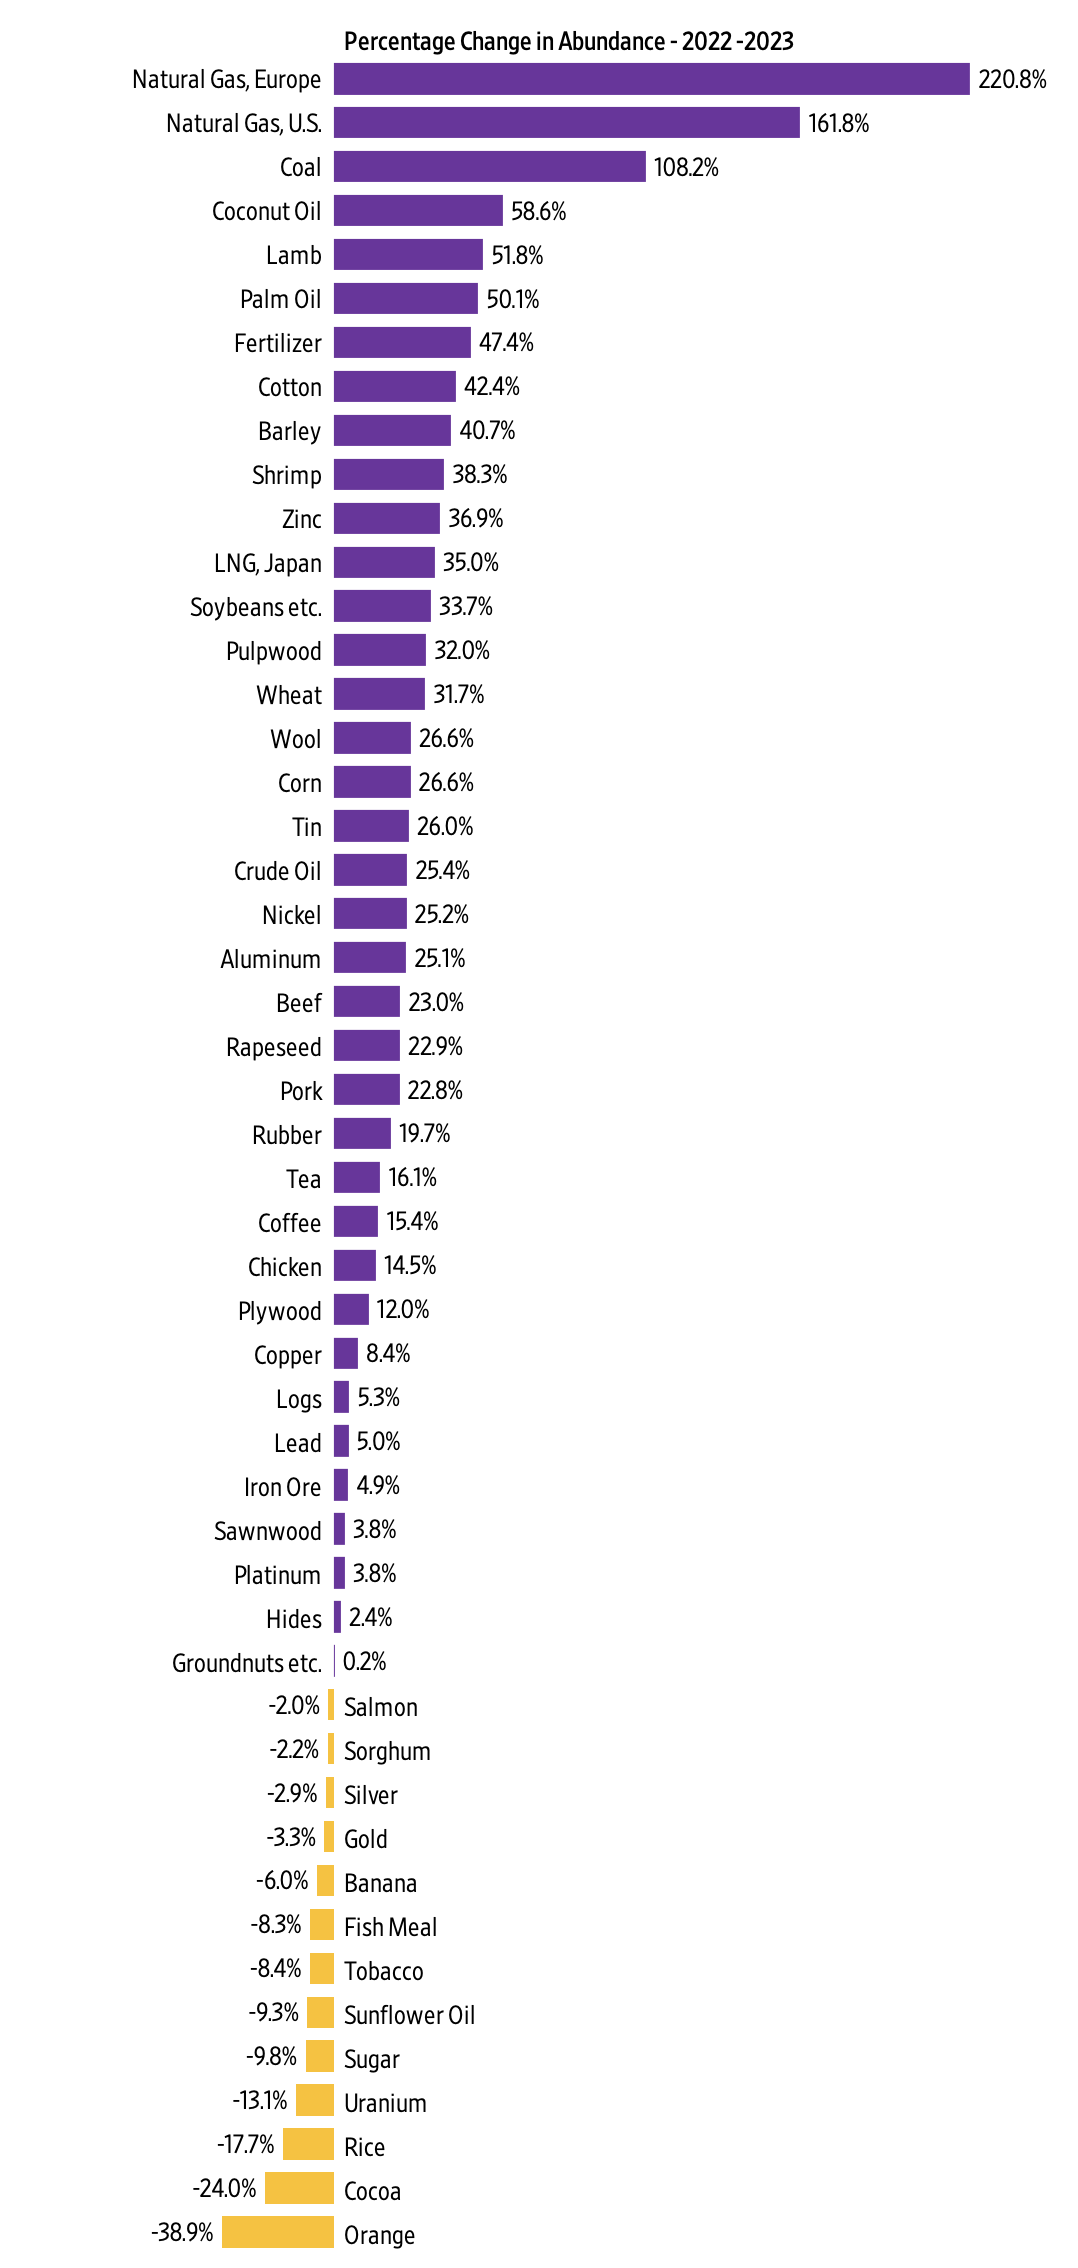
The SAI increased from a value of 520.1 in 2022 to 609.4 in 2023, indicating a 17.1 percent increase. Over those 12 months, 37 of the 50 commodities in the data set increased in abundance, while 13 decreased in abundance. Abundance ranged from a 220.8 percent increase for natural gas in Europe to a 38.9 percent decrease for oranges.
Figure 4: Individual Commodities, Percentage Change in Abundance: 2022–2023
Conclusion
After a sharp downturn between 2021 and 2022, which was caused by the COVID-19 pandemic, government lockdowns and accompanying monetary expansion, and the Russian invasion of Ukraine, the SAI is making a strong recovery. As noted, since 1980 resource abundance has been increasing at a much faster rate than population. We call that relationship superabundance. We explore this topic in our book Superabundance: The Story of Population Growth, Innovation, and Human Flourishing on an Infinitely Bountiful Planet.
Appendix A: Alternative Figure 1 with a Regression Line, Equation, R-Square, and Population
Appendix B: The Basic 50 Commodities Analysis: 1980–2023
Appendix C: Why Time Is Better Than Money for Measuring Resource Abundance
To better understand changes in our standard of living, we must move from thinking in quantities to thinking in prices. While the quantities of a resource are important, economists think in prices. This is because prices contain more information than quantities. Prices indicate if a product is becoming more or less abundant.
But prices can be distorted by inflation. Economists attempt to adjust for inflation by converting a current or nominal price into a real or constant price. This process can be subjective and contentious, however. To overcome such problems, we use time prices. What is most important to consider is how much time it takes to earn the money to buy a product. A time price is simply the nominal money price divided by the nominal hourly income. Money prices are expressed in dollars and cents, while time prices are expressed in hours and minutes. There are six reasons time is a better way than money to measure prices.
First, time prices contain more information than money prices do. Since innovation lowers prices and increases wages, time prices more fully capture the benefits of valuable new knowledge and the growth in human capital. To just look at prices without also looking at wages tells only half the story. Time prices make it easier to see the whole picture.
Second, time prices transcend the complications associated with converting nominal prices to real prices. Time prices avoid subjective and disputed adjustments such as the Consumer Price Index (CPI), the GDP Deflator or Implicit Price Deflator (IPD), the Personal Consumption Expenditures price index (PCE), and the Purchasing Power Parity (PPP). Time prices use the nominal price and the nominal hourly income at each point in time, so inflation adjustments are not necessary.
Third, time prices can be calculated on any product with any currency at any time and in any place. This means you can compare the time price of bread in France in 1850 to the time price of bread in New York in 2023. Analysts are also free to select from a variety of hourly income rates to use as the denominator when calculating time prices.
Fourth, time is an objective and universal constant. As the American economist George Gilder has noted, the International System of Units (SI) has established seven key metrics, of which six are bounded in one way or another by the passage of time. As the only irreversible element in the universe, with directionality imparted by thermodynamic entropy, time is the ultimate frame of reference for almost all measured values.
Fifth, time cannot be inflated or counterfeited. It is both fixed and continuous.
Sixth, we have perfect equality of time with exactly 24 hours in a day. As such, we should be comparing time inequality, not income inequality. When we measure differences in time inequality instead of income inequality, we get an even more positive view of the global standards of living.
These six reasons make using time prices superior to using money prices for measuring resource abundance. Time prices are elegant, intuitive, and simple. They are the true prices we pay for the things we buy.
The World Bank and the International Monetary Fund (IMF) track and report nominal prices on a wide variety of basic commodities. Analysts can use any hourly wage rate series as the denominator to calculate the time price. For the SAI, we created a proxy for global hourly income by using data from the World Bank and the Conference Board to calculate nominal GDP per hour worked.
With this data, we calculated the time prices for all 50 of the basic commodities for each year and then compared the change in time prices over time. If time prices are decreasing, personal resource abundance is increasing. For example, if a resource’s time price decreases by 50 percent, then for the same amount of time you get twice as much, or 100 percent more. The abundance of that resource has doubled. Or, to use the pizza analogy, an individual slice is twice as large. If the population increases by 25 percent over the same period, there will be 25 percent more slices. The pizza pie will thus be 150 percent larger [(2.0 x 1.25) – 1].