fbpx
01 / 05
Life Expectancy Up Around the World

Blog Post | Health & Medical Care

Life Expectancy Up Around the World

Great strides have been made since the 1960s

At Human Progress, we have recently updated our global life expectancy data for the period between 1960 and 2015. And it is, by and large, a happy story. First, contrast the image of the map of the world in 1960 with that in 2015. The whole world has gotten significantly darker, signifying increasing lifespans—they increased from 42 years to 68 years—across the globe.

Even the world’s poorest regions have experienced significant improvements in life expectancy. South Asia, for example, comprises Afghanistan, India, Pakistan, Bangladesh, Sri Lanka, Nepal, Bhutan and Maldives, and is home to 1.8 billion people. The region saw its life expectancy skyrocket by an extraordinary 26.5 years, or 63 percent. The world average, in contrast, rose “only” by 19.12 years, or 37 percent.

Sub-Saharan Africa, unfortunately, had suffered a serious blow in the 1990s, due to the largely unchecked spread of HIV/AIDS. Thankfully, the region appears to be on the mend, in large part because of the growing availability of cheap antiretroviral drugs. In 1960, a typical resident of sub-Saharan Africa had a life expectancy of 40.2 years. That rose to 59 years in 2015—an appreciation of 47 percent.

What about the United States? In recent months, we have heard much about the increase in death rates among American middle-aged whites. This is a disturbing development that bears watching, but the overall trend in the United States continues to be positive—even when compared with such star performers as the Scandinavian countries. While our life expectancy trails Scandinavia, American gains have been greater. Between 1960 and 2015, life expectancy rose by 12.71 percent, 11.32 percent and 11.02 percent in Sweden, Denmark and Norway respectively. In the United States, it rose by 13.45 percent.

Life expectancy is one of the best indicators of the overall state of humanity, for it reflects the interplay of rising incomes, material abundance and medical breakthroughs as well as declining violence. Happily, the data shows that contrary to the dire predictions of doomsayers, like Thomas Malthus, Rachel Carson, and Paul Ehrlich, humanity continues to flourish.

This piece was first published in Reason. 

Blog Post | Health & Medical Care

Rising U.S. Life Expectancy Reflected in 2020 Candidates

2020's septuagenarian presidential candidates reflect the broader demographic trend of Americans living longer, healthier lives and remaining active for many more years.

Every remaining major candidate vying to become a nominee for the U.S. presidency is a septuagenarian. While the aged field of candidates comes with its own set of concerns, it is a sign of the country’s progress toward keeping people alive and healthy for longer than ever before.

In the race for the highest office in the land, the so-called Silent Generation is making itself heard. Senator Bernie Sanders (D-VT), the oldest candidate, is 78 years old, as is former New York mayor Mike Bloomberg, who dropped out of the race this morning. Former vice president Joe Biden is 77 years old. President Donald Trump is 73 years old. At 70 years old, Senator Elizabeth Warren (D-MA) is the youngest of the major candidates. She was born in mid-1949.

Several major candidates have birthdays coming up before the Election Day. By November 3rd, Senator Sanders will be 79, President Trump will be 74 and Senator Warren will be 71 years old. Biden will turn 78 shortly after the election, on November 20th.

When the current President was sworn into office at the age of 70, he was the oldest president ever inaugurated in the United States. It looks like he or whoever assumes the presidency in 2021 will beat that record.

Even among the minor candidates still in the race, septuagenarians are represented. Former Massachusetts Governor Bill Weld, who is challenging the president for the Republican nomination in a protest campaign, is 74 years old. Congresswoman Tulsi Gabbard (D-HI), who is polling at less than 2 percent nationally, is the only remaining candidate born after 1950. She is 38.

When the septuagenarian candidates were born, the polio vaccine was yet to be created, there were no commercial computers, no human being had yet been to outer space and interracial marriage was still illegal in several U.S. states.

In 1950, U.S. life expectancy stood at 68.2 years, according to the U.S. Center for Disease Control and Prevention (CDC). The U.S. life expectancy has soared since then and a temporary dip over the last couple of years due to the opioid epidemic has since reversed. The CDC’s most recent figures estimate that the U.S. life expectancy reached 78.7 years in 2018 – an increase of 0.1 year from 2017. That means that just within the lifetime of Senator Warren, the youngest major candidate, U.S. life expectancy has expanded by over a decade.

“Healthy life expectancy” or the number of years one can expect to enjoy good health, has also increased significantly. An American can expect to enjoy around 68 and a half years of good health, on average, according to the World Health Organization’s most recent estimate, for 2016.

The actuarial tables suggest that whichever septuagenarian wins in November, he or she will likely survive the next four years. Based on the average for their age, that’s a 76.8 percent chance for Sanders; 79.2 percent for Biden; 84.8 percent for Trump and, reflecting that women tend to outlive men, a 91.8 percent chance for the relatively youthful Warren. Still, there is no doubt that the vice presidential candidates will matter more than usual this election cycle.

The country’s Founding Fathers likely could not have imagined a future with such remarkable longevity. The overwhelmingly septuagenarian field of major candidates has sparked concerns over the state of the various candidates’ health and mental acuity. While those worries should be taken seriously, the fact that so many septuagenarians are running reflects the broader demographic trend of Americans living longer, healthier lives and remaining active for many more years—a fact that should be celebrated.

Blog Post | Overall Mortality

China Ended Its One-Child Policy, but Abuses Remain

While the human rights abuses alone are reason enough to oppose family size limits, the premise that overpopulation is a problem at all is incorrect.

The abortion debate has intensified following a series of new abortion restrictions in a number of U.S. states. One thing that both those on the “pro-choice” and the “pro-life” side can agree on is that forced abortion disregards women’s choices and constitutes a human rights violation. What many people may not realize is that forced abortions are, deplorably, still taking place in China under the two-child policy. Worst of all, the rationale behind these abuses—fear of overpopulation—is fundamentally misguided.

In 2015, China ended its “one-child policy,” which restricted families to a single child, and has since adopted a “two-child policy,” but coercion still occurs.

The U.S. State Department’s Country Reports on Human Rights Practices for 2018 found that “coerced abortions and sterilizations” continue to take place under China’s revised Population and Family Planning Law. The 2018 report relates that forced abortions were carried out in the provinces of Hubei, Hunan, and Liaoning, among others, and it also found that forced abortion protocols remained on the books in the provinces of Guizhou and Yunnan.

“A third baby is not allowed so we are renting a home away from our village. The local government carries out pregnancy examinations every three months. If we weren’t in hiding, they would have forced us to have an abortion,” a Chinese father of three told the BBC.

In response to the question, “If they had come for your wife, to carry out this forced abortion, would it have been possible to resist? Could you have refused?” the father answered, “No we cannot resist. There would be many family planning officers to take us away. They would put us in a van, directly to the family planning office, for the abortion.”

Ethnic and religious minorities are often the targets of forced abortions. The Chinese government brutally discriminates against the minorities in China’s westernmost region, Xinjiang. This area has a large population of minority ethnic groups such as Uyghurs and Kazakhs, who practice Islam, which conflicts with the Communist Party’s state atheism. Even many people who have heard of the persecution of these groups may not realize that many women belonging to them are forced to have abortions against their will.

Prejudice against minorities motivates some of the forced abortions in China under the two-child policy, but far from all of them. The coercive policy also affects many members of the majority ethnicity. For example, the Wall Street Journal reported that in 2018 a high school teacher with two children, surnamed Sun, in Hebei province, aborted her pregnancy after being threatened with job dismissal and a fine. The fine for an illegal birth can reach ten times the mother’s annual disposable income.

What motivates these human rights abuses? Overpopulation alarmism.

The Chinese government began coercively limiting family size in response to misguided overpopulation fears that became popular among Chinese officials in the 1970s, when the central arguments behind the Club of Rome’s report, “The Limits to Growth,” were translated into Chinese. The book warned, incorrectly, that population growth would deplete resources and lead to a “collapse” of society.

Hence in 1979, China imposed the infamous policy that restricted each family to one child, to try to limit population growth and prevent resource scarcity, and to this day restricts families to two children.

What the Chinese government does not realize is that a growing population does not necessarily bring about scarcity. On the contrary, new research shows that population growth goes hand-in-hand with more abundant resources.

Consider the amount of time it takes an average person to earn enough money to buy one unit in a basket of 50 basic commodities—the “time-price” of those items, so to speak. The Simon Abundance Index found that between 1980 and 2017, the time-price “declined by 0.934 percent for every one percent increase in population. That means that every additional human being born on our planet seems to make resources proportionately more plentiful for the rest of us.”

Moreover, economic development causes birth rates to fall without draconian population control measures. It is now well-documented that as countries grow richer, and people escape poverty, they opt for smaller families. That phenomenon is called the fertility transition.

In 1979, the year the one-child policy began, China’s birth rate was just under three children per woman. China’s economy has grown dramatically since it adopted policies of greater economic freedom in 1978, and as the country has grown richer, its fertility rate has fallen. The decline has been perfectly in line with trends in neighboring countries that have also seen rapid economic growth, and that do not coercively limit family sizes.

South Korea, where the fertility rate was very similar (and in fact slightly higher than China’s) in 1979, has seen an even steeper decline since then and today has fewer births per woman than China. So too does Hong Kong, an autonomous region of China where families are free to have as many children as they choose.

While the human rights abuses alone are reason enough to oppose family size limits, the premise that “overpopulation” is a problem at all is incorrect. China’s two-child policy is not only inhumane, but pointless.

This piece first appeared in The Hill. 

Blog Post | Health & Medical Care

Things Are Looking Up by Any Measure

Rising income is only one way to measure the improving state of humanity. Let's not forget the other indicators.

In a recent piece for CapX, my colleague Chelsea Follett wrote about the declining rates of absolute poverty. This data is, indeed, encouraging, but rising income is only one way to measure the improving state of humanity –  let’s not forget the other indicators.

Because when it comes to nutrition, life expectancy, infant and child mortality rates, and education, great progress is being made throughout the world. That is especially true of poor countries. In sub-Saharan Africa, absolute improvements in human well-being are taking place, while the quality-of-life gap with the rest of the world is also being narrowed.

According to the latest data, the share of humanity living on less than $1.90 per person per day, adjusted for purchasing power, shrunk from 42.2 per cent in 1981 to 10.7 percent in 2013 (the last year for which data is available). That’s a reduction of 75 per cent over a comparatively short period of 32 years. According to researchers at the Brookings Institution, “Poverty reduction of this magnitude is unparalleled in history: never before have so many people been lifted out of poverty over such a brief period of time.”

This fall in extreme poverty is all the more remarkable considering that the world’s population rose by 59 per cent over the same time period. Far from being a problem, as was once believed, this growing population has gone hand in hand with increased prosperity. Specialisation and trade, or globalisation, ensured that an increase in the world’s population translated to an increase in the world’s productivity. As such, real average per capita income also rose by 59 per cent between 1981 and 2013.

The greatest reduction in extreme poverty happened in East Asia (from 81 per cent to 3.7 per cent) and South Asia (from 55 per cent to 15 per cent). The data for sub-Saharan Africa is incomplete. In 1990, it is estimated, 54 per cent of people lived there in absolute poverty. Poverty peaked at 59 per cent in 1993. Since then, it has fallen to 41 per cent. So, in terms of absolute poverty reduction, sub-Saharan Africa is a laggard. But, on other measures of human well-being, sub-Saharan Africa outperforms the world average.

The world’s daily calorific intake per person, for example, has increased from an average of 2,550 in 1981 to 2,850 in 2013 – a 12 per cent increase. In sub-Saharan Africa, the caloric intake increased from 2,138 to 2,448 over the same time period. That’s a 15 per cent increase. To put these figures in perspective, the US Department of Agriculture recommends that moderately active adult men consume between 2,200 and 2,800 calories a day and moderately active women consume between 1,800 and 2,000 calories a day.

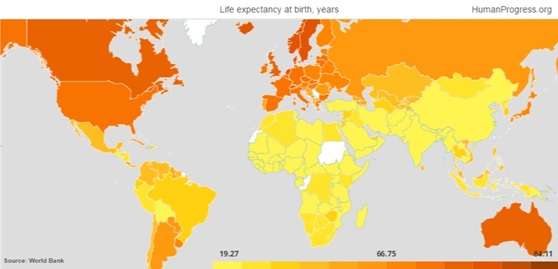
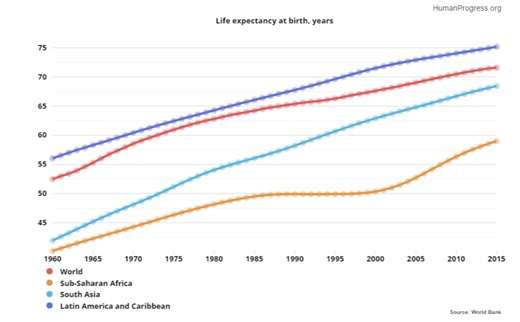
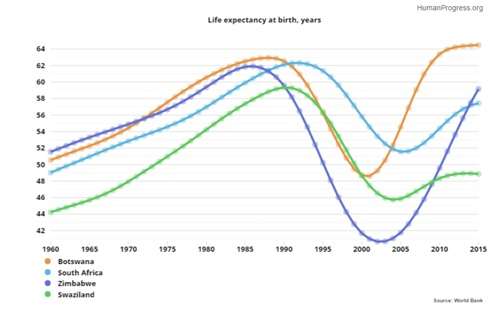
Between 1981 and 2015, global life expectancy rose from 63.2 years to 71.9 years – a remarkable 12 per cent jump that is, undoubtedly, connected to rising incomes and, consequently, improved nutrition. In sub-Saharan Africa, life expectancy rose from 48.5 years to 59.9 years. That’s a 24 per cent improvement (ie, twice the global average). The spread of HIV/AIDS, which threatened to decimate the African population, has been arrested in large part due to the generosity of British and American taxpayers, who subsidise the distribution of anti-retroviral drugs in sub-Saharan Africa.

Let’s now turn to the United Nations’ Millennium Development Goals, which measure human progress over a shorter period of time. According to the UN, the infant mortality rate dropped from 64.8 per 1,000 live births in 1990 to 30.5 in 2016. That’s a 53 per cent reduction. In sub-Saharan Africa, it fell from 108 to 53 – a 51 per cent reduction. Over the same time period, the mortality rate for children under five years of age declined from 93.4 per 1,000 to 40.8 per 1,000. That’s a reduction of 56 per cent. But in sub-Saharan Africa, the decline was even more dramatic – from 180 per 1,000 to 78 per 1,000 (ie, 57 per cent).

Enrolment at all education levels is up. Globally, the primary school completion rate rose from 80 per cent in 1981 to 90 per cent in 2015 – a 13 per cent improvement. In sub-Saharan Africa it rose from 55 per cent to 69 per cent over the same time period – a 26 per cent improvement (ie, twice the global average).

The lower secondary school completion rate in the world rose from 53 per cent in 1986 to 77 per cent in 2015 – that’s a 42 per cent increase. In sub-Saharan Africa it rose from 22 per cent to 42 per cent – a 91 per cent improvement (ie, more than twice the global average).

Between 1981 and 2014, the share of the global and sub-Saharan African population enrolled in tertiary educational institutions rose from 13 per cent and 2 per cent to 36 per cent and 9 per cent respectively. Once again, improvement in sub-Saharan Africa was greater (350 per cent ) than was the case with regard to the global average (177 per cent).

October 17 was the International Day for the Eradication of Poverty. And, indeed, there was much to celebrate. Absolute poverty has been drastically reduced in much of the developing world. But even in places where absolute poverty persists at unacceptable levels, such as sub-Saharan Africa, much progress is being made in other areas of human well-being. In fact, the world’s poorest region is catching up with the world average at a very fast pace.

This first appeared in Capx. 

Blog Post | Wealth & Poverty

Middle Class Shrinks as High Income Households Multiply

The next time you hear someone bemoan the "shrinking middle class," take a closer look at the data.

The day before yesterday, the Washington Post ran a piece with the alarming headline, “The middle class is shrinking just about everywhere in America.” Although you wouldn’t know it from the first few paragraphs, a shrinking middle class isn’t necessarily a bad thing. As HumanProgress.org Advisory Board member Mark Perry has pointed out, America’s middle class is disappearing primarily because people are moving into higher income groups, not falling into poverty.

label 

Data from the U.S. Census Bureau shows that after adjusting for inflation, households with an annual income of $100,000 or more rose from a mere 8% of households in 1967 to a quarter of households in 2014.

According to the Pew Research Center, 11% fewer Americans were middle class in 2015 than in 1971, because 7% moved into higher income groups and 4% moved into lower income groups. The share of Americans in the upper middle and highest income tiers rose from 14% in 1971 to 21% in 2015.

One has to read fairly far into the Washington Post’s coverage before seeing any mention of the fact that a shrinking middle class can mean growing incomes:

“[In many] places, the shrinking middle class is actually a sign of economic gains, as more people who were once middle class have joined the ranks at the top. [For example, in] the Washington, D.C. metropolitan area, the share of adults living in lower-income households has actually held steady [from 2000 to 2014]. The households disappearing from the middle-class, rather, are reflected in the growing numbers at the top.”

Other cities with a shrinking middle class, a growing upper class and very little change in the lower class include New York, San Francisco and New Orleans. So the next time you hear someone bemoan the “shrinking middle class,” take a closer look at the data and keep in mind that it may actually be a sign of growing prosperity.

The first appeared in Cato at Liberty.