fbpx
01 / 05
Introducing the Simon Abundance Index

Blog Post | Economic Growth

Introducing the Simon Abundance Index

New study from Human Progress finds that every additional human being born appears to make resources proportionally more plentiful.

Colorful umbrella. Simon Abundance Index

Marian Tupy, editor of Human Progress, and Professor Gale Pooley from Brigham Young University – Hawaii have used 37 years’ worth of data for 50 foundational commodities covering energy, food, materials, and metals to develop a new framework to measure resource availability. The authors contend that instead of making resources scarcer, population growth has gone hand in hand with greater resource abundance.

The report builds on the famous wager between biologist Paul Ehrlich and economist and Julian Simon on the effect of population growth on the Earth’s resources. While Ehrlich warned that population growth could deplete resources and lead to global catastrophe, Simon saw humans as the “ultimate resource” who could innovate their way out of such shortages. The Ehrlich-Simon wager tracked the real price of a basket of five raw materials between 1980 and 1990, finding as Simon hypothesized, that all measured commodities decreased in price by an average of 57.6 percent, despite a population increase of 873 million.

Tupy and Pooley expand on Simon’s original insight by increasing the basket to 50 commodities and analyzing a longer time period; between 1980 and 2017. Over this time, they find the real price of their basket of commodities decreased by 36.3 percent.

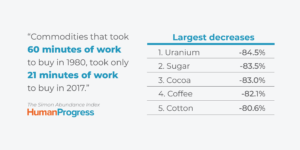
They also introduce a new measure termed “time-price,” the time that an average human must work in order to earn enough money to buy a particular commodity. They find the time-price of their basket of 50 commodities has fallen by 64.7 percent. Put differently, commodities that took 60 minutes of work to buy in 1980 took only 21 minutes of work to purchase in 2017. Should the current trend continue, commodities could become 50 percent cheaper every 26 years.

In addition, the authors develop the concept of price elasticity of population (PEP), which allows them to estimate the effect of population growth on the availability of resources. Over the time period studied the population grew from 4.46 billion to 7.55 billion, a 69.3 percent increase. The PEP indicates that the time-price of the basket of commodities declined by 0.934 percent for every 1 percent of increase in population. Every additional human being born on our planet appears to make resources proportionally more plentiful for the rest of us.

Using the PEP values the authors form the Simon Abundance Framework, which describes progression from decreasing abundance at the one end to increasing abundance at the other end. The authors conclude that humanity is experiencing superabundance with the time-price commodities decreasing at a faster proportional rate than the population is increasing.

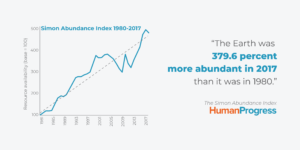
Finally, the authors produce the Simon Abundance Index (SAI) that represents the ratio of the change in population over the change in the time-price. Between 1980 and 2017, resource availability increased at a compounded annual growth rate of 4.32 percent, meaning Earth was 379.6 percent more abundant in 2017 than it was in 1980. 

Tupy and Pooley forecast that the time-price of commodities could fall a further 29 percent over the next 37 years as humanity continues to make resources more plentiful through greater efficiency of use, increased supply, and the development of cheaper substitutes. They caution, however, that for this trend to continue market incentives and the price mechanism must endure.

“The world is a closed system in the way that a piano is a closed system. The instrument has only 88 notes, but those notes can be played in a nearly infinite variety of ways. The same applies to our planet,” write Tupy and Pooley. “The Earth’s atoms may be fixed, but the possible combinations of those atoms are infinite. What matters, then, is not the physical limits of our planet, but human freedom to experiment and reimagine the use of resources that we have.”

Read the new Policy AnalysisThe Simon Abundance Index: A New Way to Measure Availability of Resources

Blog Post | Cost of Material Goods

The Rise of Contact Lens Abundance

Get almost 16 today for the time price of one in 1971.

Summary: Since the introduction of the first US commercial soft contact lenses, significant advancements have made them more accessible and affordable. This progress in abundance, driven by continuous innovation, underscores the importance of fostering an environment conducive to scientific and entrepreneurial advancements for the prosperity of society.


In 1971, Bausch & Lomb manufactured the first US commercial soft contact lenses. An eye doctor fitting ran around $550, and a pair of contact lenses cost $65, putting total costs around $615. Unskilled workers at the time earned about $2 an hour. This means the time price was about 307.5 hours.

Today an eye exam is about $120, and lenses start at $200 for a 12-month supply, putting the cost at $320. Unskilled workers now earn about $16.51 an hour, indicating a time price of 19.4 hours.

Unskilled workers can now get 15.9 sets of contact lenses for the time price of one set in 1971. Abundance has been growing at a compound annual rate of 5.35 percent, doubling in abundance every 13.3 years.

Today an estimated 45 million Americans wear contact lenses, of which 30 million are women. Imagine if the manufacturers of eyeglasses had used government regulation and coercion to prevent the innovation of contact lenses?

The more we make of something, the more we learn. The more we learn, the lower the price. The lower the price, the higher our standard of living. This truth was described by Adam Smith in 1776 in The Wealth of Nations.

And what is wealth? As George Gilder notes, “Wealth is knowledge and growth is learning.” The nation that is best at growing new knowledge will enjoy the greatest wealth. Artificial intelligence offers the hope that this learning process can be dramatically enhanced.

We can thank the continuous innovations of scientists and entrepreneurs in developing new contact lens designs and manufacturing techniques. America’s comparative advantage has been its visionary leadership in encouraging everyone in discovering and creating valuable new knowledge that can be shared in free markets. We cannot allow fear to blind us to these truths and prevent a future of innovation and greater prosperity.

This article was published at Gale Winds on 3/12/2024.

Blog Post | Cost of Material Goods

The Good Old Days Were Really Expensive

Most things are more abundant and affordable today.

If you had a dime in 1900, you could buy a 1-ounce Hershey chocolate bar and a 6.5-ounce bottle of Coca-Cola. It sounds like those were happy days indeed. That is until you look at wages, which were around 14 cents an hour for blue-collar workers.

At Walmart today, a 1.55-ounce Hershey bar costs $1.17 and a 1.25-liter bottle (42.27 ounces) of Coke is $1.52. Blue-collar workers earn closer to $36.15 an hour in compensation.

We buy things with money but pay for them with our time. Money prices are expressed in dollars and cents, while time prices are expressed in hours and minutes. A time price is simply the money price divided by hourly income.

In 1900, it took more than 21.4 minutes to earn an ounce of chocolate and 3.3 minutes for an ounce of Coca-Cola. By 2023, the chocolate time price had fallen to 1.25 minutes, and sodas were down to 0.06 minutes (3.58 seconds).

Chocolate cost fell 94.2 percent while cola cost fell 98.2 percent. For the time required to earn 1 ounce of chocolate in 1900, you get 17.1 ounces today, and for the time required to earn 1 ounce of Coca-Cola in 1900, you get 55.2 ounces today. Chocolate is 1,611 percent more abundant while cola is 5,425 percent more abundant.

Things can get more expensive and more affordable at the same time. This is why you must always compare prices to wages to see the true price, which is how much time things cost you.

This article was published at Gale Winds on 3/19/2024.

Blog Post | Energy Prices

Where Is Gasoline the Most Affordable?

Remember that it’s the time price, not the money price, that counts.

Summary: The affordability of gasoline varies significantly worldwide due to varying taxes and subsidies. Analyzing the GDP per hour worked against the money price per gallon shows that the United States emerges as the most affordable country for purchasing gasoline, even compared to nations where gasoline prices are heavily subsidized by the government.


According to GlobalPetrolPrices.com, the average price of gasoline around the world is USD5.03 per gallon. However, there is substantial difference in these prices among countries due to the various taxes and subsidies for gasoline. All countries have access to the same petroleum prices of international markets, but countries do not all impose the same taxes. As a result, the retail price of gasoline varies significantly.

Graph displays the gasoline price per gallon in US dollars in various countries

The money price of 16 selected countries ranges from $2.26 in Russia to $8.55 in Denmark. But what about the time price? To calculate the time price, we first calculated the GDP per hour worked in each country. The data to calculate this ratio come from the World Bank and the Conference Board.

Graph displays the GDP per hour worked in various countries

We then divided GDP per hour worked by the money price per gallon. This gave us the gallons of gasoline that one hour of work would buy in each country:

Graph displays the gallons of gasoline per GDP per hour worked in various countries

We also divided the nominal price per gallon by GDP per hour worked to get the minutes required per gallon:

This chart illustrates how much more expensive relative to the US the other 15 countries are in terms of time price:

Chart displays the cost in time price of gasoline in 15 countries

Of the 16 countries analyzed, the US is by far the most affordable place to buy gasoline. There are other countries where gasoline is more affordable, but the gasoline price in those countries is heavily subsidized by government.

Tip of the Hat: Jeremy Horpendahl

This article was published at Gale Winds on 4/1/2024.

Blog Post | Air Transport

Flying Abundance (And Safety) Has Increased Dramatically

Get 10.8 flights from New York to London today for the time price of one in 1970 and be 80.4 times safer.

Summary: Since the Wright brothers’ pioneering flight in 1903, the aviation industry has made remarkable strides in safety, affordability, and accessibility. Comparing flight prices from 1970 to today reveals a staggering 90.8 percent decrease in the time price of flying, with transcontinental flights now affordable for the average person. Additionally, advancements in aviation technology have made flying dramatically safer today than it was in 1970, and are likely to improve flying safety in the future.


The Wright brothers launched the era of aviation on December 17, 1903, with a 12-second flight. Since then, aeronautical engineers and market innovators have made the experience safer, faster, and much more affordable.

For example, in 1970 the price for a roundtrip ticket from New York to London was $550. Blue-collar workers at the time were earning around $3.93 an hour in compensation (wages and benefits). This suggests a time price of around 140 hours.

Today, the ticket price has dropped to around $467. Blue-collar workers are now earning closer to $36.15 an hour, putting the time price at 12.9 hours. The time price has fallen by 90.8 percent: for the time required to earn the money to buy one flight in 1970, you can get 10.8 flights today.

Flying abundance has increased by 980 percent, compounding at an annual rate of 4.5 percent over the last 54 years. During this same period the global population increased by 4.3 billion (117 percent), from 3.7 billion to more than 8 billion. Every 1 percentage point increase in population corresponded to an 8.4 percentage point increase in flying abundance.

Now transcontinental flights are affordable for almost everyone. Free-market entrepreneurial capitalism isn’t about making more luxuries for the wealthy, it’s about making luxuries affordable for the average person.

While it is true that the 1970s flights may have had roomier cabins and better dining, flying today is dramatically safer. The Aviation Safety Network tracks airline accident data. Revenue passenger kilometer (RPK) is a standard metric used in aviation. Using this data, Javier Mediavilla plotted the ratio of fatalities per trillion RPK from 1970 to 2019 using five-year averages. The ratio decreased by 98.76 percent, from 3,218 to 40, during this 49-year range. Flying is more than 80.4 times safer today than in 1970, and safety has been improving at a compound rate of around 9.37 percent a year.

Considering both the time price and safety, flying has become 868 times more abundant since 1970 (10.8 x 80.4 = 868). If there had been no innovation in flying since 1970,  New York to London airfare would be around $5,059 today. Only the rich could afford transatlantic flights in 1970.

The 3,442-mile flight takes around seven hours. The supersonic Concorde could fly it in less than three. While there are no commercial supersonic flights available today, Boom Supersonic, a private company based in Colorado, aims to bring them back to US airlines by 2029. Perhaps spending half as much time on flights will allow people to use their most valuable resource for other value-creating activities.

This article was published at Gale Winds on 3/26/2024.