We are excited to share a new tool we’ve been building at Human Progress: The American Abundance Index—an interactive dashboard that tracks US living standards while adjusting for both inflation and rising incomes.
The idea is straightforward: how many hours do you need to work to afford the same basket of goods and services? Using Bureau of Labor Statistics data, the American Abundance Index converts price and wage growth into “time prices”—the amount of work time required to buy the Consumer Price Index (CPI) basket of goods and services—and “abundance,” which is the inverse: how much of that basket one hour of work can buy. When time prices fall, abundance rises, and each hour of work goes further. That’s the measure of affordability that actually matters.
Conceptually, this work builds off of Superabundance, a book by our editor, Marian Tupy, and his coauthor and Human Progress board member, Gale Pooley. Their core argument—that abundance is best measured in time—forms the foundation of the project. The index itself was built by our Quantitative Research Associate, Jackson Vann.
Users can select multiple worker categories, compare short- and long-run trends, and even see wage growth modeled to reflect real career progression rather than freezing workers in place. All the calculations are transparent and replicable, with the full dataset and code available on GitHub.
So what does the index actually say about American standards of living?
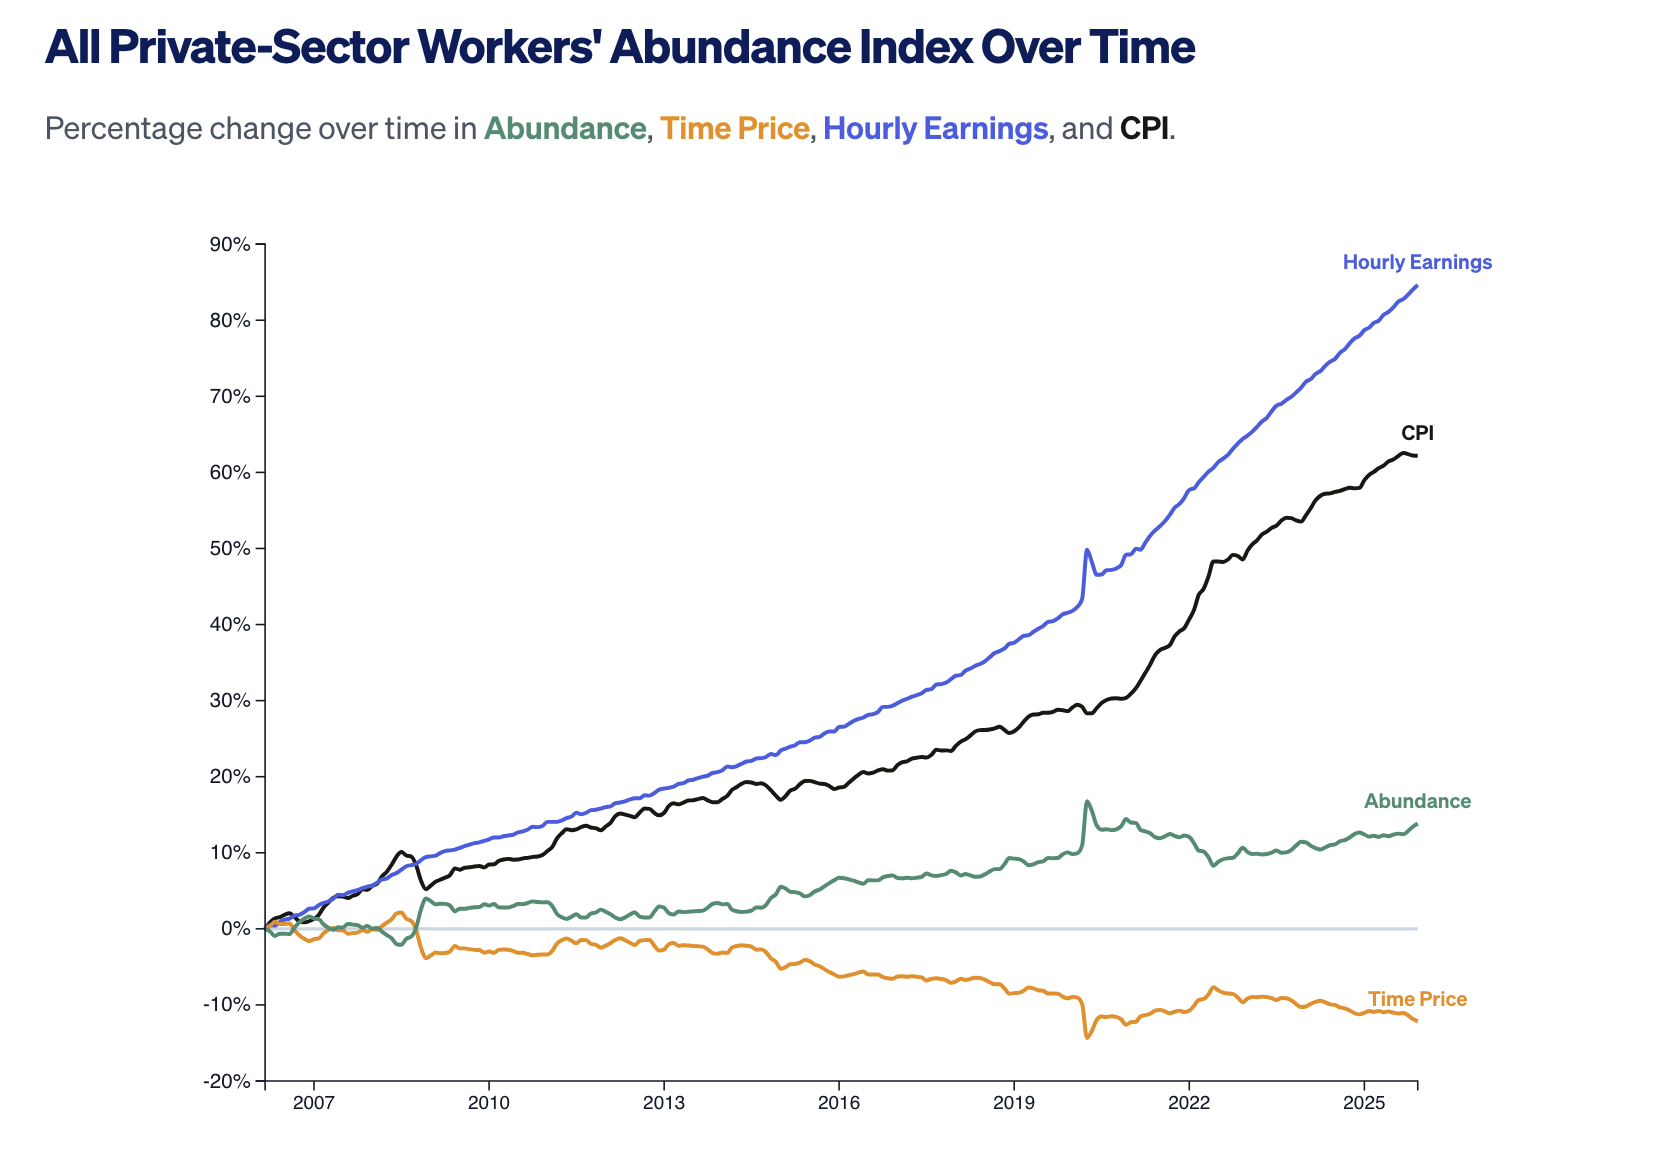
Over the past 12 months, inflation rose 2.68 percent while hourly earnings for the average private-sector worker grew 3.76 percent. As a result, the CPI basket became 1.05 percent more abundant. Since 2006, it has become nearly 14 percent more abundant—roughly equivalent to adding an hour of purchasing power to the average workday.