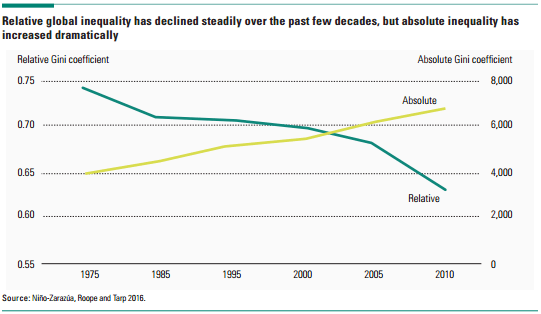
The United Nations has just released a new report on international development, titled “Development for Everyone”. It focuses on equality, distinguishing between absolute inequality and relative inequality. It points out that in terms of the Gini coefficient, a statistical measure used to gauge a country’s income inequality, one kind of inequality is rising while the other is falling:
“Rising incomes around the world have been accompanied by widening inequality … Although income inequality … has narrowed across the world as a whole because the incomes of developing and developed regions have been converging. Relative global inequality has declined steadily over the past few decades … This happened despite an increasing trend towards inequality within countries.
By contrast, absolute inequality, measured by the absolute Gini coefficient, has increased dramatically. [For example, in] 2000 one person in a country earns $1 a day and another person $10 a day. With economic growth, in 2016 the first person earns $8 a day, and the second person $80 a day. The relative difference between the two remains the same (the second person has 10 times more than the first person), but the absolute difference has gone up from $7 to $72.”
(Source: United Nations, 2016 Human Development Report: Development for Everyone)
Even though the difference between absolute and relative inequality is increasing, the key thing to take away is that the tremendous growth in developing countries has decreased relative inequality between states and diminished poverty. And, arguably, reducing deprivation and raising living standards are more important than lessening income inequality.
So why the focus on money? In many other vital areas inequality is declining across the globe. Here are five charts which pin-point where.
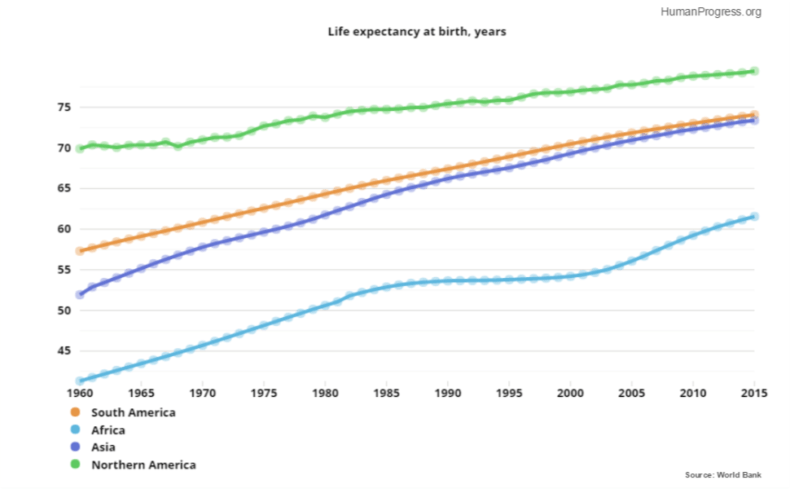
Life expectancy is one of the best measures of the overall standard of living. Even for Africa, the poorest continent, the life expectancy gap with North America has narrowed. North American life expectancies were about 29 years longer than Africans’ in 1960, but only 18 years longer in 2015. This progress occurred despite the catastrophic AIDS epidemic that slowed Africa’s life expectancy significantly. Asia and South America have gone even farther towards closing the life expectancy gap with North America, narrowing it to roughly 6 and 5 years, respectively.
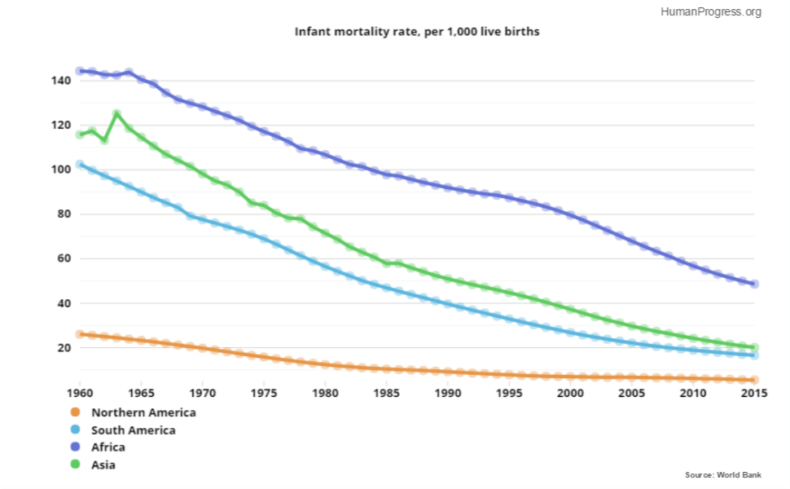
Life expectancy gains are partly due to falling rates of infant mortality—another area in which poor countries are catching up with rich ones. In 1960, 144 out of 1,000 African children died before their first birthday, compared to 26 out of 1,000 North American children. In other words, 118 more African children than North American children died as infants out of every 1,000. By 2015, that number had shrunk to 43.
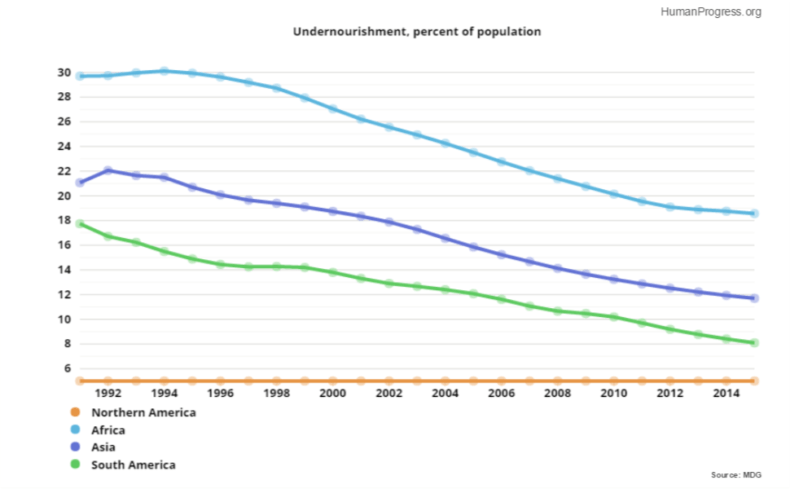
Better nourishment is also to thank for longer lives. In 1991, close to 30 per cent of Africa’s population was undernourished, compared with “5 per cent or less” of North America’s population. By 2015, fewer than 20 per cent of Africans were undernourished. The absolute inequality between the poorer areas of the globe and the richer ones shrank considerably, even as undernourishment became rarer worldwide.
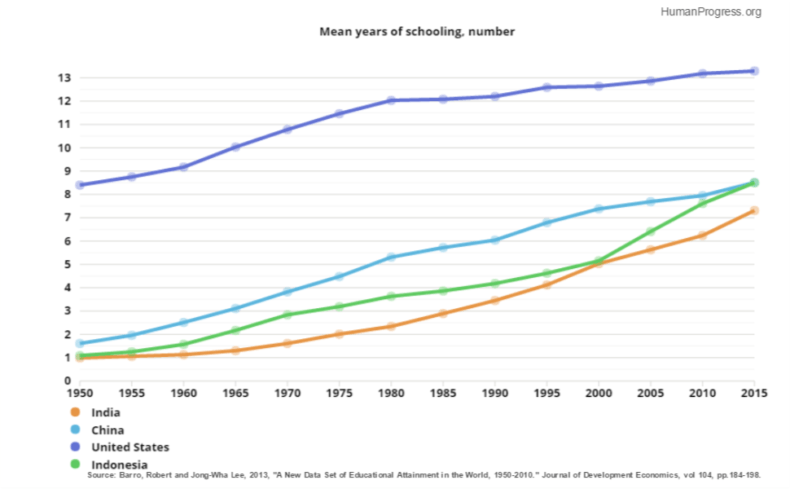
The education gap between rich and poor countries has diminished as well. In 1950, Americans spent nearly seven more years learning than Chinese students on average, and nearly eight more years leaning than Indians. By 2015, average years of schooling in the United States exceeded the Chinese average by only five years and the Indian average by about six years.
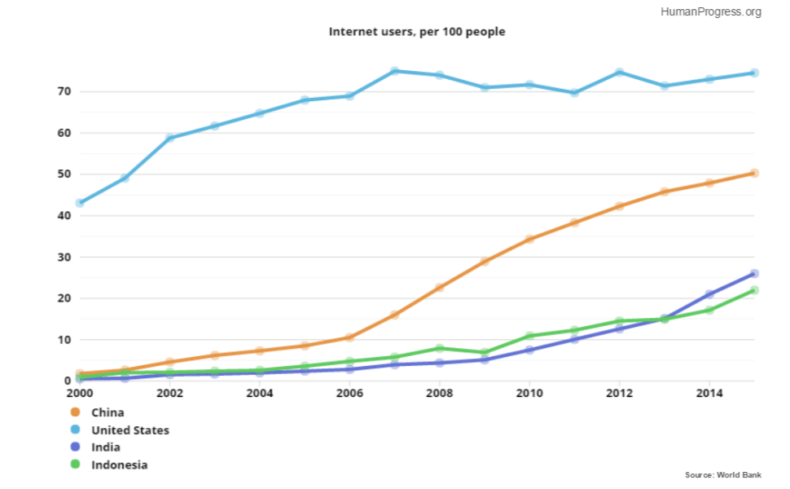
Internet use tells a similar story. China, in particular, has rapidly narrowed the gap. In 2000, a little under 2 per cent of Chinese used the internet, compared to 43 per cent of Americans. That means a gap of 41 per cent. By 2015, that gap had shrunk to 24 per cent.
As these charts show, poor countries are actually making faster progress than rich ones in many areas. In some cases, this is simply because richer countries have “reached the finish line” it’s impractical to school children past a certain number of years, for example, or levels of malnutrition might already be at zero.
In other cases, the rapid adoption of technologies and growth-friendly policies from a standing start is giving poorer countries a boost that enables them to progress at breakneck speed. Even bearing this in mind, why do some places develop more quickly than others? What explains the incredible pace of change in China, for example? The UN report nails it with this sentence:
In China and India, opening up the economy to the world accelerated growth, which in turn helped address human development challenges — reducing poverty, improving health outcomes and extending access to basic social services.
So rather than rush to complain about the increase in absolute inequality, we should stop and consider how globalisation and free exchange, though unpopular among those who think they only benefit the rich, are to thank for shrinking relative inequality and plummeting poverty across the world.
Poverty Declines in Georgia as Income Inequality Decreases in 2024
“The National Statistics Office recently published data revealing that Georgia saw a significant decline in poverty in 2024, with the national absolute poverty rate dropping to 9.4%, down 2.4 percentage points from the previous year.”
Wage Inequality Declined in Most Countries Since Start of 21st Century
“The Global Wage Report 2024-25 finds that since the early 2000’s, on average, wage inequality, which compares the wages of high and low wage earners, decreased in many countries at an average rate that ranged from 0.5 to 1.7 per cent annually, depending on the measure used. The most significant decreases occurred among low-income countries where the average annual decrease ranged from 3.2 to 9.6 per cent in the past two decades.
Wage inequality is declining at a slower pace in wealthier countries, shrinking annually between 0.3 and 1.3 per cent in upper-middle-income-countries, and between 0.3 to 0.7 per cent in high-income countries”
In some ways, this is perhaps a somewhat boring answer about facts, but that’s what makes it important; we have to get the facts straight. The numbers that people’s opinions are based on are not correct. There are various ways in which they aren’t, but two big ones.
The first is that when the US census measures income, it doesn’t count two-thirds of what are called transfer payments, or money that the government gives to people for not doing anything. In other words, a transfer payment is not what we pay civil servants or the military. Transfer payments are things like food stamps or Medicaid, which are also two examples of things that the census does not count. They also don’t count 88 percent of the transfer payments that go to people who are classified as poor. They don’t count Medicare for the senior population. They don’t count what is called Supplemental Security Income. They don’t count many state and local transfer payments to poor people. They count some housing subsidies, the so-called Section 8 subsidies, but they don’t count others.
When you add all the pieces up, two-thirds of the total amount of transfer payments aren’t counted. So that’s one big piece.
The other big piece is they don’t adjust for taxes. At the bottom end of the income scale, people pay about seven and a half percent of their income in taxes, mostly sales taxes and excise taxes. At the upper end of the income scale, people pay between 35 and 40 percent of their income in taxes, mostly income taxes. So, if you don’t adjust for those taxes, you end up with a very skewed view of the income distribution.
The census splits US households into five groups based on income. The bottom quintile has the least income, and the top quintile has the most. Using the official census definition of income, the ratio between the top and the bottom is 16.7 to 1, so the top quintile has 16.7 times more income than the bottom.
Now, the first thing we did was ask what income was missing. Well, the first thing we found that was missing was capital gains. Capital gains are not counted as income for reasons that aren’t clear. That, of course, is missing mostly from the top half of the income distribution. At the low end of the distribution, there’s all sorts of income misreporting. Not terribly large, but there is some, people just don’t report all their income. And in the middle, employer-paid benefits are missing. So, adding all that earned income data made the ratio between the top and bottom much bigger. The top quintile earns 60 times more income than the bottom quintile.
But we’re still missing two-thirds of the transfer payments. If we add all the transfer payments, the difference between the top and bottom drops to 5.7 to 1.
So that’s all the money coming in, but the census also ignores the money the government takes through taxes. If we compare after-tax income and after-transfer payment income, the difference drops to only 4 to 1.
So, we’ve gone from 16.7 to 1 to 4 to 1 after counting all the money. We didn’t have to redefine anything.
Let me hit a couple of other points here.
It’s not only that the difference between the top and the bottom became smaller after adding all the income data and accounting for taxes. The differences between the bottom, the next to the bottom, and the middle virtually disappear. The bottom 60 percent of Americans all have almost the same amount of income. Let me explain that a bit.
Income in the second quintile is only 8 percent larger than in the bottom quintile. And yet there are 2.8 times more people working in second quintile households. And when they work, they work 1.8 times more hours. They work nearly 40 hours, and people in the bottom quintile work less than 20. And in the middle quintile, there is 32 percent more income, but over three times more people are working, and they work more than twice as many hours. They put out a whole lot more effort and don’t get much more income.
Now, there’s another important wrinkle: adjusting households for size. Households in the bottom quintile tend to be single individuals, retired individuals, people who’ve just graduated from college, and so on. Households become larger as you go up the income scale. When you adjust for size, the bottom quintile actually receives 5 percent more income than the second quintile does. And only 7 percent less than the middle.
There’s also the issue of change over time. There’s something called the Gini coefficient. It’s a measure that’s set up so that at zero, you have perfect equality. Every household has the same income. And at 1, all the income is in one household. The census publishes this measure, and it has risen over the long term. When President Obama or Chuck Schumer says income inequality is awful and it’s getting worse, this is what they’re referring to. But they don’t count all the transfer payments, which have gone from being like 10 percent of our federal budget to 75 percent over time. If you count all the transfers and take away the taxes, the Gini coefficient has actually fallen.
There’s also the question of economic mobility. In a previous paper, you found that two-thirds of children reared in the lowest quintile at some point escape to a higher quintile as adults. I don’t think people realize just how economically mobile Americans are.
Your last point there is really important. Almost all income distribution data are a slice in time. So, the statement that “the poor are getting poorer and the rich are getting richer” is just wrong because these categories are not static: people who were poor ten years ago are rich today, and some previously rich folks have fallen into lower income levels. Now, there are studies that track the same people through time, and during one’s lifetime, you generally move up. Almost everyone’s income goes up, except for those who choose not to participate in the labor force. Although their income goes up too because we keep raising the transfer payments.
The same also applies to income groups. In 1967, the top quintile of households were those that made around $60,000 or more in 2017 dollars. The people in the bottom quintile made between zero and $15,000 in 2017 dollars. In 2017, 77 percent of the population was making incomes that would have placed them in the top quintile 50 years earlier. That’s inflation-adjusted. And fewer than 2 percent of the people in the bottom quintile in 2017 would have been in the bottom quintile 50 years ago. So, throughout the income distribution, we’re all a whole lot better off.
Now, are we better off than five years ago? Well, some of us are, and some of us aren’t, but the overwhelming majority of us are better off than our parents and grandparents were. Far better off.
What is another hopeful fact about the US economy right now that people may not be aware of?
If you measure it right, the share of Americans in poverty has dropped from about 14 percent back when the war on poverty began to 1.1 percent.
So, when Lyndon B. Johnson declared the war on poverty in 1964, the poverty rate had declined from over 30 percent in the 1940s and 50s to around 17 percent. Now, what happened after that? Well, poverty continued to decline at the same rate for another four or five years. Then, it stopped going down and started rising and falling with the business cycle.
Why do you suppose that happened?
Mismeasurement.
Exactly. We declared a war on poverty. We started giving people a lot of money, but we didn’t measure that money as income. And so, it bounced between 11 percent and 15 percent, back and forth, back and forth. It dropped below 11 percent last year, but it’s still in the same range. But if we count all the transfer payments, it’s only 2.5 percent. And if we correct for the CPI overstating inflation, poverty would be less than 2 percent.
So, poverty has virtually disappeared. The people in that 2 percent are people who are especially challenged, either mentally or physically, and they may need help. But most people who are called poor are simply getting lots of money from the government, and they’re not poor anymore.
Johnson had two objectives for the war on poverty. One was to alleviate the suffering of those who were poor, but the other was to enable them to become productive citizens. We completely failed at that one. Only one third of work-age adults in the bottom quintile have a job. Back when Johnson started the war on poverty, two-thirds of them did.
Why? The government’s paying them to do nothing. So, they do nothing.
Get John Early’s book, The Myth of American Inequality: How Government Biases Policy Debate, here.
John Early, a mathematical economist and adjunct scholar at the Cato Institute, joins Chelsea Follett to discuss popular misconceptions about inequality in the United States and the measurement errors behind them. To see the slides that accompany the interview, watch the video on YouTube or the Spotify app.