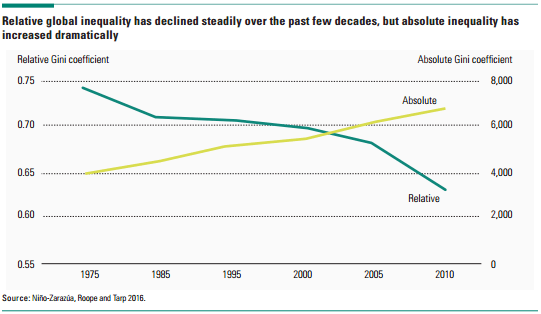
The United Nations has just released a new report on international development, titled “Development for Everyone”. It focuses on equality, distinguishing between absolute inequality and relative inequality. It points out that in terms of the Gini coefficient, a statistical measure used to gauge a country’s income inequality, one kind of inequality is rising while the other is falling:
“Rising incomes around the world have been accompanied by widening inequality … Although income inequality … has narrowed across the world as a whole because the incomes of developing and developed regions have been converging. Relative global inequality has declined steadily over the past few decades … This happened despite an increasing trend towards inequality within countries.
By contrast, absolute inequality, measured by the absolute Gini coefficient, has increased dramatically. [For example, in] 2000 one person in a country earns $1 a day and another person $10 a day. With economic growth, in 2016 the first person earns $8 a day, and the second person $80 a day. The relative difference between the two remains the same (the second person has 10 times more than the first person), but the absolute difference has gone up from $7 to $72.”
(Source: United Nations, 2016 Human Development Report: Development for Everyone)
Even though the difference between absolute and relative inequality is increasing, the key thing to take away is that the tremendous growth in developing countries has decreased relative inequality between states and diminished poverty. And, arguably, reducing deprivation and raising living standards are more important than lessening income inequality.
So why the focus on money? In many other vital areas inequality is declining across the globe. Here are five charts which pin-point where.
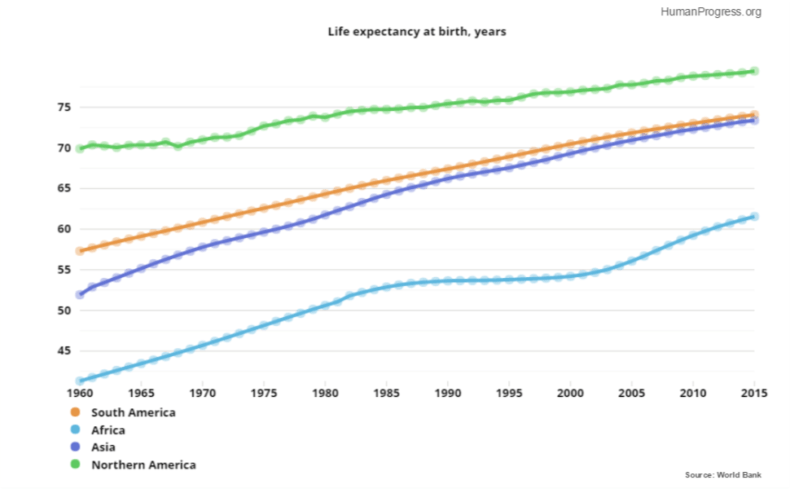
Life expectancy is one of the best measures of the overall standard of living. Even for Africa, the poorest continent, the life expectancy gap with North America has narrowed. North American life expectancies were about 29 years longer than Africans’ in 1960, but only 18 years longer in 2015. This progress occurred despite the catastrophic AIDS epidemic that slowed Africa’s life expectancy significantly. Asia and South America have gone even farther towards closing the life expectancy gap with North America, narrowing it to roughly 6 and 5 years, respectively.
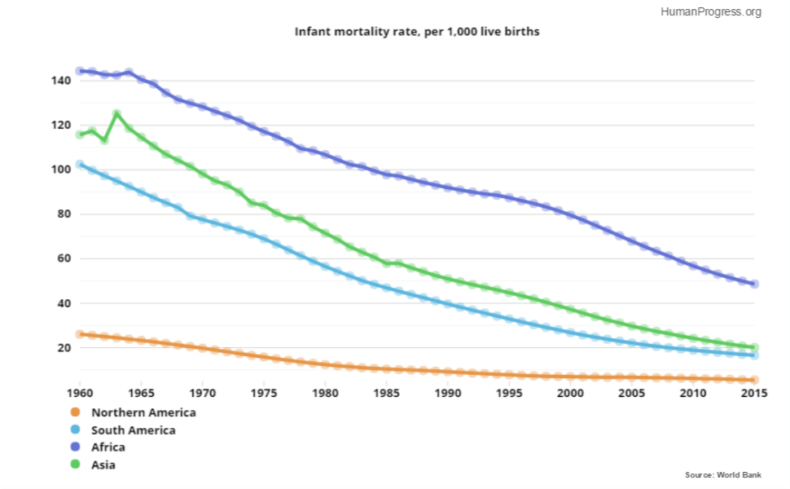
Life expectancy gains are partly due to falling rates of infant mortality—another area in which poor countries are catching up with rich ones. In 1960, 144 out of 1,000 African children died before their first birthday, compared to 26 out of 1,000 North American children. In other words, 118 more African children than North American children died as infants out of every 1,000. By 2015, that number had shrunk to 43.
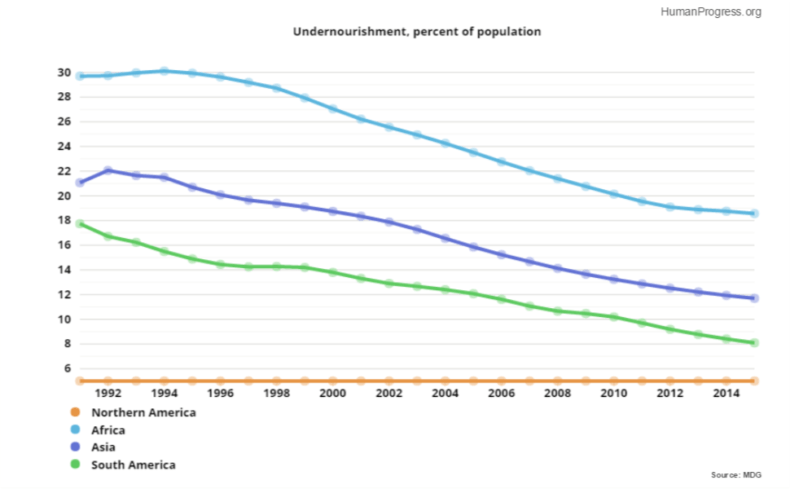
Better nourishment is also to thank for longer lives. In 1991, close to 30 per cent of Africa’s population was undernourished, compared with “5 per cent or less” of North America’s population. By 2015, fewer than 20 per cent of Africans were undernourished. The absolute inequality between the poorer areas of the globe and the richer ones shrank considerably, even as undernourishment became rarer worldwide.
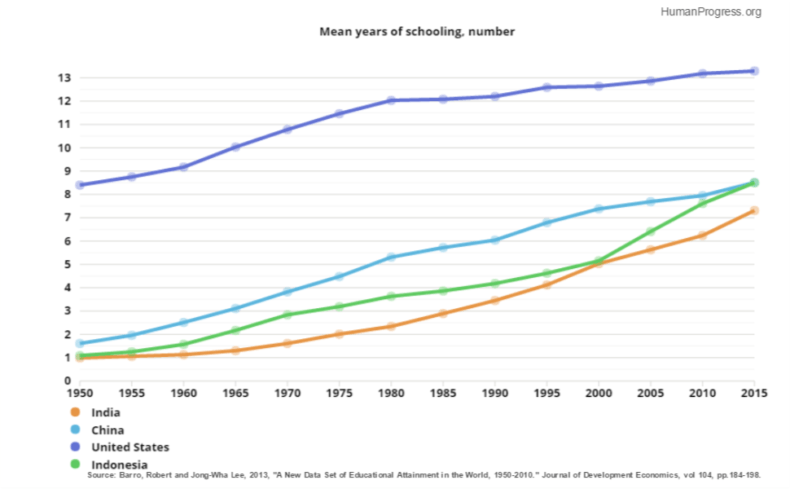
The education gap between rich and poor countries has diminished as well. In 1950, Americans spent nearly seven more years learning than Chinese students on average, and nearly eight more years leaning than Indians. By 2015, average years of schooling in the United States exceeded the Chinese average by only five years and the Indian average by about six years.
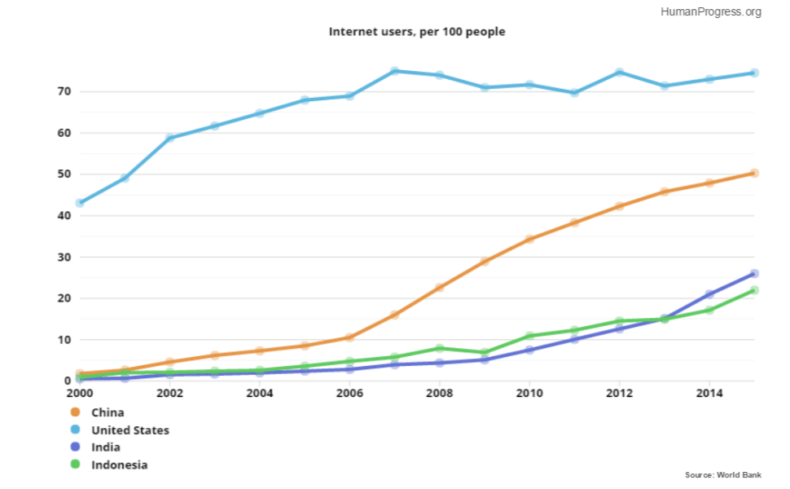
Internet use tells a similar story. China, in particular, has rapidly narrowed the gap. In 2000, a little under 2 per cent of Chinese used the internet, compared to 43 per cent of Americans. That means a gap of 41 per cent. By 2015, that gap had shrunk to 24 per cent.
As these charts show, poor countries are actually making faster progress than rich ones in many areas. In some cases, this is simply because richer countries have “reached the finish line” it’s impractical to school children past a certain number of years, for example, or levels of malnutrition might already be at zero.
In other cases, the rapid adoption of technologies and growth-friendly policies from a standing start is giving poorer countries a boost that enables them to progress at breakneck speed. Even bearing this in mind, why do some places develop more quickly than others? What explains the incredible pace of change in China, for example? The UN report nails it with this sentence:
In China and India, opening up the economy to the world accelerated growth, which in turn helped address human development challenges — reducing poverty, improving health outcomes and extending access to basic social services.
So rather than rush to complain about the increase in absolute inequality, we should stop and consider how globalisation and free exchange, though unpopular among those who think they only benefit the rich, are to thank for shrinking relative inequality and plummeting poverty across the world.
Developing Countries Have Seen Sustained Growth Since 1987
“Since the late 1980s, the classification of countries into income categories has transformed. The number of low-income countries has steadily declined, while the number of high-income countries has increased.
This shift reflects broader global economic developments, including sustained growth in many developing countries, greater integration into the global economy, and the effects of policy reforms and international organizations’ support. In 1987, 30% of reporting countries were classified as low-income and 25% as high-income countries. By 2024, these ratios shifted to 12% low-income and 40% high-income.”
Summary: For decades, experts assumed that rising prosperity inevitably led to falling birth rates, fueling concerns about population collapse in wealthy societies. But new data show that this link is weakening or even reversing, with many high-income countries now seeing higher fertility than some middle-income nations. As research reveals that wealth and fertility can rise together, policymakers have an opportunity to rethink outdated assumptions about tradeoffs between prosperity and demographic decline.
For years, it was treated as a demographic law: as countries grow wealthier, they have fewer children. Prosperity, it was believed, inevitably drove birth rates down. This assumption shaped countless forecasts about the future of the global population.
And in many wealthy countries, such as South Korea and Italy, very low fertility rates persist. But a growing body of research is challenging the idea that rising prosperity always suppresses fertility.
University of Pennsylvania economist Jesús Fernández-Villaverde recently observed that middle-income countries are now experiencing lower total fertility rates than many advanced economies ever have. His latest work shows that Thailand and Colombia each have fertility rates around 1.0 births per woman, which is even lower than rates in well-known low-fertility advanced economies such as Japan, Spain and Italy.
“My conjecture is that by 2060 or so, we might see rich economies as a group with higher [total fertility rates] than emerging economies,” Fernández-Villaverde predicts.
This changing relationship between prosperity and fertility is already apparent in Europe. For many years, wealthier European countries tended to have lower birth rates than poorer ones. That pattern weakened around 2017, and by 2021 it had flipped.
This change fits a broader historical pattern. Before the Industrial Revolution, wealthier families generally had more children. The idea that prosperity leads to smaller families is a modern development. Now, in many advanced economies, that trend is weakening or reversing. The way that prosperity influences fertility is changing yet again. Wealth and family size are no longer pulling in opposite directions.
This shift also calls into question long-standing assumptions about women’s income and fertility. For years, many economists thought that higher salaries discouraged women from having children by raising the opportunity cost of taking time off work. That no longer seems to hold in many countries.
In several high-income nations, rising female earnings are now associated with higher fertility. Studies in Italy and the Netherlands show that couples where both partners earn well are more likely to have children, while low-income couples are the least likely to do so. Similar findings have emerged from Sweden as well. In Norway, too, higher-earning women now tend to have more babies.
This trend is not limited to Europe. In the United States, richer families are also beginning to have more babies than poorer ones, reversing patterns observed in previous decades. A study of seven countries — including the United States, the United Kingdom, Germany and Australia — found that in every case, higher incomes for both men and women increased the chances of having a child.
This growing body of evidence challenges the assumption that prosperity causes people to have fewer children.
Still, birth rates are falling across much of the world, with many countries now below replacement level. While this trend raises serious concerns, such as the risk of an aging and less innovative population and widening gaps in public pension solvency, it is heartening that it is not driven by prosperity itself. Wealth does not automatically lead to fewer children, and theories blaming consumerism or rising living standards no longer hold up.
Although the recent shift in the relationship between prosperity and fertility is welcome, it is not yet enough to raise fertility to the replacement rate of around 2.1 children per woman — a challenging threshold to reach.
But the growing number of policymakers around the world concerned about falling fertility can consider many simple, freedom-enhancing reforms that lower barriers to raising a family, including reforms to education, housing and childcare. Still, it’s important to challenge the common assumption that prosperity inevitably leads to lower birth rates: Wealth does not always mean fewer children.
This article was published at The Hill on 6/16/2025.
“The number of ‘everyday’ millionaires — those with wealth between $1 million and $5 million — is soaring…
There were nearly 52 million ‘everyday’ millionaires in the world last year, per a recent report from UBS. That’s four times the number in 2000.
Even accounting for inflation, the number of everyday millionaires in 2024 was 2.5 times what it was in 2000. The wealth manager does not break down how many of these folks live in the U.S. But America has, by far, more millionaires than any other country in the world.
New American millionaires were minted at a rate of about 1,000 a day last year. There are nearly 24 million millionaires in the U.S., 40% of the global total, and about four times the number than runner-up China.”
Côte D’Ivoire’s Land Reforms Are Unlocking Jobs and Growth
“Secure land tenure transforms dormant assets into active capital—unlocking access to credit, encouraging investment, and spurring entrepreneurship. These are the building blocks of job creation and economic growth.
When landowners have secure property rights, they invest more in their land. Existing data shows that with secure property rights, agricultural output increases by 40% on average. Efficient land rental markets also significantly boost productivity, with up to 60% productivity gains and 25% welfare improvements for tenants…
Building on a long-term partnership with the World Bank, the Government of Côte d’Ivoire has dramatically accelerated delivery of formal land records to customary landholders in rural areas by implementing legal, regulatory, and institutional reforms and digitizing the customary rural land registration process, which is led by the Rural Land Agency (Agence Foncière Rurale – AFOR).
This has enabled a five-fold increase in the number of land certificates delivered in just five years compared to the previous 20 years.”