fbpx
01 / 05
Flying Abundance (And Safety) Has Increased Dramatically

Blog Post | Air Transport

Flying Abundance (And Safety) Has Increased Dramatically

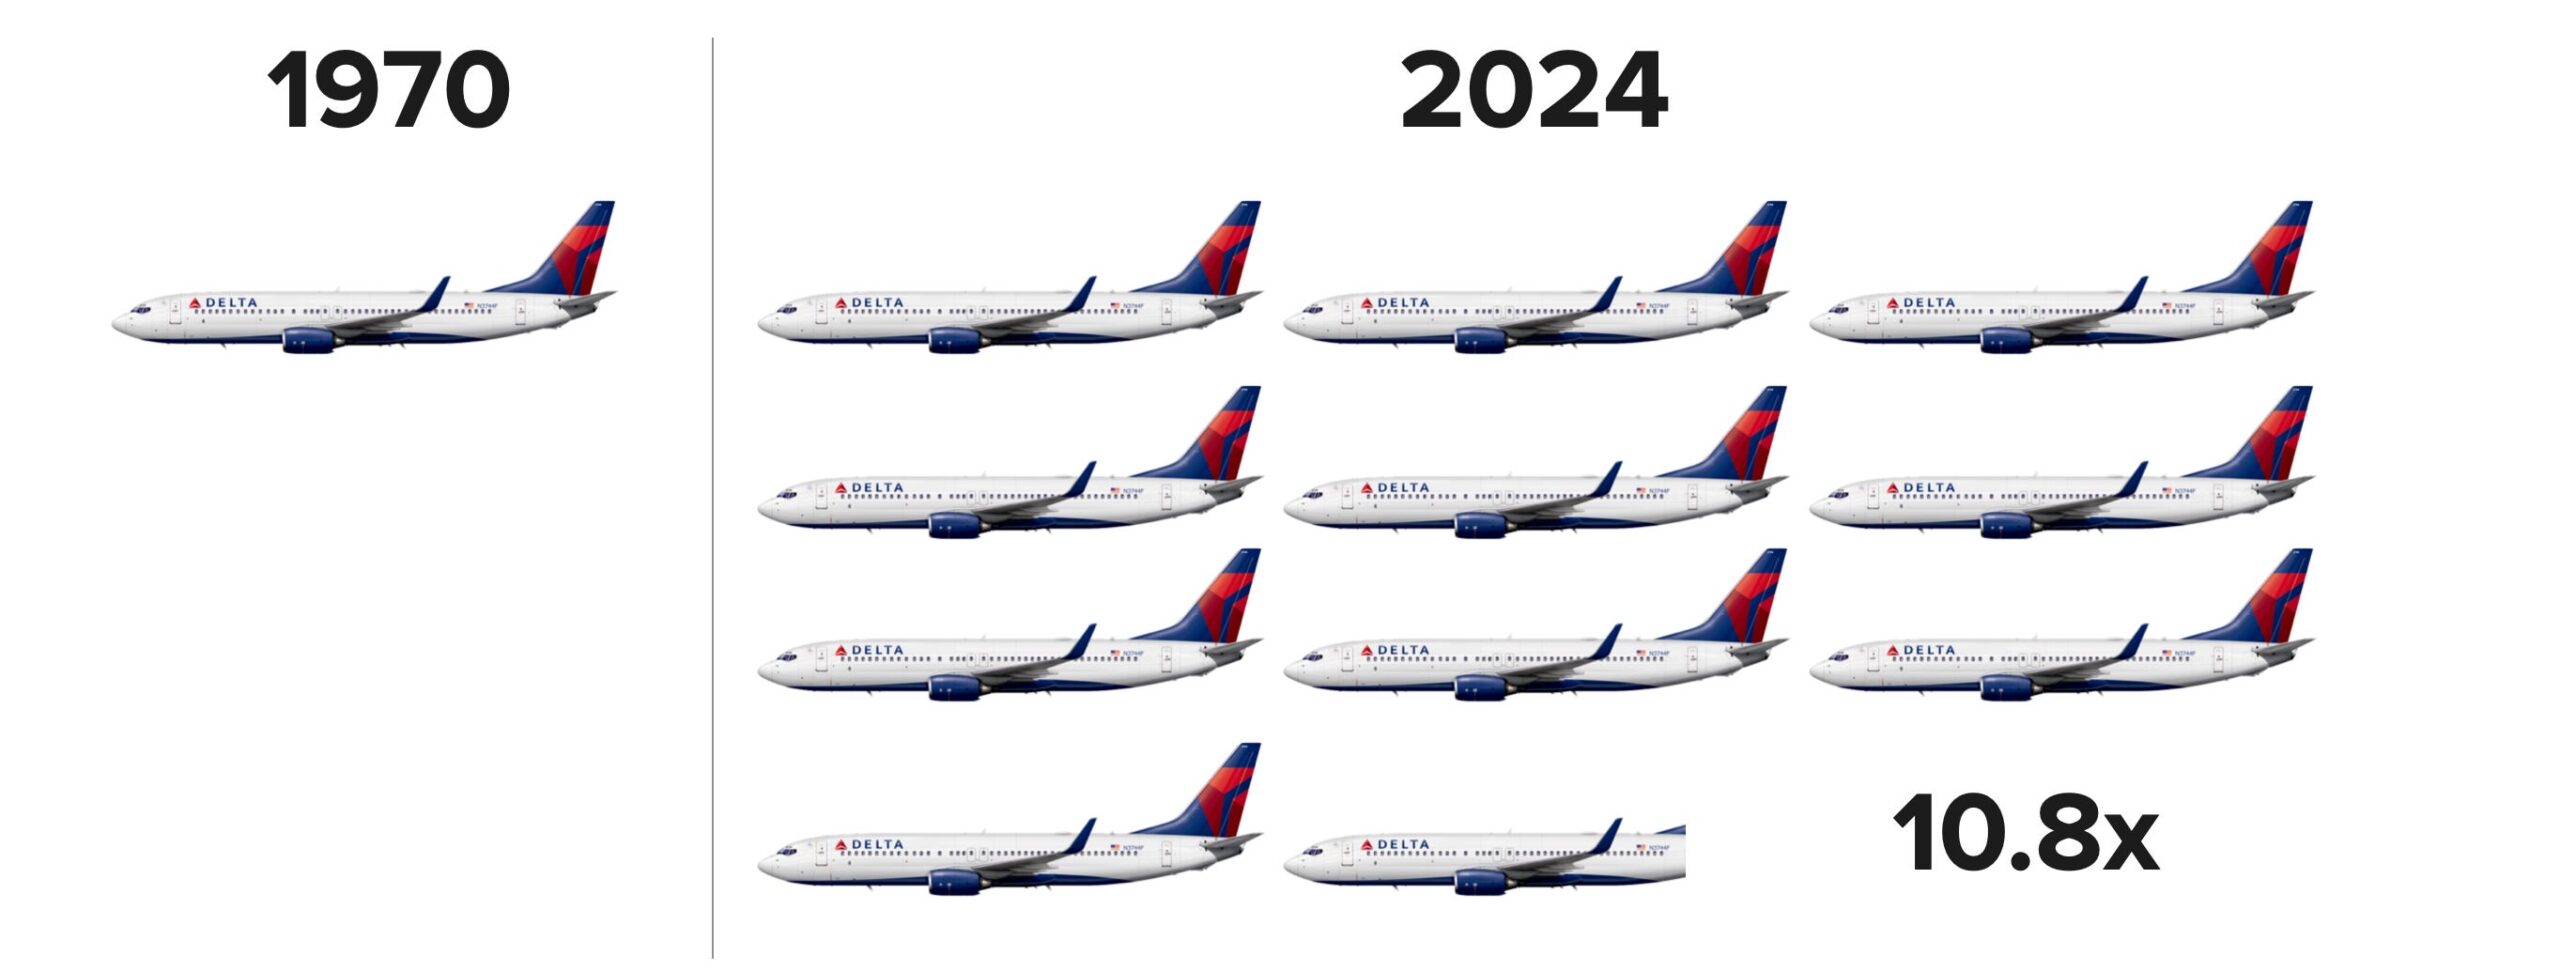
Get 10.8 flights from New York to London today for the time price of one in 1970 and be 80.4 times safer.

Summary: Since the Wright brothers’ pioneering flight in 1903, the aviation industry has made remarkable strides in safety, affordability, and accessibility. Comparing flight prices from 1970 to today reveals a staggering 90.8 percent decrease in the time price of flying, with transcontinental flights now affordable for the average person. Additionally, advancements in aviation technology have made flying dramatically safer today than it was in 1970, and are likely to improve flying safety in the future.


The Wright brothers launched the era of aviation on December 17, 1903, with a 12-second flight. Since then, aeronautical engineers and market innovators have made the experience safer, faster, and much more affordable.

For example, in 1970 the price for a roundtrip ticket from New York to London was $550. Blue-collar workers at the time were earning around $3.93 an hour in compensation (wages and benefits). This suggests a time price of around 140 hours.

Today, the ticket price has dropped to around $467. Blue-collar workers are now earning closer to $36.15 an hour, putting the time price at 12.9 hours. The time price has fallen by 90.8 percent: for the time required to earn the money to buy one flight in 1970, you can get 10.8 flights today.

Flying abundance has increased by 980 percent, compounding at an annual rate of 4.5 percent over the last 54 years. During this same period the global population increased by 4.3 billion (117 percent), from 3.7 billion to more than 8 billion. Every 1 percentage point increase in population corresponded to an 8.4 percentage point increase in flying abundance.
Now transcontinental flights are affordable for almost everyone. Free-market entrepreneurial capitalism isn’t about making more luxuries for the wealthy, it’s about making luxuries affordable for the average person.

While it is true that the 1970s flights may have had roomier cabins and better dining, flying today is dramatically safer. The Aviation Safety Network tracks airline accident data. Revenue passenger kilometer (RPK) is a standard metric used in aviation. Using this data, Javier Mediavilla plotted the ratio of fatalities per trillion RPK from 1970 to 2019 using five-year averages. The ratio decreased by 98.76 percent, from 3,218 to 40, during this 49-year range. Flying is more than 80.4 times safer today than in 1970, and safety has been improving at a compound rate of around 9.37 percent a year.
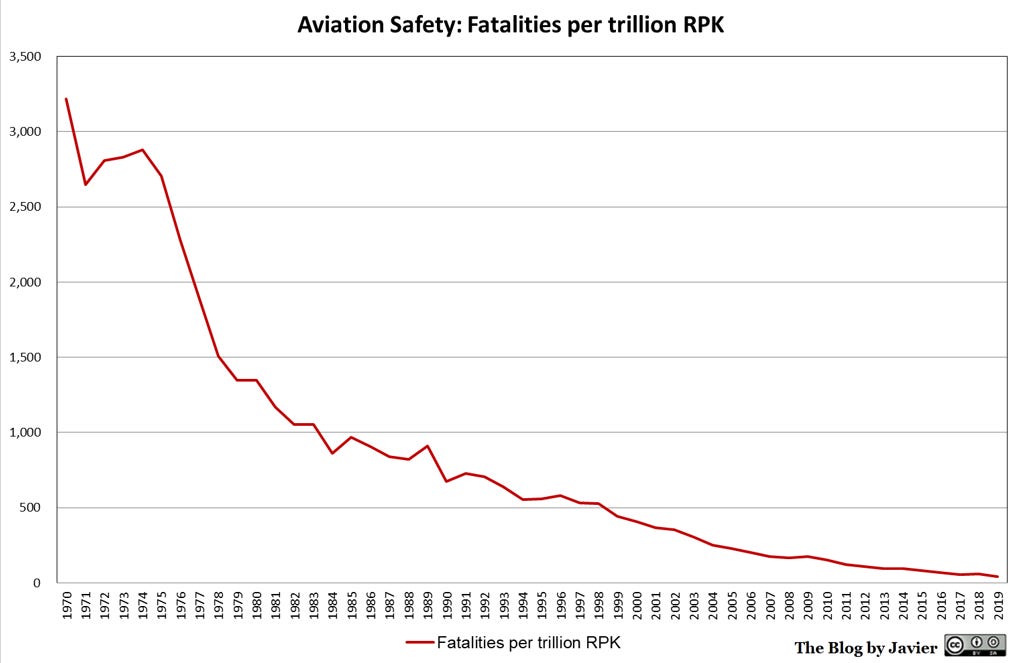
Considering both the time price and safety, flying has become 868 times more abundant since 1970 (10.8 x 80.4 = 868). If there had been no innovation in flying since 1970,  New York to London airfare would be around $5,059 today. Only the rich could afford transatlantic flights in 1970.

The 3,442-mile flight takes around seven hours. The supersonic Concorde could fly it in less than three. While there are no commercial supersonic flights available today, Boom Supersonic, a private company based in Colorado, aims to bring them back to US airlines by 2029. Perhaps spending half as much time on flights will allow people to use their most valuable resource for other value-creating activities.

This article was published at Gale Winds on 3/26/2024.

Nature | Noncommunicable Disease

New Car-T Cancer Therapy Is Now Made At One-Tenth the Cost

“A small Indian biotechnology company is producing a home-grown version of a cutting-edge cancer treatment known as chimeric antigen receptor (CAR) T-cell therapy that was pioneered in the United States. CAR-T therapies are used mainly to treat blood cancers and have burgeoned in the past few years.

The Indian CAR-T therapy costs one-tenth that of comparable commercial products available globally.”

From Nature.

Blog Post | Cost of Services

Vision Abundance Doubles on the LASIK Eye Surgery Market

The time price of LASIK eye surgery fell by over 50 percent since 1998.

Summary: Time price calculations show that LASIK surgery costs have fallen significantly since 1998. Advancements in LASIK technology, such as the transition to bladeless methods and personalized treatments, have enhanced both safety and efficacy. Dr. Gholam A. Peyman’s pivotal patent in 1988 laid the foundation for LASIK innovation, contributing to its increased affordability and accessibility, especially in countries like China and India.


This article was published at Gale Winds on 2/28/2024.

According to Market Scope, the typical cost for LASIK surgery in 2023 was $4,492. This is up slightly from the 1998 price of $4,360. Let’s calculate and compare the time prices to see the true price difference. Unskilled hourly compensation in 1998 was around $7.75, indicating a time price of 562.6 hours. Unskilled hourly compensation is closer to $16.15 today, indicating a time price of 272.1 hours. The time price has fallen 51.6 percent. You get 2.07 eyes corrected today for the time it took to earn the money to correct one in 1998. LASIK has become 107 percent more abundant.

LASIK is the acronym for laser-assisted in situ keratomileusis. Keratomileusis is the medical term for corneal reshaping. Clearsight.com reports:

LASIK technology has significantly advanced since its inception. The initial blade-based approach has been replaced by the bladeless method, using femtosecond lasers for increased precision. Wavefront and topography-guided technology now allow for personalized treatment, while sophisticated eye-tracking systems enhance the surgery’s accuracy and safety. The remarkable advancements have not only improved visual acuity but also enhanced the overall quality of visual perception, offering patients the ability to see the world around them more clearly and vividly.

While thousands of ophthalmologists and researchers from all over the world have been involved in advancing the technology, Iranian-born immigrant to the United States Dr. Gholam A. Peyman was awarded the key patent in 1988. He holds over 200 US patents, including for novel medical devices, intraocular drug delivery, surgical techniques, and new methods of diagnosis and treatment. In 2011, President Barack Obama awarded Peyman the National Medal of Innovation and Technology.

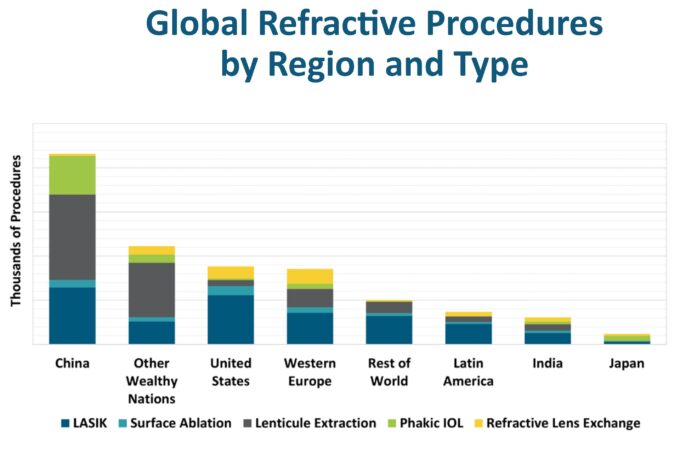
Continuous innovation in LASIK technology is making vision correction safer, faster, more precise, and more affordable. If you want to save some money and take a bit more risk, the procedure is around $1,600 in China and under $1,000 in India. China performs the most vision correction procedures on the planet.

Remember, the learning curve ordains that with every doubling of production, costs per unit fall between 20 percent and 30 percent. This is because we discover valuable new knowledge every time we perform the procedure.

As noted, since 1998, LASIK has become 107 percent more abundant in the United States, in contrast to hospital services, which have become 37.7 percent less abundant. Why the huge difference? LASIK has been relatively free to innovate. Perhaps more important, health insurance does not pay for this procedure, and LASIK is globally competitive. We also note that elective procedures have enjoyed much greater abundance growth than insurance-covered surgeries.

When entrepreneurs are free to innovate and compete, prices fall and quality increases. The opposite happens when governments and bureaucrats step in to protect the status quo. Imagine where we would be today if the manufacturers of eyeglasses had prevented the innovation of contact lenses? Or the contact lens industry had prevented LASIK?

Blog Post | Cost of Services

What Cosmetic Surgery Innovation Can Teach Us About Healthcare Costs

The average time price of 19 procedures has fallen by 50 percent since 1998.

Summary: Hospital services costs have surged, raising questions about the effectiveness of regulation and government intervention in the healthcare industry. To investigate the potential impact of free markets on cost trends, we examined the time prices of common cosmetic surgery procedures, which are elective and typically not covered by insurance. Our analysis reveals a significant decline in the relative time prices of these procedures, indicating increased abundance driven by innovation and market competition.


This article was published at Gale Winds on 2/21/2024.

The Bureau of Labor Statistics reports that since 1998, hospital services costs have increased 61 percent faster than average wages and far outpaced consumer price index inflation. This industry is highly regulated, and government restricts supply and subsidizes demand.

Would free markets help to reverse these cost trends? To answer this question, we looked at the time prices of 19 common cosmetic surgery procedures. These procedures are elective, and insurance companies typically don’t provide reimbursements. Cosmetic surgeons also have been relatively free to innovate, and cosmetic surgery centers are globally competitive.

The American Society of Plastic Surgeons annually publishes prices for a variety of procedures. We compared the nominal prices from 1998 to 2022 against the average hourly wage rates of unskilled and blue-collar workers. This gave us relative time prices over time.

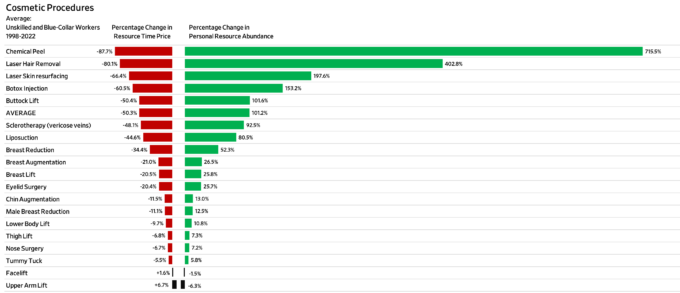
The average time price fell by 50.3 percent over this 24-year period. For the time it took to earn the money to pay for one procedure in 1998, you could get over two procedures today. Procedure abundance has increased by over 100 percent. The time price of chemical peels and laser hair removal fell the fastest by 87.7 percent and 80.1 percent, respectively. However, two procedure costs increased: upper arm lifts increased by 6.7 percent and facelifts by 1.6 percent.

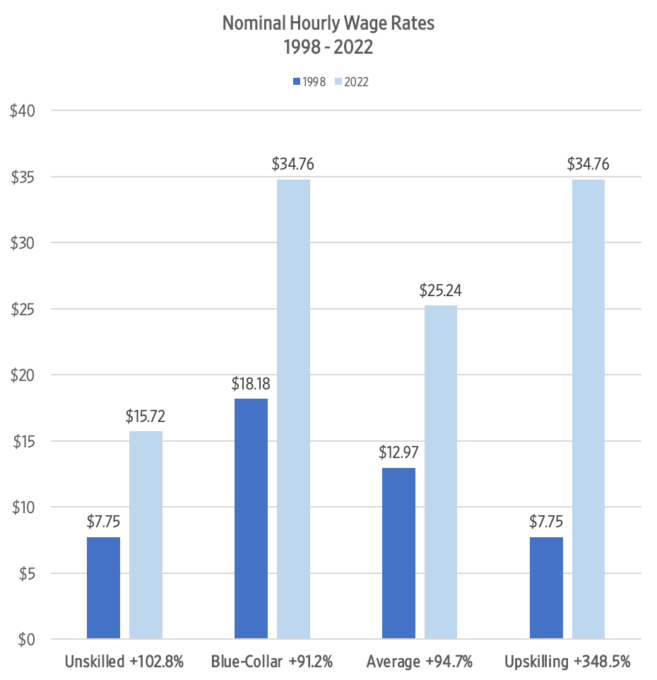
Bar chart displaying Nominal hourly wage rates from 1998 to 2022

The above analysis compares categories of wage earners over time, but what about individuals? We typically start as unskilled workers and then advance as we acquire more productive skills, knowledge, and experience. Categories remain constant while individuals are upwardly mobile. If we look at an unskilled worker who “upskilled” to a blue-collar worker, cosmetic surgery procedures have become dramatically more abundant.

From 1998 to 2022, nominal unskilled hourly wages increased by 102.8 percent, while blue-collar hourly compensation increased by 91.2 percent. The average between these two categories is 94.7 percent. If you started out in 1998 as an unskilled worker and moved up to a blue-collar worker, your nominal hourly compensation increased by 348.5 percent.

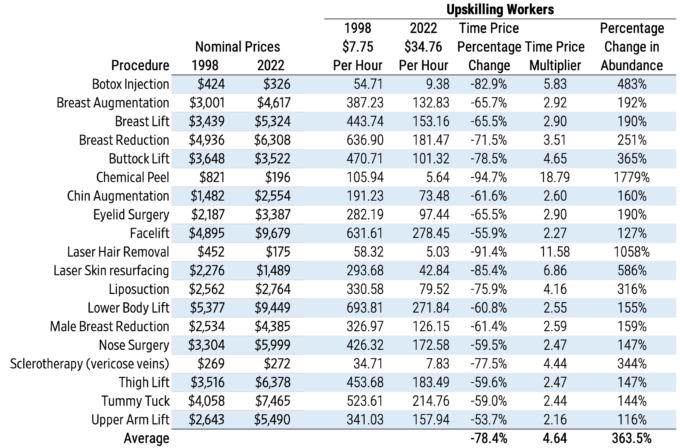
Comparing an upskilling worker’s hourly compensation to the prices of cosmetic procedures indicates that the average time price fell by 78.4 percent. These workers could get 4.63 procedures in 2022 for the time price of one in 1998. Personal cosmetic surgery abundance increased by 363.5 percent for upskilling workers, growing at a 6.6 percent compound annual rate, doubling every 11 years or so.

Blog Post | Cost of Living

Time Pricing Mark Perry’s Chart of the Century

Since 2000, hospital services became 37.7 percent less abundant while TVs became 10,090 percent more abundant.

This article was published at Gale Winds on 1/31/2024.

Line graph displaying price changes in selected US consumer goods and services between 2000 and 2023

Mark Perry, an economics professor at the University of Michigan, regularly publishes a chart illustrating the percentage change in the nominal prices of a variety of US consumer goods and services. He also notes the change in average hourly wages. His data come from the Bureau of Labor Statistics. This is a great chart, but note that prices can increase to infinity but can only decrease by 100 percent (and then they become free).

We have compared each product to the change in average hourly wages to get the change in the time prices. The times prices are then compared over time to measure changes in abundance. This bar chart illustrates these changes.

Graph displaying the percentage change in abundance of selected US consumer goods

Products and services that became less abundant are subject to high levels of government interference on both the demand and supply sides.

This chart does not include TVs. The time price of TVs decreased by over 99 percent. For the time it took to earn the money to buy one TV in 2000, you can get 101.9 TVs today. TV abundance increased by 10,090 percent. The horizontal scale would be 12 times wider if we included TVs, and everything else would look tiny.

Over this 23-year period, overall inflation increased by 82.4 percent while average hourly income increased by 114 percent. Hourly income increased 38 percent faster than prices. This indicates a 14.8 percent decrease in overall time prices. You get 17.3 percent more today for the same amount of time 23 years ago.

This illustrates the fact that things can get more expensive and more affordable at the same time. As long as hourly wages are increasing faster than product prices, time prices are decreasing, which is another way of saying personal abundance is increasing.

The iPhone also is not included in this chart. In 2000, the iPhone was seven years away. It is difficult to measure how much abundance this innovation has created. To get an idea, ask yourself how much someone would have to pay you to never use a mobile phone again. Yes, you are a multimillionaire.

Time prices are a better way to measure standards of living. To really understand our economy, we must move beyond thinking in dollars and cents to thinking in hours and minutes. Time prices are the true prices.