fbpx
01 / 05
Eight Centuries of Increasing Food Abundance in England: Grains

Blog Post | Food & Hunger

Eight Centuries of Increasing Food Abundance in England: Grains

The growth rate of grain abundance has accelerated rapidly in recent centuries.

Summary: Throughout history, the affordability of food in England has undergone significant changes. Analyzing data from the 13th century to the present reveals how the abundance of grains like rice, wheat, and oats has increased substantially, benefiting both skilled and unskilled workers.


Human progress is often incremental, but many positive trends have become clearly visible over time. One of these trends is the growing abundance of food. This series of articles for HumanProgress.org will look at the affordability of food relative to wages in England between the 13th century and the present.  

Professor Gregory Clark of the University of California, Davis, has conducted extensive research into the economic history of England. As part of his research into the condition of the working class in England, Clark has developed an extensive data set containing nominal prices of goods, and nominal wages of skilled and unskilled workers in England between the 13th and 19th centuries. Note: Clark assumes a 10-hour workday before 1720.

Using the concept of time prices developed by Marian L. Tupy and Gale L. Pooley, we can calculate the number of hours of work that someone must work to earn enough money to buy a particular food item.  

In this analysis, Clark’s nominal prices of food items serve as the nominator, and nominal hourly wages, which come from Clark and from the UK’s Office of National Statistics’ Annual Survey of Hours and Earnings, serve as the denominator.

Figure 1: Food abundance from the perspective of unskilled workers in England, hours of labor

As we can see in Figure 1, a pound of rice fell from 6.65 hours of labor in the 1200s to 0.15 hours of labor in 2022. A bushel of wheat fell from 35.4 hours of labor to 0.84 hours, and a bushel of oats fell from 14.8 hours of labor to 0.41 hours.

Figure 2: Food abundance from the perspective of unskilled workers in England, per hour of labor

As we can see in Figure 2, an hour of work bought 0.15 pounds of rice for an unskilled worker in 1265. That rose to 6.88 pounds of rice in 2022. Instead of 0.03 bushels of wheat, an unskilled worker got 1.19 bushels. Instead of 0.07 bushels of oats, he or she got 2.42 bushels.

That means that unskilled workers earned 45.7 times as many pounds of rice per hour in 2022 compared to the 1200s. For every bushel of wheat in the 1200s, an unskilled worker earned 42 bushels in 2022. Instead of 1 bushel of oats, he or she got 35.9 bushels.

Figure 3: Food abundance from the perspective of skilled workers in England, hours of labor

As we can see in Figure 3, for a skilled worker, a pound of rice fell from 3.59 hours of labor in the 1200s to 0.11 hours of labor in 2022. A bushel of wheat fell from 19.11 hours of labor to 0.66 hours, and a bushel of oats fell from 8.01 hours of labor to 0.32 hours.

Figure 4: Food abundance from the perspective of skilled workers in England, per hour of labor

As we can see in Figure 4, an hour of work bought 0.28 pounds of rice for a skilled worker in the 1200s. That rose to 8.79 pounds of rice in 2022. Instead of 0.63 bushels of wheat, a skilled worker got 1.52 bushels. Instead of 1.5 bushels of oats, he or she got 3.1 bushels.

Put differently, skilled workers earned 31.6 times as many pounds of rice per hour in 2022 compared to the 1200s. For every bushel of wheat in the 1200s, a skilled worker got 29.01 bushels in 2022. For 1 bushel of oats in 1265, he or she got 24.81 in 2022. 

Clearly, grains became much more abundant for both skilled and unskilled workers. Moreover, note that the time price differential between unskilled laborers and skilled tradesmen has shrunk. For example, to afford a bushel of wheat in the 1200s, an unskilled worker would have to work 35.4 hours compared to 19.1 hours for a skilled worker, a difference of over 16 hours. However, in 2022, an unskilled worker would work 50.5 minutes to afford a bushel, and a skilled worker would work 39.5 minutes, a difference of only 11 minutes.

Put differently, unskilled workers have become better-off relative to their more-skilled compatriots. 

Finally, the rate of growth in abundance has clearly accelerated over the last 200 years. Whereas the rate of growth in the abundance of rice, wheat and oats grew at a compounded annual rate of about 0.23 percent between 1265 and 1865 for an unskilled worker, it grew a rate of 1.49 percent between 1865 and 2022. Similarly, for a skilled worker, the compound annual growth rate increased from 0.19 percent before 1865 to 1.38 percent afterwards. Since the mid-1800s, the rate of growth of wages relative to prices has increased dramatically.

World Bank | Food Prices

Global Food Prices Ease amid Improved Supply and Trade

“Global grain supplies are projected to reach a record 3.6 billion tons in the 2025-26 season, marking a third consecutive year of growth—though at a slower pace than the average annual growth of the preceding two decades. Wheat supply has returned to its long-term average growth rate, while maize supply has rebounded after recent setbacks but remains below its historical trend. In contrast, supplies of rice and soybeans are projected to grow at about their long-term growth averages, building on last season’s significantly elevated levels.”

From World Bank.

Blog Post | Cost of Living

Time Pricing Mark Perry’s Latest “Chart of the Century”

Always compare prices to hourly wages to understand the true change in living standards.

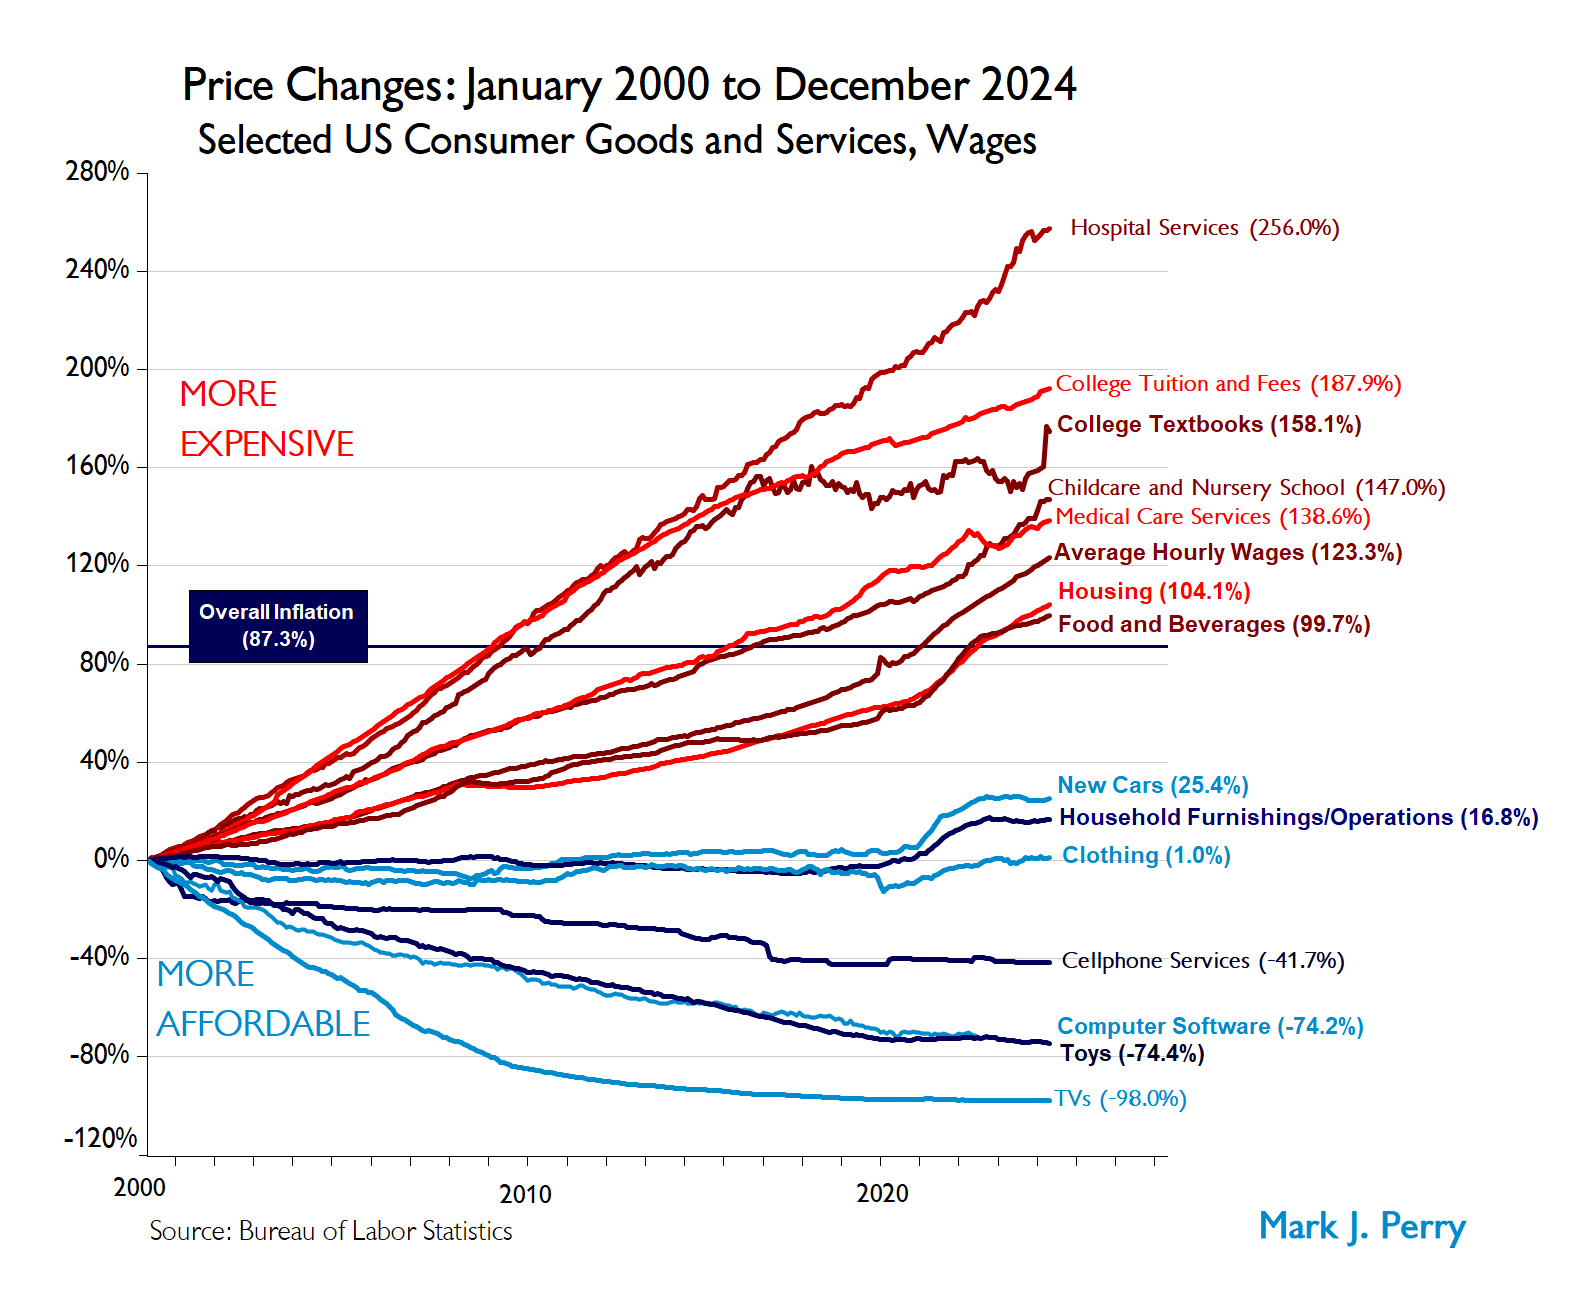
Professor Mark Perry recently posted his updated “Chart of the Century,” featuring price and wage data from the Bureau of Labor Statistics (BLS). The chart tracks 14 items over the 24 years from January 2000 to December 2024 and includes both the overall inflation rate and changes in average hourly wages.

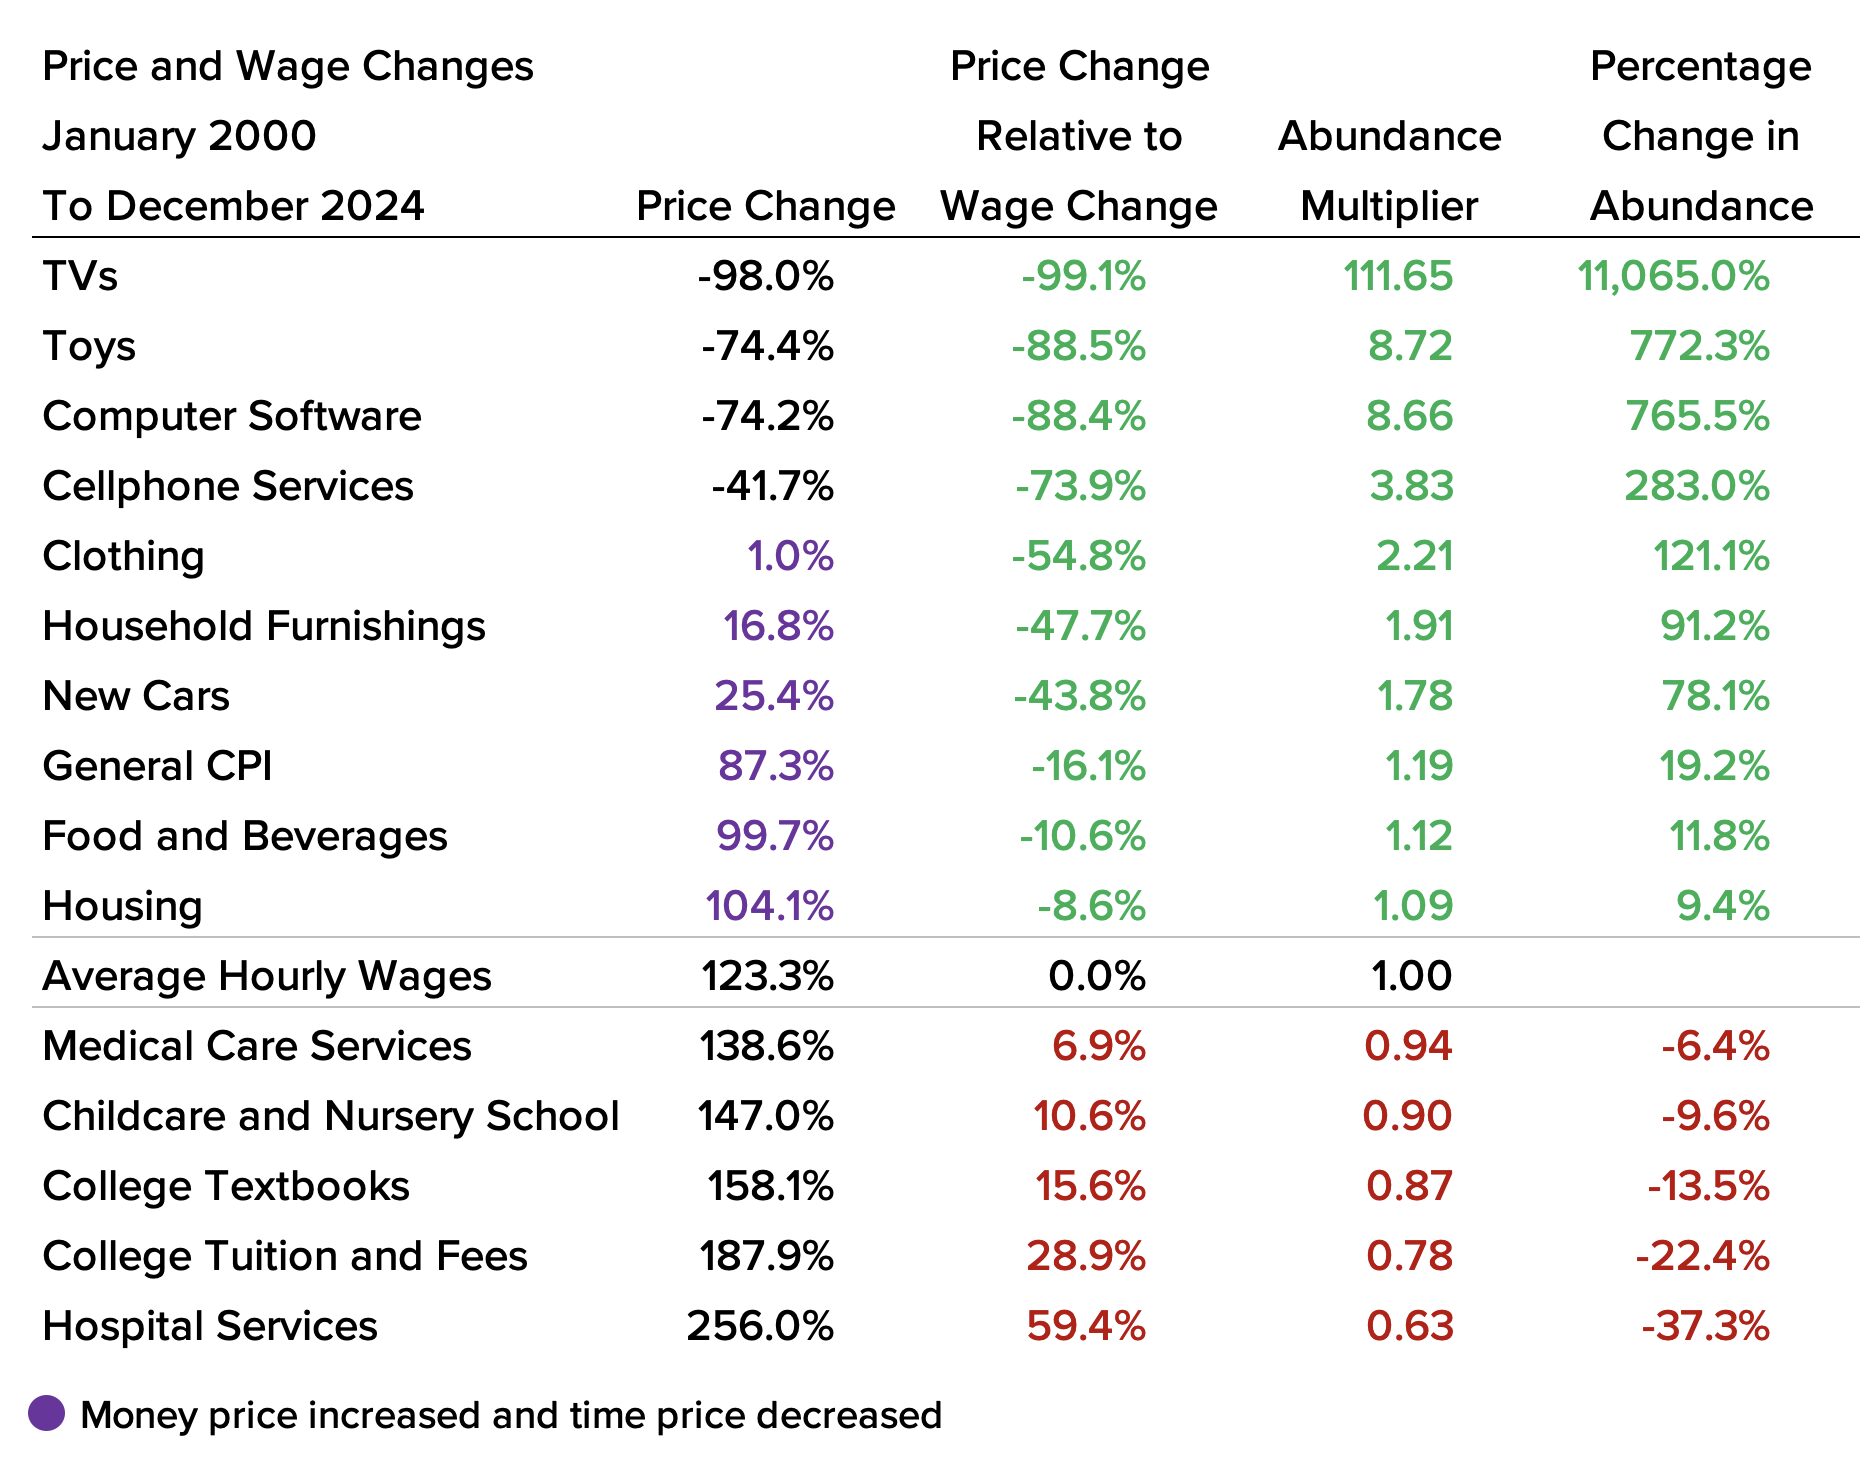
To examine the data from a different perspective, we calculated the change in time prices of these 14 items relative to the change in the average hourly wage. We then determined the abundance multiplier—a value that indicates how many units of an item you could buy in 2024 for the amount of work time it took to buy one unit in 2000. If there were no change, the abundance multiplier would equal one. A value below one indicates decreasing abundance, while a value above one reflects increasing abundance. We also calculated the percentage change in abundance for each item.

This analysis illustrates that things can become more expensive in dollar terms while simultaneously becoming more affordable in time prices. For instance, while the general Consumer Price Index (CPI) rose by 87.3 percent, average hourly wages increased by 123.3 percent. As a result, time prices fell by 16.1 percent. For the time it took to purchase one CPI basket in January 2000, a consumer could buy 1.192 baskets in December 2024—an abundance increase of 19.2 percent.

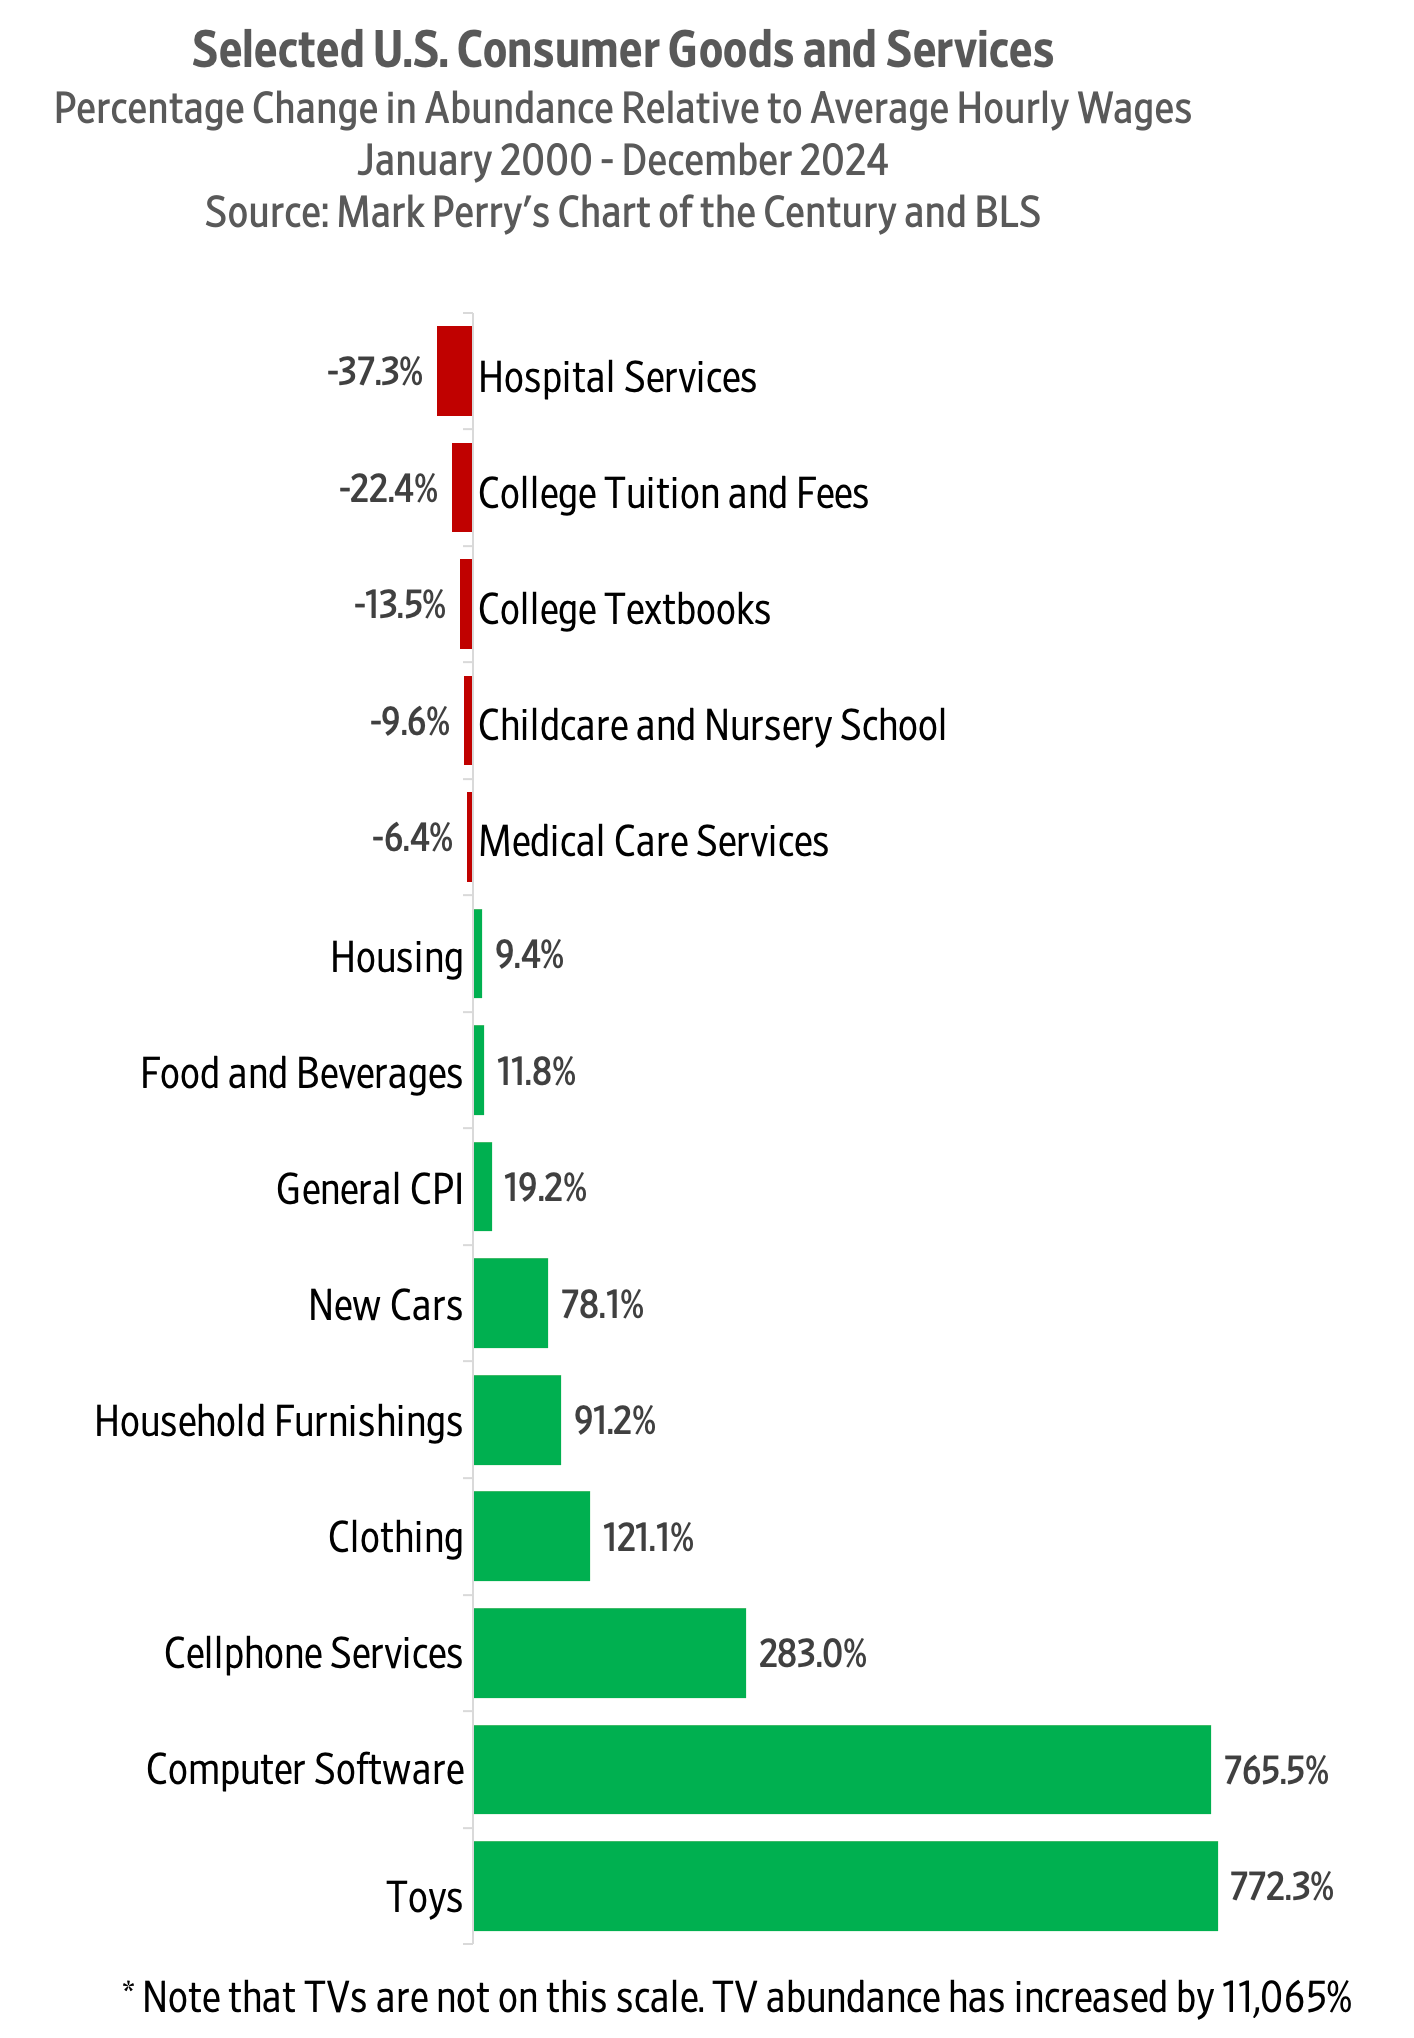
Notably, categories such as housing, food and beverages, new cars, household furnishings, and clothing all increased in money prices. However, after adjusting for rising wages, they became more affordable in time-price terms. Although 10 of the 14 items rose in nominal prices over the 24 years, only five had a higher time price when accounting for the 123.3 percent increase in hourly wages.

We also created a chart showing the percentage change in abundance for the general CPI and each of the 14 tracked items:

Find more of Gale’s work at his Substack, Gale Winds.

Blog Post | Food Prices

Have Eggs Ever Been More Expensive?

The money price of eggs is higher than in 1919, but the time price is lower.

The high price of eggs may have incentivized a burglar to heist 100,000 eggs from the back of a trailer in Pennsylvania. Have eggs ever been more expensive? The surprising answer is yes—much more. In 1919, eggs were five to six times more expensive: A dozen eggs were 61 cents, or around 5 cents per egg. Wages for unskilled workers at the time were around 25 cents per hour, so these workers had to spend around 12 minutes to earn the money to buy one egg.

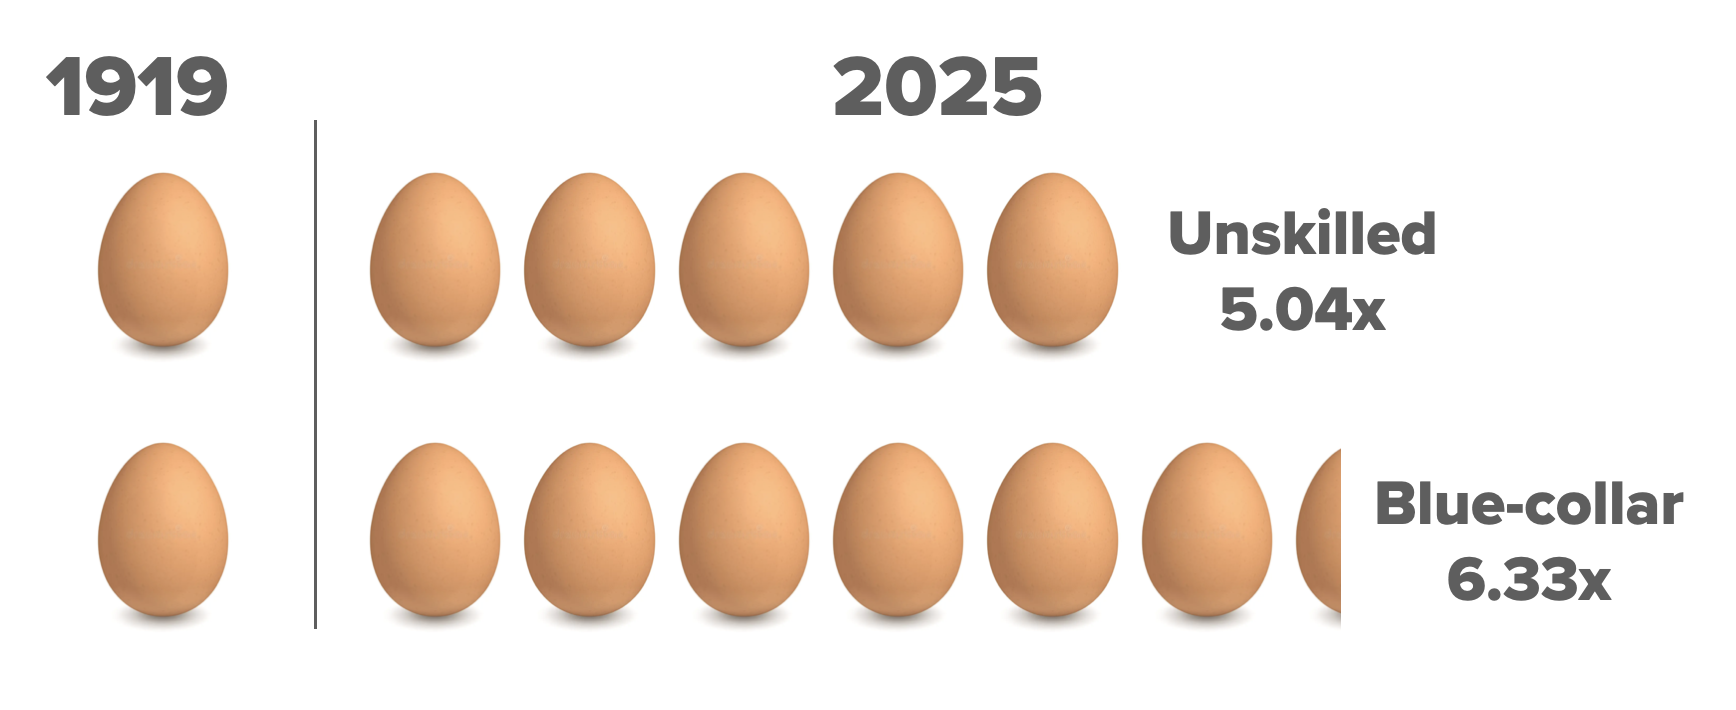
Eggs at Walmart at the time of writing (Feb 14) are $8.32 per dozen, but unskilled worker wages and benefits have increased to $17.17 an hour. That would put the time price for one egg at 2.4 minutes. The time price for unskilled workers has decreased by 80 percent since 1919. For the time required to earn the money to buy one egg in 1919, unskilled workers get five today. They’re 400 percent better off.

How about blue-collar workers? Wages for blue-collar workers in 1919 were around 43 cents per hour, so an egg cost them 7 minutes. They’re now earning $37.15 an hour, so their time price for one egg is 1.1 minute. The time price for skilled workers has decreased by 84 percent since 1919. They get 6.33 eggs today for the time it took to buy one egg in 1919. They’re 533 percent better off.

Yes, the money price of an egg today compared to 1919 is high, but the time price is much lower. Always compare the money price to hourly wages to see the time price, since that is the true price we pay for things.

Why did the price jump so high? The USDA recently ordered the culling of millions of chickens in response to worries about bird flu. Reduce supply like that and prices are bound to increase.

Fortunately for us, chickens lay lots of eggs, so the market should be resupplied soon. I have such great faith in our egg-laying friends and free-market entrepreneurs that I’m willing to bet $1 that the time price of eggs will be lower in February 2026 than today. Any takers?

Find more of Gale’s work at his Substack, Gale Winds.