fbpx
01 / 05
Can Finance Save the Wolves?

Blog Post | Conservation & Biodiversity

Can Finance Save the Wolves?

Economics informs us that unsolvable societal disputes don’t have to become political wrestling matches.

Most people have quite the dire view of finance and markets. Unscrupulous bankers and pompous hedge funds place unsound bets on obscure and risky investments; greedy businessmen jack prices and fire workers at the first sight of recessions caused by their own avarice. Money rules the world, goes the trope. But that also means that financial incentives have the power to align behavior more powerfully than most appeals to morals, kindness, or the good of the community.

Yale University finance professor William Goetzmann opens his book Money Changes Everything: How Finance Made Civilization Possible with the observation that “finance is the story of a technology: a way of doing things. Like other technologies, it developed through innovations that improved efficiency. It is not intrinsically good or bad.” Markets, especially those for financial assets and property, are a way to rearrange reality’s unavoidable risks, benefits, and payoffs; they are “by, for, and about people’s lives.”

One fascinating way that modern financial engineering helps make the world a better place is through counterintuitive payments, such as in global forestry. Making money by chopping down trees is a model that everyone understands—get chainsaws and harvesters, hire some laborers, chop trees, and sell the wood for profit.

Another way is to make money by not chopping down trees, courtesy of resourceful financiers and carbon sequestration markets. In efforts to reduce their carbon emissions, major corporations routinely pay forest owners to keep more trees in the ground for longer. This “negative logging” is made possible by financial flows from those who want more trees to those who manage them.

In 2021, the World Bank paid nine districts in Mozambique’s Zambézia province for keeping forests intact. When in power, Brazil’s ex-president Jair Bolsonaro routinely tried to shake down the international community for cash payments in exchange for not deforesting the Amazon. Think what you will of this controversial political figure and his policies, but the economic mechanism his government proposed here was sound – rich Westerners want flourishing rainforests and an end to global deforestation, and poor farmers and loggers want to use economically unproductive land to better their standards of living. A deal naturally presented itself.

Well-structured financial payments can also solve another pickle that routinely devolves into political mudslinging: wildlife. City-dwellers often have a romanticized view of nature and ecologic systems, like the idea of healthy wolf populations. Ranchers and pastoralists who bear the visible costs of livestock killed usually have a different view. Cue unsolvable political showdowns.

In Sweden, where ecological concerns usually reign supreme, rural constituents and an anti-wolf lobby have recently gotten the upper hand. This summer, the government announced that it wanted to reduce the already inbred and endangered wolf population by half. The policy is based on no scientific evidence whatsoever. It is a political measure to reduce concentrated economic damages among a loud constituency.

It seems that only one group can be satisfied. The groups who favor more wolves and those favoring fewer can’t both have their way. When management over common-pool resources devolves into political disputes, policy usually pinballs between various interests as they wrestle control over the political apparatus.

Finance and Markets Can Align Mutually Incompatible Interests

Economics informs us that unsolvable societal disputes don’t have to become political wrestling matches. Instead, we need financial instruments and payoffs that have city-dwellers paying rural communities for the unavoidable death caused by having thriving predator populations.

If city-dwellers’ desire to have large or growing wolf populations in their countries is genuine, they should be willing to pay extra for cattle meat sourced from wolf territories, the livestock most at risk for wolf attacks.

Ecologic systems, like economic systems, are dynamic – changes to them don’t impact just one thing. When wolves return to areas where they were hunted to extinction during the 20th century, they unfortunately attack livestock or domestic animals. But they also keep the population of boars, deer, or elk in check, which reduce the damage to agriculture and gardens, cars, and people. Insurance companies could play a role by supporting conservation efforts for large predators—or offer reduced premiums for customers that do—since more wolves means fewer and/or more skittish deer and elk, which dramatically reduce vehicle collisions with wildlife.

Another way to achieve the same reshuffling of economic value is to have (generally wealthier) city-dwellers pay lavishly for ecotourism trips into areas where wolves are plentiful—like these projects in Spain’s Sierra de la Culebra. Some of the revenue streams should make it back to shepherds losing livestock to attacks or farmers who can credibly show the presence of wolves on their grounds (say, through wildlife cameras capturing their movements).

In Scandinavia, these conflicts become overwhelmingly political not only out of a lack of financial engineering but also because most compensation schemes are run by bureaucrats and financed by taxpayers. Vultures circle around political payouts as well as fresh carcasses.

Modeling by Anders Skonhoft at the Norwegian University of Science and Technology suggests that ex-ante payments for predator presence yield better outcomes than ex-post reimbursement of livestock damages. This is the animal husbandry equivalent to paying for not cutting down trees.

In the 1990s, the Swedish government introduced such an ex-ante scheme for the Sámi population and the reindeer they manage. Sámi herders routinely lose some 20 percent of their animals to carnivore attacks every year. By tying reimbursement to the presence of lynx and wolverine offspring rather than exact reindeer attacks, the scheme turns those most posed to disapprove of predators into their greatest defenders.

With the introduction of ecotourism in Africa and the Amazon, the same financial incentives have flipped loggers and poachers into guides, the enemies of predators becoming their greatest protectors. On a larger scale, the right financial structures—payouts, markets, and assets—can align the interest of unsolvable political enemies.

BBC | Agriculture

Farmer’s One of First to Use AI Driverless Tractors

“A farmer has become one of the first in the UK to use driverless tractors.

Will Mumford, an arable farmer in St Neots, Cambridgeshire, has used an autonomous vehicle to cultivate soil and another to plant seeds.

He said the robots were the future of farming as they could operate for up to 30 hours at a time and cause less damage to the land.

However, it is believed they would have to reduce in price before conventional machinery was replaced en masse.”

From BBC.

The Guardian | Food Production

Finnish Startup Begins Making Food “From Air and Solar Power”

“Nothing appears remarkable about a dish of fresh ravioli made with solein. It looks and tastes the same as normal pasta.

But the origins of the proteins which give it its full-bodied flavour are extraordinary: they come from Europe’s first factory dedicated to making human food from electricity and air.

The factory’s owner, Solar Foods, has started production at a site in Vantaa, near the Finnish capital of Helsinki, that will be able to produce 160 tonnes of food a year. It follows several years of experimenting at lab scale.”

From The Guardian.

Blog Post | Energy & Natural Resources

The Simon Abundance Index 2024

The Earth was 509.4 percent more abundant in 2023 than it was in 1980.

The Simon Abundance Index (SAI) quantifies and measures the relationship between resources and population. The SAI converts the relative abundance of 50 basic commodities and the global population into a single value. The index started in 1980 with a base value of 100. In 2023, the SAI stood at 609.4, indicating that resources have become 509.4 percent more abundant over the past 43 years. All 50 commodities were more abundant in 2023 than in 1980.

Figure 1: The Simon Abundance Index: 1980–2023 (1980 = 100)

The SAI is based on the ideas of University of Maryland economist and Cato Institute senior fellow Julian Simon, who pioneered research on and analysis of the relationship between population growth and resource abundance. If resources are finite, Simon’s opponents argued, then an increase in population should lead to higher prices and scarcity. Yet Simon discovered through exhaustive research over many years that the opposite was true. As the global population increased, virtually all resources became more abundant. How is that possible?

Simon recognized that raw materials without the knowledge of how to use them have no economic value. It is knowledge that transforms raw materials into resources, and new knowledge is potentially limitless. Simon also understood that it is only human beings who discover and create knowledge. Therefore, resources can grow infinitely and indefinitely. In fact, human beings are the ultimate resource.

Visualizing the Change

Resource abundance can be measured at both the personal level and the population level. We can use a pizza analogy to understand how that works. Personal-level abundance measures the size of an individual pizza slice. Population-level abundance measures the size of the entire pizza pie. The pizza pie can get larger in two ways: the slices can get larger, or the number of slices can increase. Both can happen at the same time.

Growth in resource abundance can be illustrated by comparing two box charts. Create the first chart, representing the population on the horizontal axis and personal resource abundance on the vertical axis. Draw a yellow square to represent the start year of 1980. Index both population and personal resource abundance to a value of one. Then draw a second chart for the end year of 2023. Use blue to distinguish this second chart. Scale it horizontally for the growth in population and vertically for the growth in personal resource abundance from 1980. Finally, overlay the yellow start-year chart on the blue end-year chart to see the difference in resource abundance between 1980 and 2023.

Figure 2: Visualization of the Relationship between Global Population Growth and Personal Resource Abundance of the 50 Basic Commodities (1980–2023)

Between 1980 and 2023, the average time price of the 50 basic commodities fell by 70.4 percent. For the time required to earn the money to buy one unit of this commodity basket in 1980, you would get 3.38 units in 2023. Consequently, the height of the vertical personal resource abundance axis in the blue box has risen to 3.38. Moreover, during this 43-year period, the world’s population grew by 3.6 billion, from 4.4 billion to over 8 billion, indicating an 80.2 percent increase. As such, the width of the blue box on the horizontal axis has expanded to 1.802. The size of the blue box, therefore, has grown to 3.38 by 1.802, or 6.094 (see the middle box in Figure 2).

As the box on the right shows, personal resource abundance grew by 238 percent; the population grew by 80.2 percent. The yellow start box has a size of 1.0, while the blue end box has a size of 6.094. That represents a 509.4 percent increase in population-level resource abundance. Population-level resource abundance grew at a compound annual rate of 4.3 percent over this 43-year period. Also note that every 1-percentage-point increase in population corresponded to a 6.35-percentage-point increase in population-level resource abundance (509.4 ÷ 80.2 = 6.35).

Individual Commodity Changes: 1980–2023

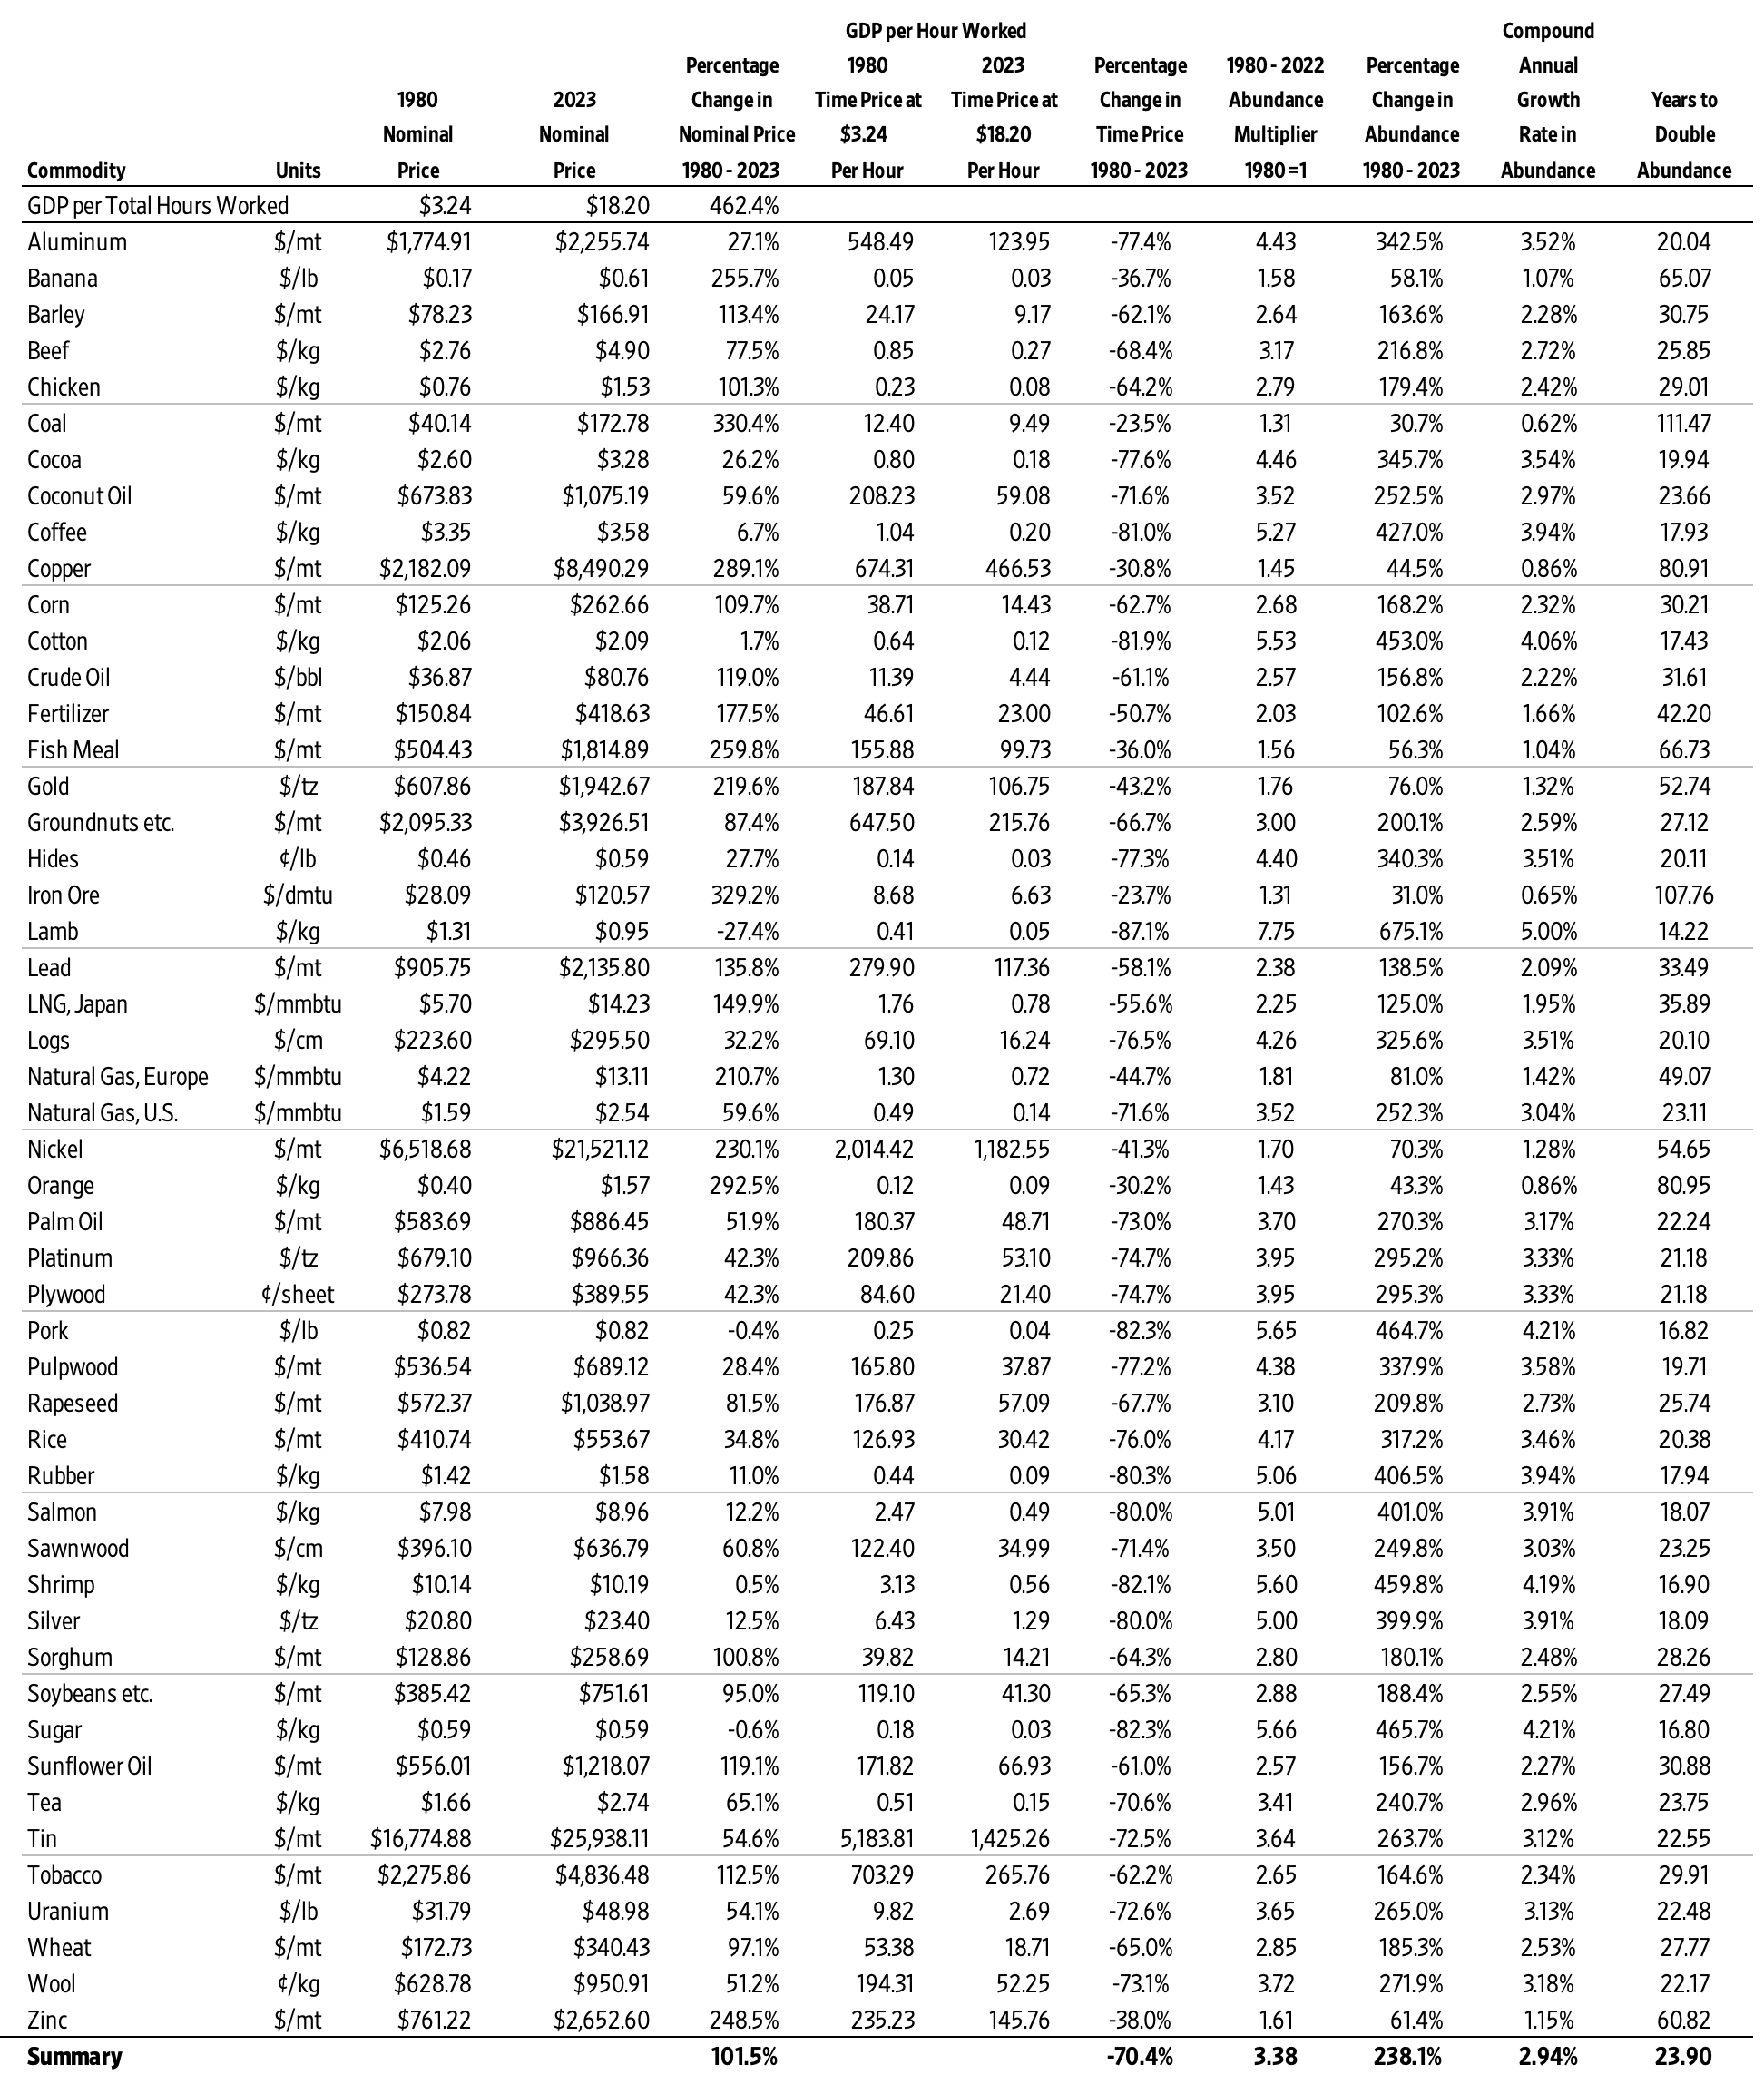
As noted, the average time price of the 50 basic commodities fell by 70.4 percent between 1980 and 2023. As such, the 50 commodities became 238.1 percent more abundant (on average). Lamb grew most abundant (675.1 percent), while the abundance of coal grew the least (30.7 percent).

Figure 3: Individual Commodities, Percentage Change in Time Price and Percentage Change in Abundance: 1980–2023

Individual Commodity Changes: 2022–2023

The SAI increased from a value of 520.1 in 2022 to 609.4 in 2023, indicating a 17.1 percent increase. Over those 12 months, 37 of the 50 commodities in the data set increased in abundance, while 13 decreased in abundance. Abundance ranged from a 220.8 percent increase for natural gas in Europe to a 38.9 percent decrease for oranges.

Figure 4: Individual Commodities, Percentage Change in Abundance: 2022–2023

Conclusion

After a sharp downturn between 2021 and 2022, which was caused by the COVID-19 pandemic, government lockdowns and accompanying monetary expansion, and the Russian invasion of Ukraine, the SAI is making a strong recovery. As noted, since 1980 resource abundance has been increasing at a much faster rate than population. We call that relationship superabundance. We explore this topic in our book Superabundance: The Story of Population Growth, Innovation, and Human Flourishing on an Infinitely Bountiful Planet.

Appendix A: Alternative Figure 1 with a Regression Line, Equation, R-Square, and Population

Appendix B: The Basic 50 Commodities Analysis: 1980–2023

Appendix C: Why Time Is Better Than Money for Measuring Resource Abundance

To better understand changes in our standard of living, we must move from thinking in quantities to thinking in prices. While the quantities of a resource are important, economists think in prices. This is because prices contain more information than quantities. Prices indicate if a product is becoming more or less abundant.

But prices can be distorted by inflation. Economists attempt to adjust for inflation by converting a current or nominal price into a real or constant price. This process can be subjective and contentious, however. To overcome such problems, we use time prices. What is most important to consider is how much time it takes to earn the money to buy a product. A time price is simply the nominal money price divided by the nominal hourly income. Money prices are expressed in dollars and cents, while time prices are expressed in hours and minutes. There are six reasons time is a better way than money to measure prices.

First, time prices contain more information than money prices do. Since innovation lowers prices and increases wages, time prices more fully capture the benefits of valuable new knowledge and the growth in human capital. To just look at prices without also looking at wages tells only half the story. Time prices make it easier to see the whole picture.

Second, time prices transcend the complications associated with converting nominal prices to real prices. Time prices avoid subjective and disputed adjustments such as the Consumer Price Index (CPI), the GDP Deflator or Implicit Price Deflator (IPD), the Personal Consumption Expenditures price index (PCE), and the Purchasing Power Parity (PPP). Time prices use the nominal price and the nominal hourly income at each point in time, so inflation adjustments are not necessary.

Third, time prices can be calculated on any product with any currency at any time and in any place. This means you can compare the time price of bread in France in 1850 to the time price of bread in New York in 2023. Analysts are also free to select from a variety of hourly income rates to use as the denominator when calculating time prices.

Fourth, time is an objective and universal constant. As the American economist George Gilder has noted, the International System of Units (SI) has established seven key metrics, of which six are bounded in one way or another by the passage of time. As the only irreversible element in the universe, with directionality imparted by thermodynamic entropy, time is the ultimate frame of reference for almost all measured values.

Fifth, time cannot be inflated or counterfeited. It is both fixed and continuous.

Sixth, we have perfect equality of time with exactly 24 hours in a day. As such, we should be comparing time inequality, not income inequality. When we measure differences in time inequality instead of income inequality, we get an even more positive view of the global standards of living.

These six reasons make using time prices superior to using money prices for measuring resource abundance. Time prices are elegant, intuitive, and simple. They are the true prices we pay for the things we buy.

The World Bank and the International Monetary Fund (IMF) track and report nominal prices on a wide variety of basic commodities. Analysts can use any hourly wage rate series as the denominator to calculate the time price. For the SAI, we created a proxy for global hourly income by using data from the World Bank and the Conference Board to calculate nominal GDP per hour worked.

With this data, we calculated the time prices for all 50 of the basic commodities for each year and then compared the change in time prices over time. If time prices are decreasing, personal resource abundance is increasing. For example, if a resource’s time price decreases by 50 percent, then for the same amount of time you get twice as much, or 100 percent more. The abundance of that resource has doubled. Or, to use the pizza analogy, an individual slice is twice as large. If the population increases by 25 percent over the same period, there will be 25 percent more slices. The pizza pie will thus be 150 percent larger [(2.0 x 1.25) – 1].

Castanet | Food Production

Company Gets Green Light for GMO Non-browning Apple

“An Okanagan-based company is thrilled that their latest trademarked non-browning apple has been green-lit for sale on Canadian shelves, after a history of public nerves surrounding genetically modified crops.

Okanagan Specialty Fruits is the developer and grower behind ‘Arctic apple’ varieties, sold pre-sliced or diced with the promise of staying fresh and avoiding browning for up to 28 days thanks to bioengineering tweaks to the apples’ genetic codes.”

From Castanet.