fbpx
01 / 05
Are We Really Poorer Than Our Parents?

Blog Post | Economic Growth

Are We Really Poorer Than Our Parents?

Hourly wages do not reflect the massive expansion in non-wage benefits since the 1950's.

Spread of products into American households

In recent years, many US politicians and journalists have warned that the millennials are at the risk of ending up “poorer than their parents.” The evidence certainly suggests that the Great Recession has led to wage stagnation and high unemployment among young Americans, who have soured on the idea of achieving the American Dream.

The just-released Victims of Communism Memorial Foundation’s Annual Report on Generational Attitudes toward Socialism in America, for example, has found that 52 per cent of millennials would prefer to live in a socialist (46 per cent) or a communist (6 per cent) country. Conversely, only 40 per cent want to live in a capitalist one. Mercifully, Americans tend to associate socialism with the high-tax and high-redistribution welfare states of Scandinavia rather than the Marxist dictatorships of the days of yore.

Before they reject American-style capitalism, however, millennials should consider how prosperous ordinary Americans really are.

Economic prosperity is often measured in terms of personal income or wealth. Neither of those two measures, however, provides a full picture of people’s material wellbeing, for standards of living can increase due to either income growth or falling prices. People with stagnating incomes, for example, can experience material improvements if prices decline. Even people with falling incomes can be better off – as long as the cost of living decreases at a faster pace than incomes shrink.

As Ball State University economist Steven Horwitz wrote in his 2015 article Inequality, Mobility and Being Poor in America, “If the reason we care about incomes and wealth is because of what they enable people to consume, and thereby acquire goods that add to some broad notion of well-being, then it might also be worthwhile to look at some of the data on consumption to see what it suggests about … the real condition of the poor.”

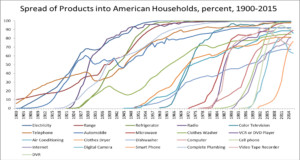
Consider the cost and adoption of home appliances. As late as 1971, only 43.3 per cent of all US households had a colour TV. By 2005, 97.4 per cent of poor American households owned one. Similar stories can be told of washing machines, dishwashers, clothes dryers, refrigerators, freezers, stoves and vacuum cleaners.

As Horwitz noted, “Poor US households are more likely to have basic appliances than the average household of the 1970s, and those appliances are of much higher quality.” Not only do more people across the income spectrum enjoy access to previously unaffordable goods, but the speed of adoption of new products is increasing.

As W Michael Cox and Richard Alm from the Southern Methodist University showed in their 2015 paper Onward and Upward: Bet on Capitalism—It Works, it took about 50 years between the time that the telephone was invented and the time that 50 per cent of US households owned one. In contrast, it took just 12 years from the emerge of the smartphone for 50 per cent of individual Americans to own one.

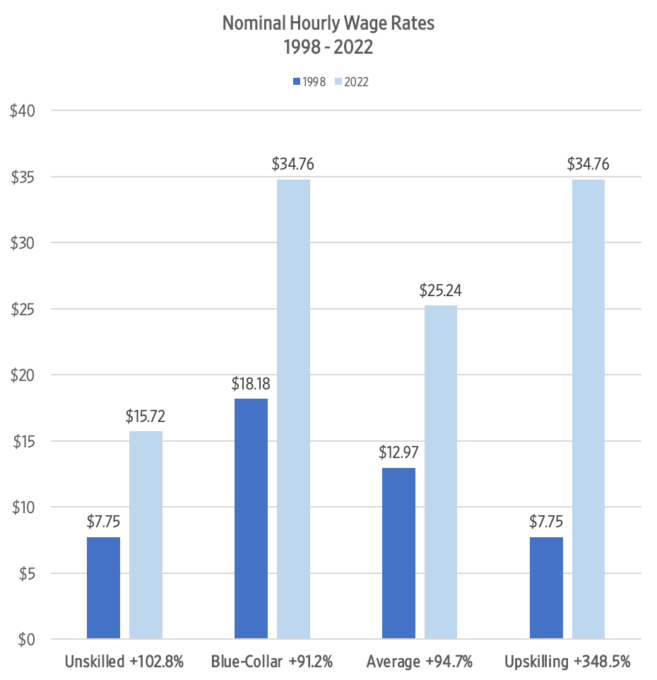
Note that all this material progress took place even though the hourly wages of many American workers stagnated. Between January 1968 and January 2018, the inflation-adjusted average hourly wage in the manufacturing sector rose from $20.43 to $21.27. Manufacturing accounts for 19 percent of all US employment and wage stagnation among factory workers may be seen as analogous to the flat-lining incomes among millennials.

Source: W Michael Cox and Richard Alm, Onward and Upward: Bet on Capitalism—It Works

Bearing the above wage numbers in mind, how come most Americans can now enjoy goods that were previously owned only by the rich?

First, it is important to note that hourly wages do not reflect the massive expansion in non-wage benefits, which rose from 19 per cent of wages in 1951 to 44 per cent in 2015. Today non-wage benefits include relocation assistance, medical and prescription coverage, vision and dental coverage, health and dependent care, flexible spending accounts, retirement benefit plans, group-term life and long-term care insurance plans, legal and adoption assistance plans, child care and transportation benefits, vacation and sick paid time-off, and employee discount programs from a variety of vendors, etc.

Also, many commonly owned goods have declined in price. In 1968, for example, a 23” Admiral colour TV cost $2,544 or 125 hours of labour in the manufacturing sector. In 2018, a 24” Sceptre HD LED TV cost $99.99 or 4.7 hours of labour in the same sector (all prices are in 2018 US dollars). That’s a reduction of 96 per cent in terms of human effort.

The upshot is that growth in nominal wages, or lack thereof, does not reflect the real changes in the standard of living experienced by vast majority of Americans. That’s something to keep in mind when young Americans contemplate the choice between capitalism and socialism.

This first appeared in CapX.

CNBC | Food Production

Chipotle Tests Automation for Burrito Bowls and Salads

“The Hyphen robot will make burrito bowls and salads for digital orders only. The technology moves the bowls underneath the digital make line to dispense the correct ingredients. Simultaneously, an employee can assemble digital orders for other items, such as tacos, quesadillas and burritos, on the digital make line. When the robot is done making an order, it sends the bowl or salad back up to the surface so employees can properly package the order.”

From CNBC.

The Human Progress Podcast | Ep. 37

Stephen Barrows: The Economic Madness of Malthusianism

The economist Stephen Barrows joins Chelsea Follett to discuss the intellectual history of population economics, the benefits of population growth, and what we can expect from a future of falling fertility.

Blog Post | Air Transport

The Gift of Flying Home for Christmas

The time price of airfares has fallen 38.1 percent in five years.

Airports will be busy again this Christmas. According to Kayak data, domestic flight searches are up 155 percent compared to 2020, though they are still 43 percent lower than in 2019.

Fortunately, we continue to enjoy the gift of decreasing airfares. The Bureau of Labor Statistics reports that since 2016, airfares have decreased in price from an index value of 270.9 to 203.8, or 24.8 percent.

Since we buy things with money but pay for them with time, we prefer to analyze the cost of airfares using time prices. To calculate the time price, we divide the nominal price by the nominal wage. That will give us the number of hours of work required to earn enough money to buy an airplane ticket.

We can calculate the time prices using data from the Bureau of Labor Statistics. They report that the nominal blue-collar hourly wage increased by 21.5 percent from $21.72 in 2016 to $26.40 in 2021.

It took 12.47 hours to earn enough money to buy the average airplane ticket in 2016. Today, it takes just 7.72 hours. That’s a decline of 38.1 percent.

For the same amount of time working, you can get 61.6 percent more airfares today than in 2016. Flying abundance has been growing at a compound annual rate of around 10.7 percent a year. At this rate, we get twice as many flights every 7.22 years.

Excerpt from our forthcoming book, Superabundance.

Blog Post | Scientific Research

The Fastest Learning Curve in History?

Human genome sequencing has become over a million times more abundant since 2003. In the near future, the price may drop another 90 percent from $1,000 to $100.

The Human Genome Project was an international effort to map the entire three-billion-letter human genome. The project launched in 1990 and concluded its work in 2003 – 50 years after James Watson and Francis Crick discovered the double-helix structure of DNA. The U.S. government contributed $3.8 billion toward the project, though the cost of the actual sequencing was lower.

Dr. Eric Green, the director of the National Human Genome Research Institute, recalled that “the first genome cost us about a billion dollars … Now when we sequence a person’s genome, it’s less than $1000, so that’s a million-fold reduction.”

Note that blue-collar worker hourly compensation (wages and benefits) rate increased by 51 percent between 2003 and 2020 (i.e., from $21.54 to $32.54). Consequently, it would have cost that worker 46,425,255 hours of work to earn enough money to buy his or her DNA sequence in 2003, but only 30.73 hours of work to do so in 2020.

The time price of DNA sequencing, in other words, dropped by 99.99993 percent. For the same hours of work required to earn the money to buy one DNA sequence in 2003, a blue-collar worker can get over 1.5 million sequences today. That amounts to over a 150 million percent increase in DNA sequencing abundance.

Now a group of Chinese entrepreneurs at the BGI hope to get the price down to $100 using a robotic arm and a roomful of chemical baths and imaging machines. Rade Drmanac, chief scientific officer of Complete Genomics, a division of BGI, noted that at $100, genetic sequencing could soon be common for every child at birth.

The National Human Genome Research Institute tracks costs associated with DNA sequencing and produced the chart below. Note the logarithmic scale on the vertical (i.e., Y) axis:

Exponential innovation occasionally experiences a double exponent or punctuation as it did in January of 2008 when DNA sequencing transitioned from the Sanger method (i.e., dideoxy chain termination sequencing) to “second generation” or “next-generation” DNA sequencing technologies.

A fall in the cost of DNA sequencing from $1,000,000,000 to $100 over 20 years would imply a compound rate of decline of 6.5 percent a month. (Adjusting for the time price puts the compound rate of decline at 7.13 percent per month.) Moore’s law indicates that prices of computing decline at 2.85 percent a month. So, the cost of DNA sequencing per genome may amount to the fastest price decline in history.

Long live learning curves. The knowledge they create is our true wealth.