fbpx
01 / 05
Africa Is Growing Thanks to the Free Market

Blog Post | Health & Medical Care

Africa Is Growing Thanks to the Free Market

Since the new millennium's start, Africa's average per capita income rose by more than 50 percent.

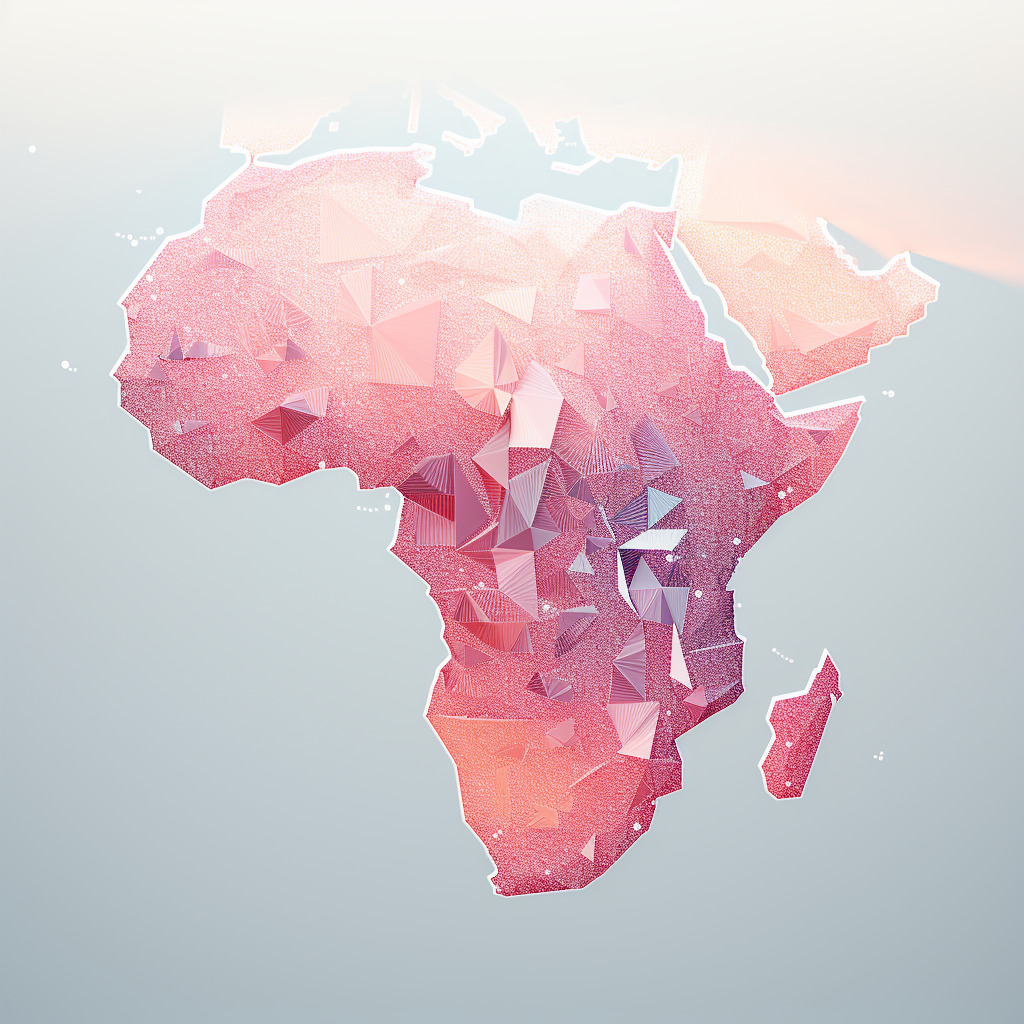
Sub-Saharan Africa consists of 46 countries and covers an area of 9.4 million square miles. One out of seven people on earth live in Africa and the continent’s share of the world’s population is bound to increase, because Africa’s fertility rate remains higher than elsewhere. If current trends continue, there will be more people in Nigeria than in the United States by 2050. What happens in Africa, therefore, is important not only to the people who live on the continent, but also to the rest of us.

Africa may be the world’s poorest continent, but it is no longer a “hopeless continent,” as The Economist magazine described it back in 2000. Since the start of the new millennium, Africa’s average per capita income adjusted for inflation and purchasing power parity rose by more than 50 percent and Africa’s growth rate has averaged almost 5 percent per year.

Increasing wealth has led to improvements in key indicators of human wellbeing. In 1999, 58 percent of Africans lived on less than $1.90 per person per day. By 2011, 44 percent of Africans lived on that income – all while the African population rose from 650 million to 1 billion. If the current trends continue, Africa’s absolute poverty rate will fall to 24 percent by 2030.

Life expectancy rose from 54 years in 2000 to 62 years in 2015. Infant mortality declined from 80 deaths per 1,000 live births to 49 deaths over the same time period. When it comes to HIV/AIDS, malaria and tuberculosis, occurrence, detection, treatment and survival rates have all improved. Food supply exceeds 2,500 calories per person per day (U.S. Department of Agriculture recommends consumption of 2,000 calories) and famines have disappeared outside of warzones. Primary, secondary and tertiary school enrollments have never been higher.

Some of Africa’s growth was driven by high commodity prices, but much of it, a McKinsey study found in 2010, was driven by economic reforms. To appreciate the latter, it is important to recall that for much of their post-colonial history, African governments have imposed central control over their economies. Inflationary monetary policies, price, wage and exchange rate controls, marketing boards that kept the prices of agricultural products artificially low and impoverished African farmers, and state-owned enterprises and monopolies were commonplace.

That began to change after the fall of the Berlin Wall. Socialism lost much of its appeal and the Soviet Union, which bankrolled and protected many African dictatorships, fell apart. Between 1990 and 2013, economic freedom as measured by the Fraser Institute in Canada rose from 4.75 out of 10 to 6.23. Freedom to trade rose even more, from 4.03 to 6.39. Most impressively, Africa has made much progress in terms of monetary policy, or access to sound money, which rose from a low of 4.9 in 1995 to a remarkable 7.27 in 2013.

Africa has made similar strides in terms of microeconomic policy. As the World Bank’s Doing Business report indicates, Africa’s regulatory environment has much improved. Starting a business, for example, has become easier, with Africa’s score rising from 45 out of 100 in 2004 to 72 in 2015. Dealing with construction permits, resolution of insolvencies, enforcement of contracts, access to electricity, the ease of payment of taxes, registering of property and getting of credit, have all much improved.

Unfortunately, there has been no substantial improvement in the quality of Africa’s institutions. According to the Freedom House’s Freedom in the World 2016 report, there were only 6 free countries in sub-Saharan Africa: Benin, Botswana, Ghana, Namibia, Senegal and South Africa. While many countries have adopted more “democratic” constitutions that include term limits, and other legislative and institutional checks on the executive branch of government, African rulers have found a way around those provisions in order to maintain power and abuse it.

According to the World Bank, corruption continues to thrive among government officials and, importantly, among members of the judiciary. As a consequence, rule of law indicators for African countries have remained, by and large, unchanged. Yet without efficient and impartial courts, Africa’s economic potential will always remain unfulfilled.

That said, as experience in other regions shows, institutional development tends to lag behind economic reforms. In the medium to long run, growth of the African middle class might yet result in a political awakening and greater assertiveness of the African populace, and eventual democratization of the continent.

The new millennium has been good to Africa, but the continent is still far from being prosperous, let alone democratic. In order for Africa’s economy to go on expanding, Africans will need to continue with their reforms – never forgetting that the world economy keeps on changing and global competition keeps on increasing. That is Africa’s challenge as well as its opportunity.

This piece was first published on CapX. 

Blog Post | Food Prices

Thanksgiving Dinner Will Be 8.8 Percent Cheaper This Year

Be thankful for the increase in human knowledge that transforms atoms into valuable resources.

Summary: There has been a remarkable decrease in the “time price” of a Thanksgiving dinner over the past 38 years, despite nominal cost increases. Thanks to rising wages and innovation, the time required for a blue-collar worker to afford the meal dropped significantly, making food much more abundant. Population growth and human knowledge drive resource abundance, allowing for greater prosperity and efficiency in providing for more people.


Since 1986, the American Farm Bureau Federation (AFBF) has conducted an annual price survey of food items that make up in a typical Thanksgiving Day dinner. The items on this shopping list are intended to feed a group of 10 people, with plenty of leftovers remaining. The list includes a turkey, a pumpkin pie mix, milk, a vegetable tray, bread rolls, pie shells, green peas, fresh cranberries, whipping cream, cubed stuffing, sweet potatoes, and several miscellaneous ingredients.

So, what has happened to the price of a Thanksgiving Day dinner over the past 38 years? The AFBF reports that in nominal terms, the cost rose from $28.74 in 1986 to $58.08 in 2024. That’s an increase of 102.1 percent.

Since we buy things with money but pay for them with time, we should analyze the cost of a Thanksgiving Day dinner using time prices. To calculate the time price, we divide the nominal price of the meal by the nominal wage rate. That gives us the number of work hours required to earn enough money to feed those 10 guests.

According to the Bureau of Labor Statistics, the blue-collar hourly wage rate increased by 240.2 percent – from $8.96 per hour in October 1986 to $30.48 in October 2024.

Remember that when wages increase faster than prices, time prices decrease. Consequently, we can say that between 1986 and 2024 the time price of the Thanksgiving dinner for a blue-collar worker declined from 3.2 hours to 1.9 hours, or 40.6 percent.

That means that blue-collar workers can buy 1.68 Thanksgiving Day dinners in 2024 for the same number of hours it took to buy one dinner in 1986. We can also say that Thanksgiving dinner became 68 percent more abundant.

Here is a chart showing the time price trend for the Thanksgiving dinner over the past 38 years:

The figure shows that the time price of a Thanksgiving dinner for a blue collar worker has gone down since 1986.
The figure shows that the time price of a Thanksgiving meal has decreased, while population, the nominal price of the meal, and hourly earnings have all increased.

The lowest time price for the Thanksgiving dinner was 1.87 hours in 2020, but then COVID-19 policies struck, and the time price jumped to 2.29 hours in 2022.

In 2023, the time price of the Thanksgiving dinner came to 2.09 hours. This year, it came to 1.91 hours – a decline of 8.8 percent. For the time it took to buy Thanksgiving dinner last year, we get 9.6 percent more food this year.

Between 1986 and 2024, the US population rose from 240 million to 337 million – a 40.4 percent increase. Over the same period, the Thanksgiving dinner time price decreased by 40.6 percent. Each one percentage point increase in population corresponded to a one percentage point decrease in the time price.

To get a sense of the relationship between food prices and population growth, imagine providing a Thanksgiving Day dinner for everyone in the United States. If the whole of the United States had consisted of blue-collar workers in 1986, the total Thanksgiving dinner time price would have been 77 million hours. By 2024, the time price fell to 64.2 million hours – a decline of 12.8 million hours or 16.6 percent.

Given that the population of the United States increased by 40.4 percent between 1986 and 2024, we can confidently say that more people truly make resources much more abundant.

An earlier version of this article was published at Gale Winds on 11/21/2024.

NBC News | Personal Income

The Typical US Worker Out-Earned Inflation by $1,400 a Year

“While higher costs for everything from milk to medicines have preoccupied U.S. consumers in the pandemic era, earnings have also risen enough, on average, to push up households’ purchasing power a bit. And blue-collar workers have been the biggest beneficiaries.

An analysis published in July by economists at the Treasury Department found that the median worker can afford the same representative basket of goods and services as they did in 2019 — plus have an additional $1,400 a year.”

From NBC News.

Wall Street Journal | Wealth & Poverty

The Dramatic Turnaround in Millennials’ Finances

“The median household net worth of older millennials, born in the 1980s, rose to $130,000 in 2022 from $60,000 in 2019, according to inflation-adjusted data from the Federal Reserve Bank of St. Louis. Median wealth more than quadrupled to $41,000 for Americans born in the 1990s, which includes the generation’s youngest members, born in 1996. 

The turnaround has been so dramatic that millennials—mocked at times for being perpetually behind in building wealth, buying homes, getting married and having children—now find themselves ahead.

In early 2024, millennials and older members of Gen Z had, on average and adjusting for inflation, about 25% more wealth than Gen Xers and baby boomers did at a similar age, according to a St. Louis Fed analysis.”

From Wall Street Journal.