The Earth was 448.5 percent more abundant in 2021 than it was in 1980.
Gale Pooley, Marian L. Tupy —
Does population growth lead to greater resource scarcity, as argued by the English scholar Thomas Malthus and, more recently, by the Stanford University biologist Paul Ehrlich? Or does population growth coincide with, and perhaps even contribute to resource abundance, as the University of Maryland economist Julian Simon has argued? The Simon Abundance Index (SAI) measures the relationship between population growth and the abundance of 50 basic commodities, including food, energy, materials, minerals, and metals.
Main Findings
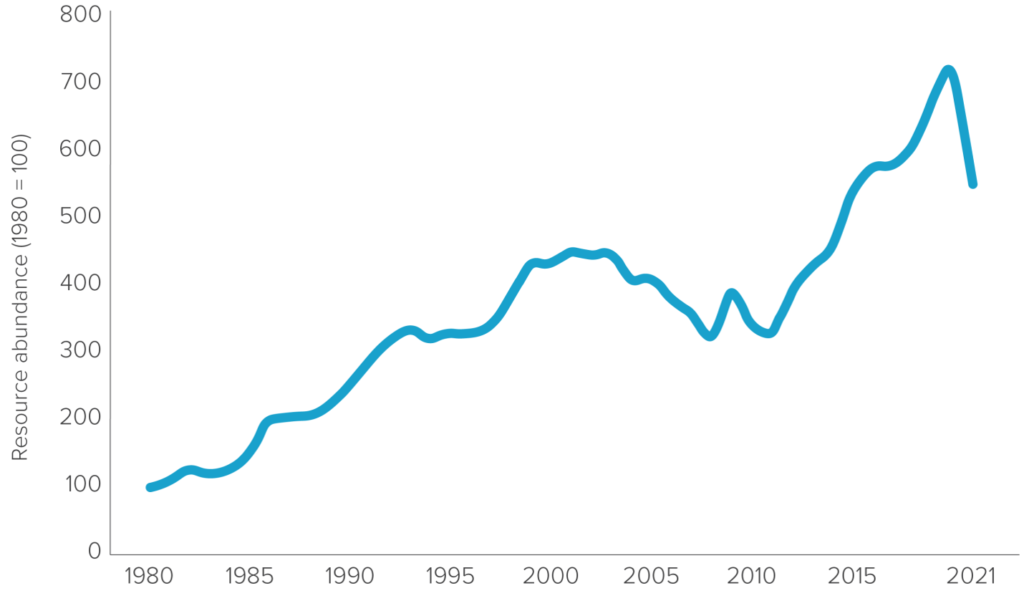
Global resource abundance fell by 22.6 percent in 2021, according to the fifth annual Simon Abundance Index. The base year of the index is 1980, and the base value of the index is 100. In 2021, the index stood at 548.5. In other words, the index rose by 448.5 percent over the last 41 years, implying a compound annual growth rate in global resource abundance of 4.24 percent and a doubling of global resource abundance every 16.7 years.
Figure 1: The Simon Abundance Index (1980–2021)
Analysis
The SAI is measured in time prices. To calculate a commodity’s time price, the nominal price of a commodity is divided by the global average nominal hourly wage. Over the last 41 years, the average nominal price of the 50 commodities rose by 103.9 percent, and the global average nominal hourly wage rose by 413.6 percent. So, the overall time price of the 50 commodities fell by 67.9 percent.
The personal resource abundance multiplier is calculated by dividing the average time price of the 50 commodities in 1980 by the average time price of the 50 commodities in 2021. The multiplier tells us how much more of a resource a person can get for the same hours of work between two points in time. The same number of hours of work that bought one unit in the basket of 50 commodities in 1980 bought 3.088 units in the same basket in 2021.
The resource abundance for the average inhabitant of the planet rose by 208.8 percent. The compound annual growth rate in personal resource abundance amounted to 2.79 percent, implying that personal resource abundance doubled every 25.2 years.
Over the last 41 years, the overall time price of the 50 commodities fell by 67.9 percent. Meanwhile, the world’s population increased by 77.6 percent. So, for every 1 percent increase in the world’s population, the average time price of the 50 commodities decreased by 0.88 percent (67.9 percent ÷ 77.6 percent = -0.88).
Note that the personal resource abundance analysis looks at resource abundance from the perspective of an individual human being. The question that we aim to answer is: “How much more abundant have resources become for the average inhabitant of the planet?”
Population resource abundance analysis, in contrast, allows us to quantify the relationship between global resource abundance and global population growth. You can think of the difference between the two levels of analysis by using a pizza analogy. Personal resource abundance measures the size of a slice of pizza per person. Population resource abundance measures the size of the entire pizza pie.
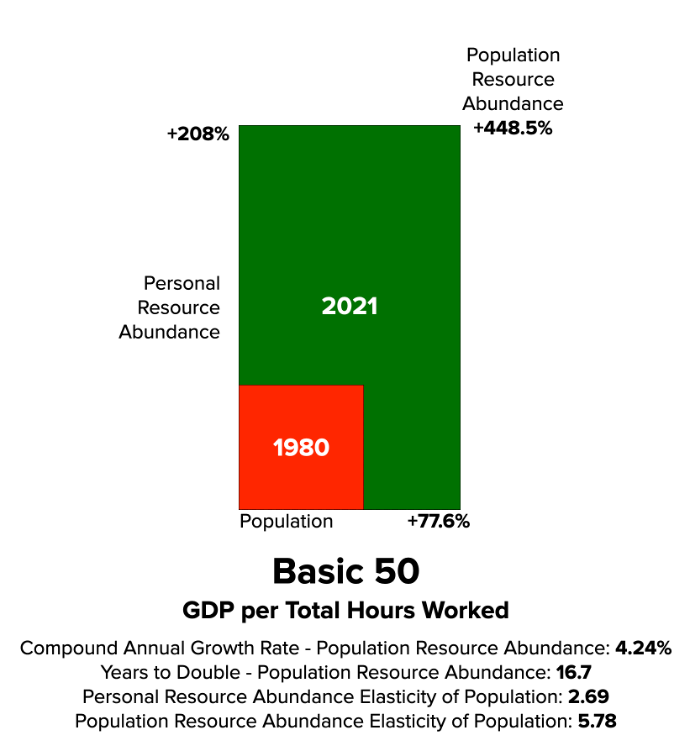
The population resource abundance multiplier is calculated by multiplying the change in personal resource abundance by the change in global population (3.088 x 1.776). The multiplier of 5.485 corresponds to the 548.5 value in the SAI 2022. It indicates an increase in the global resource abundance of 448.5 percent and a compound annual growth rate of 4.24 percent. Using these values, we can estimate that global resource abundance doubles every 16.7 years or so.
Figure 2: Visualization of the Relationship between Global Population Growth and Personal Resource Abundance of the 50 Basic Commodities (1980–2021)
Finally, let us say a few words about the resource abundance elasticity of population. In economics, elasticity measures one variable’s sensitivity to a change in another variable. If variable X changes by 10 percent, while variable Y, as a result of the change in X, changes by 5 percent, then the elasticity coefficient of X relative to Y is 2.0 (10 ÷ 5). A coefficient of 2.0 can be interpreted as a 2 percent change in X corresponding to a 1 percent change in Y.
We found that every 1 percent increase in population corresponded to an increase in personal resource abundance (the size of the slice of pizza) of 2.69 percent (208.8 ÷ 77.6). We also found that every 1 percent increase in population corresponded to an increase in population resource abundance (the size of the pizza pie) of 5.8 percent (448.5 ÷ 77.6).
Changes between 2020 and 2021
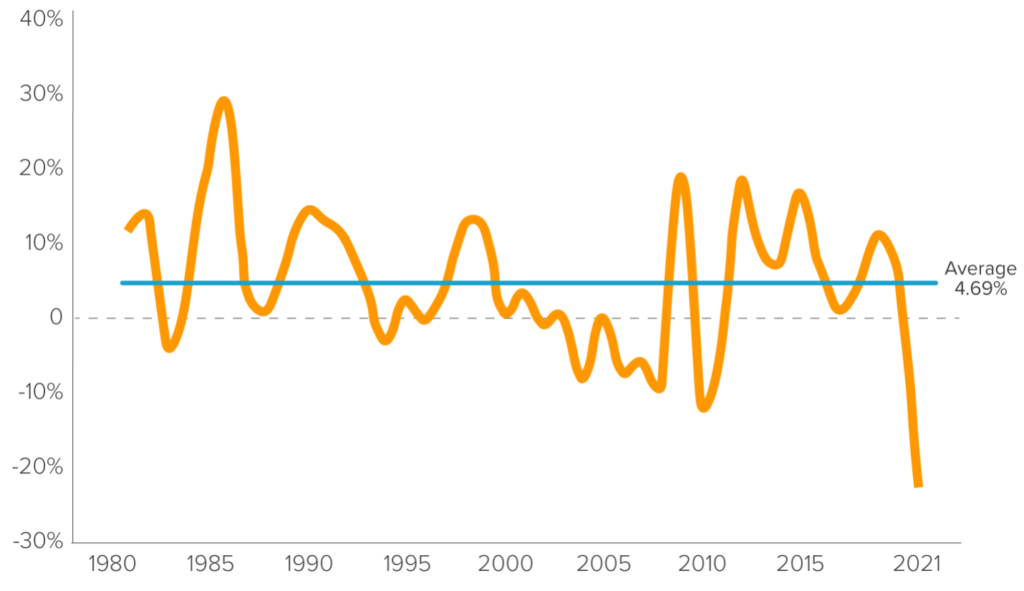
Over the last 12 months, the SAI declined from 708.4 to 548.5 (22.6 percent). This was the largest one-year drop recorded by the index. The largest previous one-year drop amounted to 11.3 percent in 2010. On average, the index increased by 4.69 percent a year between 1980 and 2021.
Figure 3: The Simon Abundance Index, Annual Percentage Change (1980–2021)
What accounts for the SAI decline between 2020 and 2021? First, although the long-term trend in resource abundance is a positive one, prices can and do move up as well as down. Julian Simon noted as much when he wrote in his 1996 book The Ultimate Resource 2,
There is no physical or economic reason why human resourcefulness and enterprise cannot forever continue to respond to impending shortages and existing problems with new expedients that, after an adjustment period, leave us better off than before the problem arose. . . . Adding more people will cause [short‐run] problems, but at the same time there will be more people to solve these problems and leave us with the bonus of lower costs and less scarcity in the long run. . . . The ultimate resource is people—skilled, spirited, and hopeful people who will exert their wills and imaginations for their own benefit, and so, inevitably, for the benefit of us all.
Second, prices and wages can be adversely affected by government policy. The COVID-19 pandemic–related restrictions on economic activity, for example, resulted in a supply shock from which many an industry is yet to fully recover. The supply shock was exacerbated by fiscal and monetary stimuli, which kept some workers from reentering the job market once the restrictions were lifted. These stimuli also resulted in a demand shock, with money flowing into real estate, the stock market, and commodities as savers attempted to protect themselves from rising inflation. Additional regulations on new resource exploration and production may have helped to reduce output, particularly in the energy sector. Finally, the spike in resource prices was greatly enhanced by the Russian invasion of Ukraine (although the conflict is not reflected in this year’s SAI).
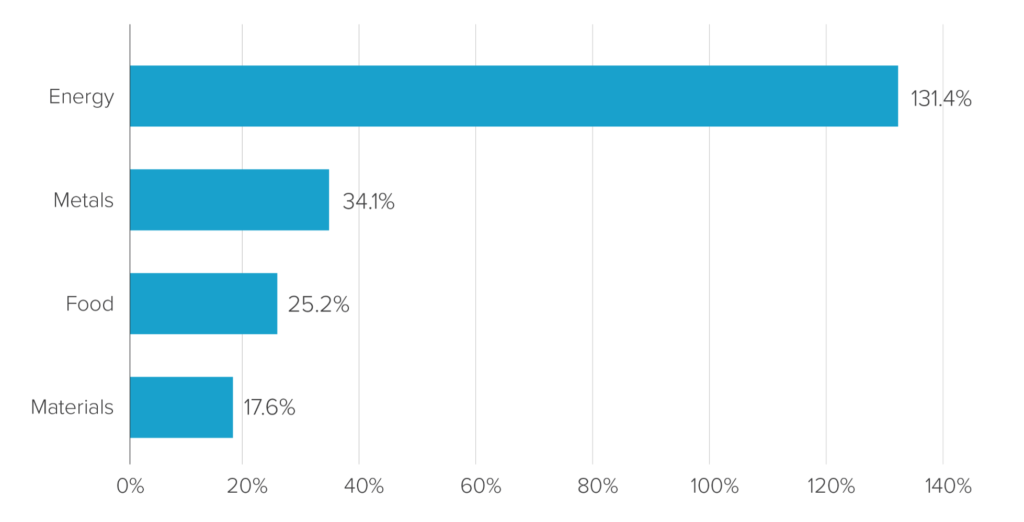
Figure 4: The Simon Abundance Index, Percentage Change in Time Prices of the Main Resource Groups (2020–2021)
Third, humanity has experienced similar shocks and accompanying reductions in resource abundance before. Mercifully, history suggests that growth in the abundance of resources can be restored. The index, for example, grew by 28.4 percent, 20.0 percent, and 19.3 percent in 1986, 1985, and 2009, respectively. When government policies and proper monetary management encourage entrepreneurship, the discovery of new knowledge and creation of new wealth can return and flourish.
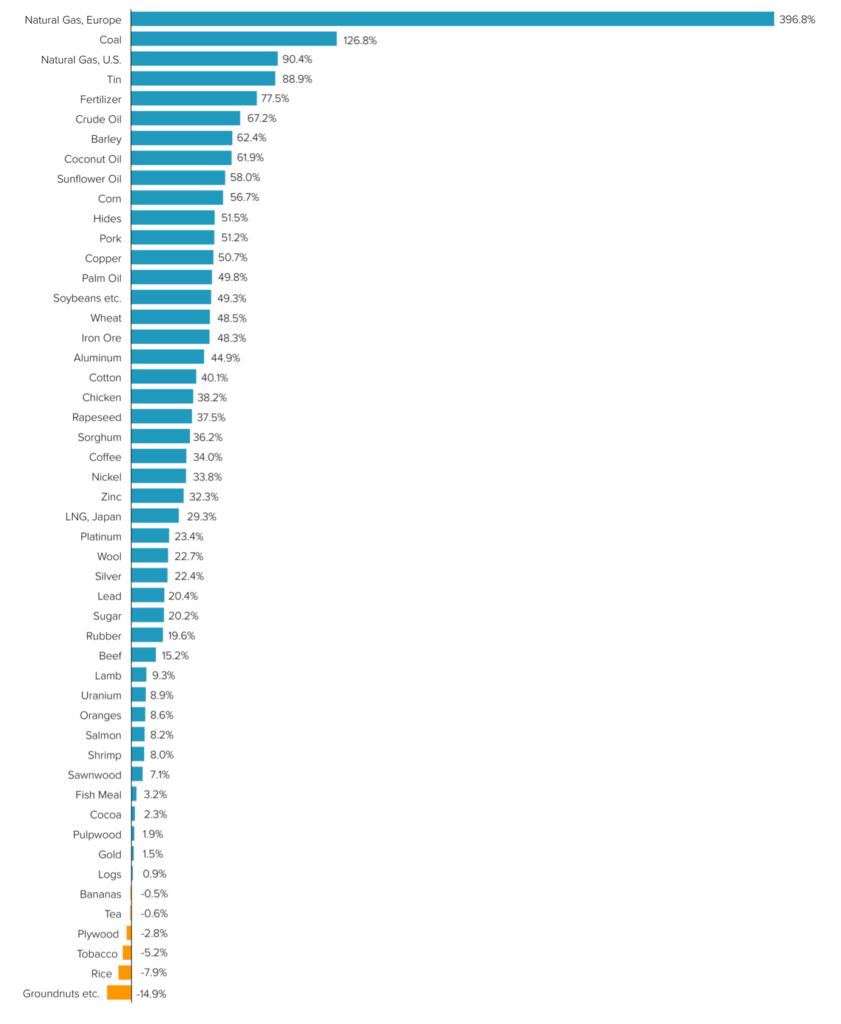
Figure 5: The Simon Abundance Index, Percentage Change in Time Prices of Individual Resources (2020–2021)