fbpx
01 / 05
What Cosmetic Surgery Innovation Can Teach Us About Healthcare Costs

Blog Post | Cost of Services

What Cosmetic Surgery Innovation Can Teach Us About Healthcare Costs

The average time price of 19 procedures has fallen by 50 percent since 1998.

Summary: Hospital services costs have surged, raising questions about the effectiveness of regulation and government intervention in the healthcare industry. To investigate the potential impact of free markets on cost trends, we examined the time prices of common cosmetic surgery procedures, which are elective and typically not covered by insurance. Our analysis reveals a significant decline in the relative time prices of these procedures, indicating increased abundance driven by innovation and market competition.


This article was published at Gale Winds on 2/21/2024.

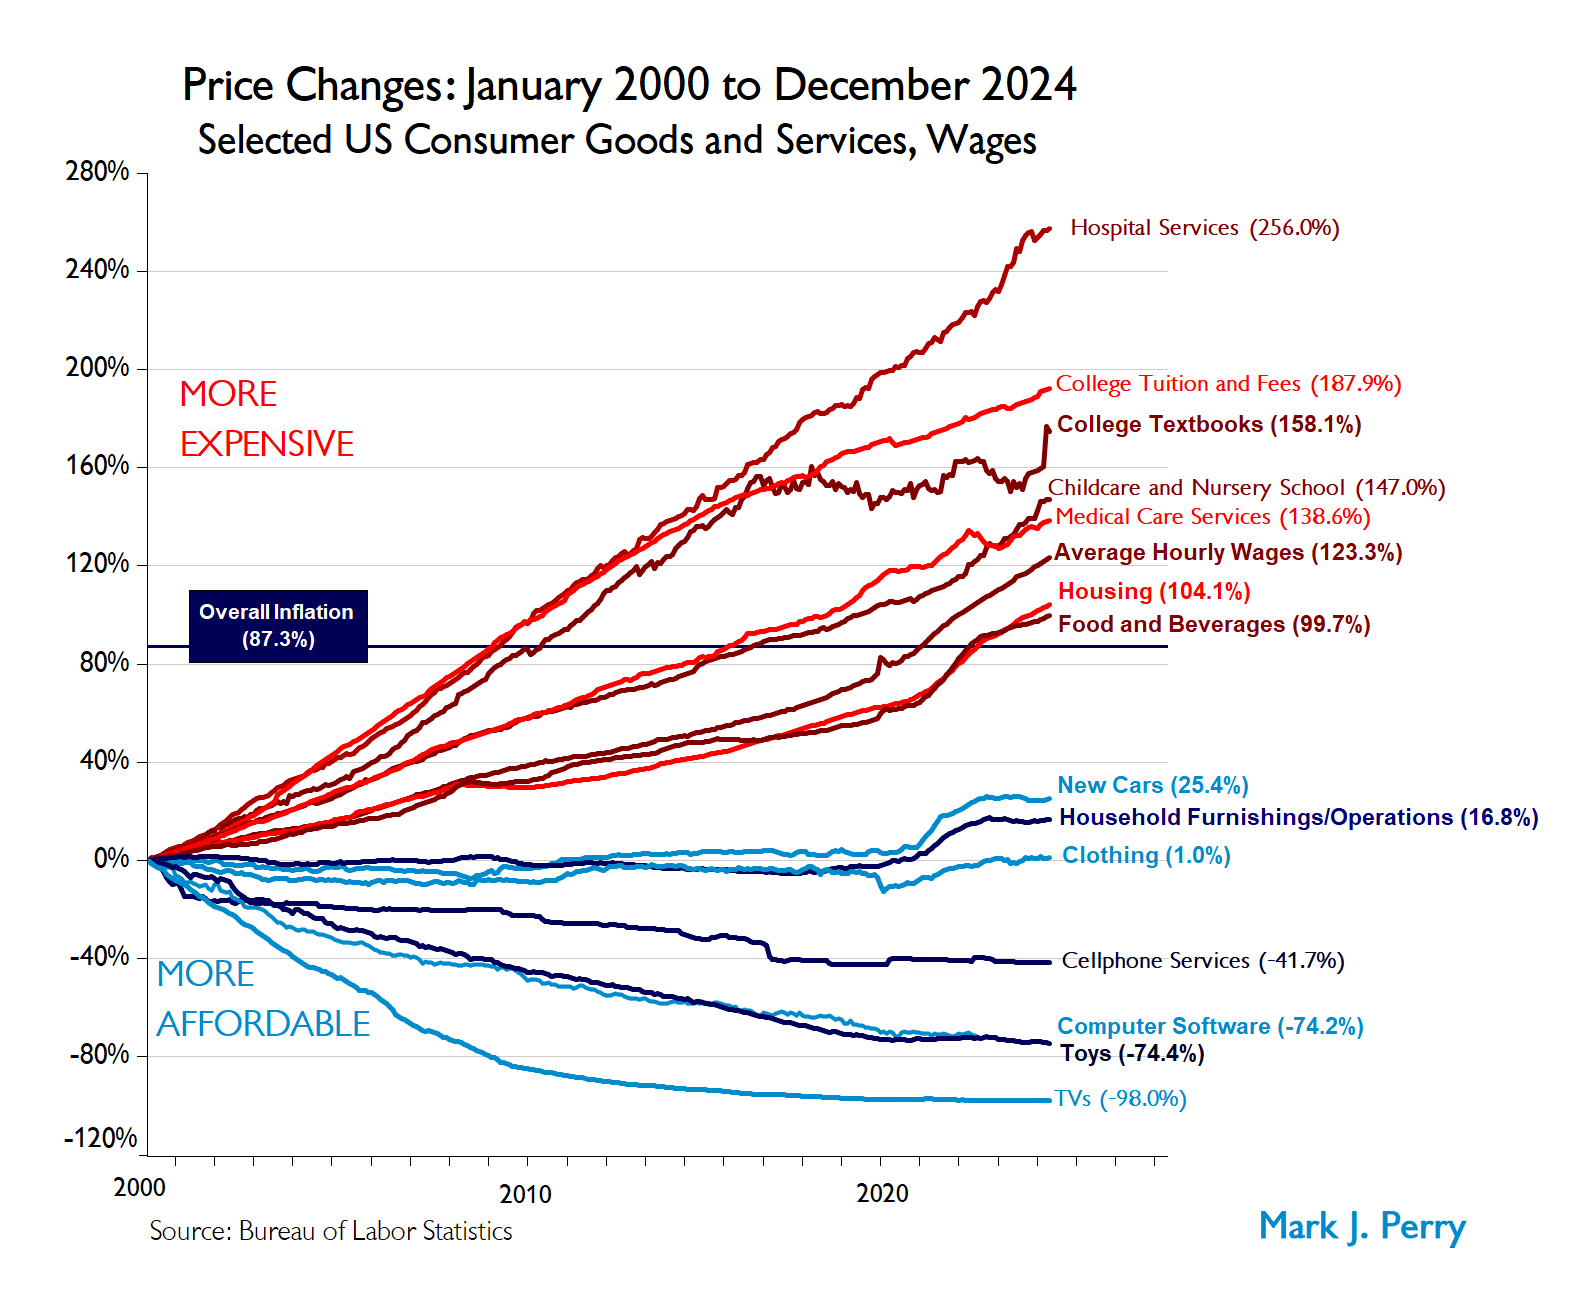
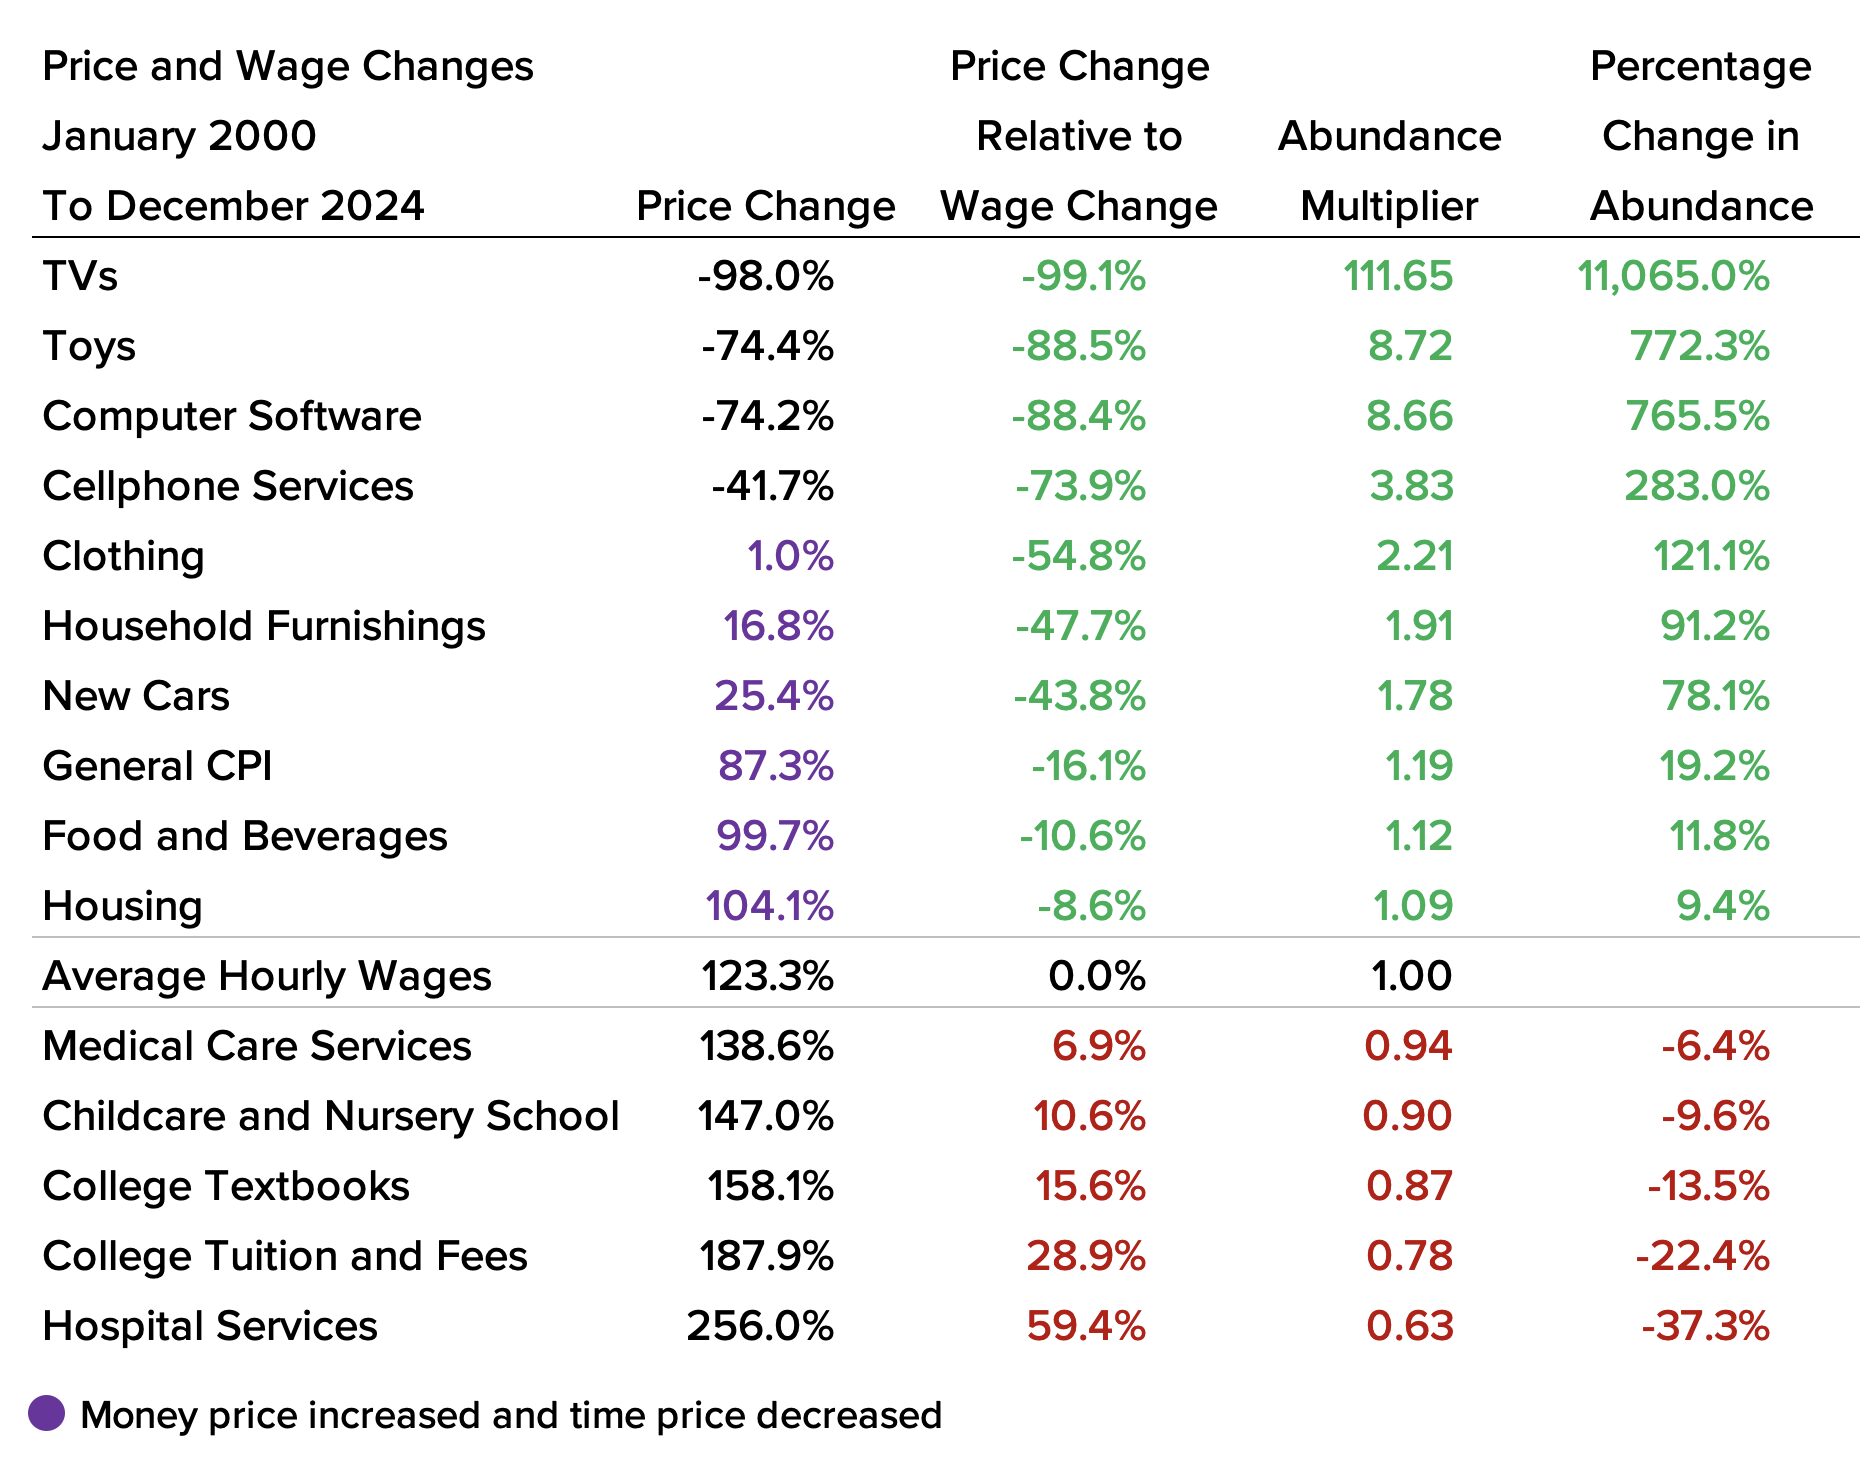
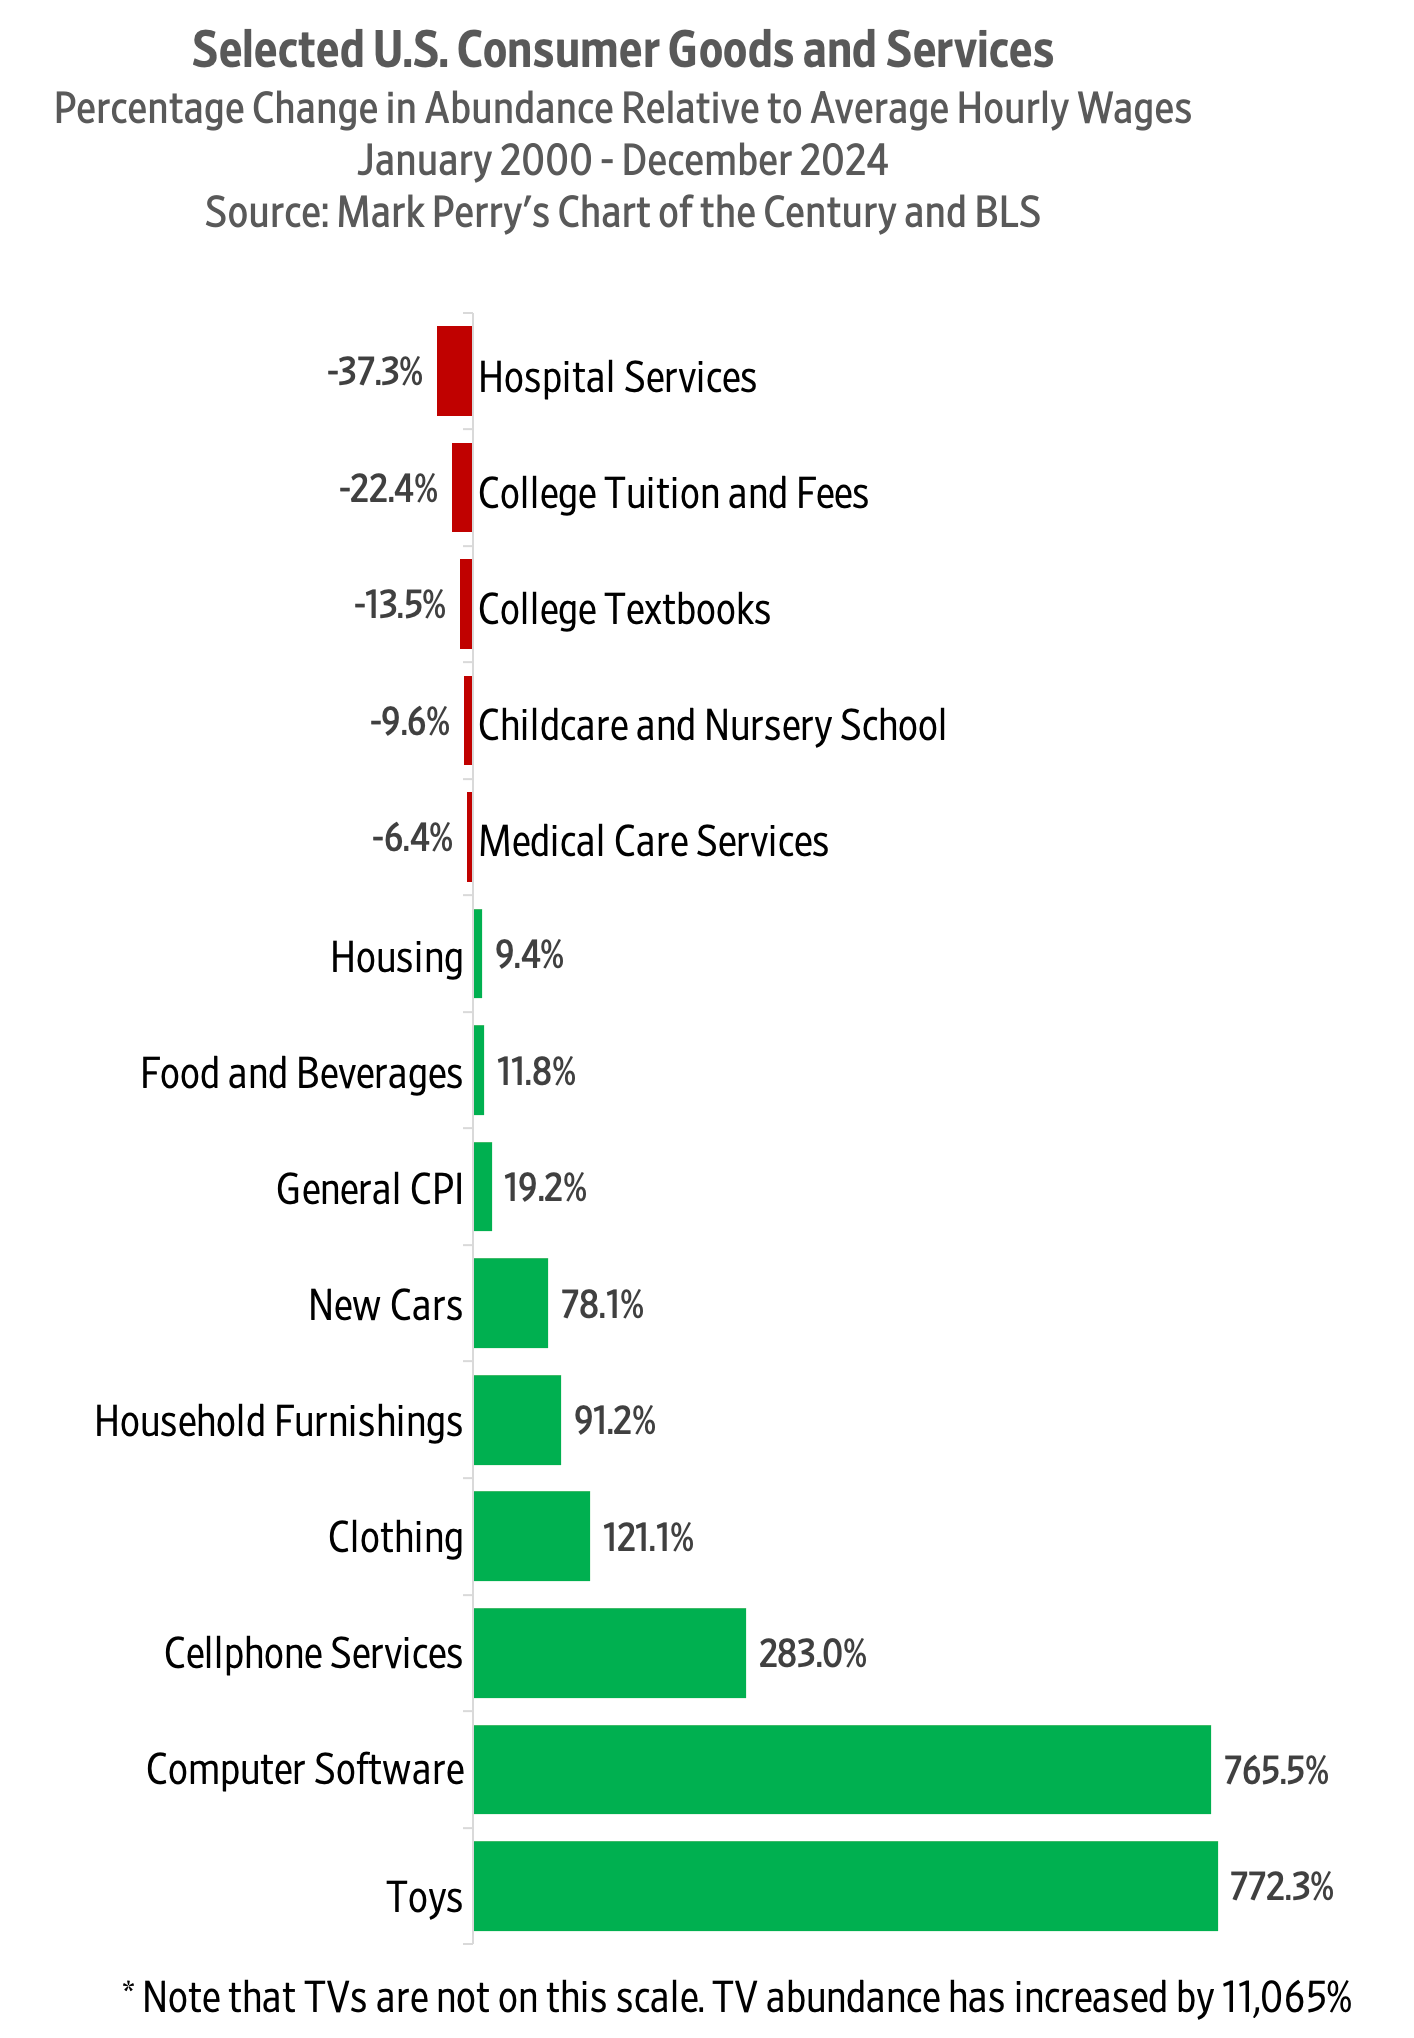
The Bureau of Labor Statistics reports that since 1998, hospital services costs have increased 61 percent faster than average wages and far outpaced consumer price index inflation. This industry is highly regulated, and government restricts supply and subsidizes demand.

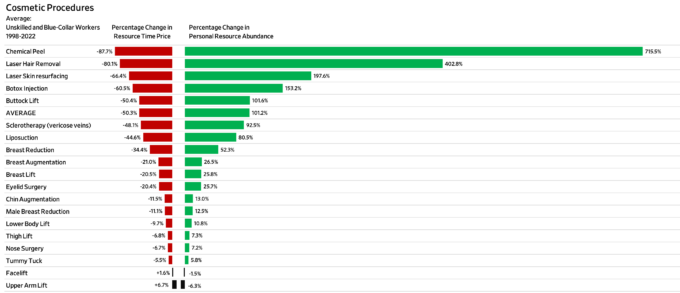
Would free markets help to reverse these cost trends? To answer this question, we looked at the time prices of 19 common cosmetic surgery procedures. These procedures are elective, and insurance companies typically don’t provide reimbursements. Cosmetic surgeons also have been relatively free to innovate, and cosmetic surgery centers are globally competitive.

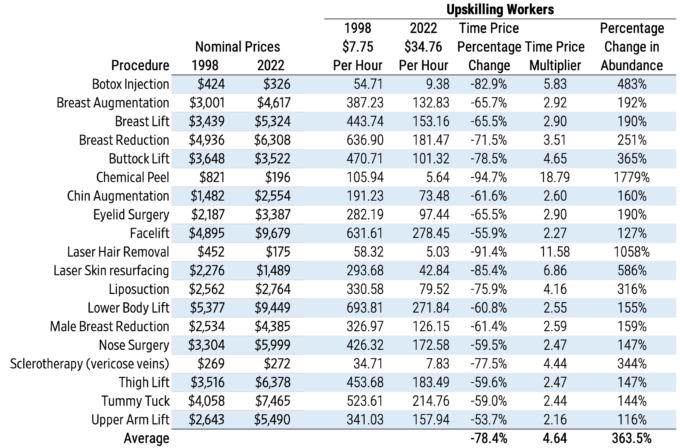
The American Society of Plastic Surgeons annually publishes prices for a variety of procedures. We compared the nominal prices from 1998 to 2022 against the average hourly wage rates of unskilled and blue-collar workers. This gave us relative time prices over time.

The average time price fell by 50.3 percent over this 24-year period. For the time it took to earn the money to pay for one procedure in 1998, you could get over two procedures today. Procedure abundance has increased by over 100 percent. The time price of chemical peels and laser hair removal fell the fastest by 87.7 percent and 80.1 percent, respectively. However, two procedure costs increased: upper arm lifts increased by 6.7 percent and facelifts by 1.6 percent.

Bar chart displaying Nominal hourly wage rates from 1998 to 2022

The above analysis compares categories of wage earners over time, but what about individuals? We typically start as unskilled workers and then advance as we acquire more productive skills, knowledge, and experience. Categories remain constant while individuals are upwardly mobile. If we look at an unskilled worker who “upskilled” to a blue-collar worker, cosmetic surgery procedures have become dramatically more abundant.

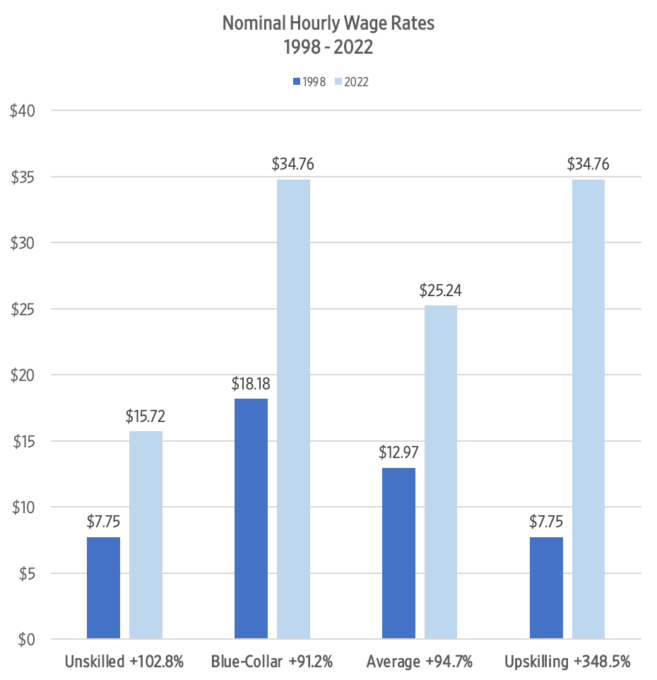
From 1998 to 2022, nominal unskilled hourly wages increased by 102.8 percent, while blue-collar hourly compensation increased by 91.2 percent. The average between these two categories is 94.7 percent. If you started out in 1998 as an unskilled worker and moved up to a blue-collar worker, your nominal hourly compensation increased by 348.5 percent.

Comparing an upskilling worker’s hourly compensation to the prices of cosmetic procedures indicates that the average time price fell by 78.4 percent. These workers could get 4.63 procedures in 2022 for the time price of one in 1998. Personal cosmetic surgery abundance increased by 363.5 percent for upskilling workers, growing at a 6.6 percent compound annual rate, doubling every 11 years or so.

Blog Post | Cost of Material Goods

The Rise of Contact Lens Abundance

Get almost 16 today for the time price of one in 1971.

Summary: Since the introduction of the first US commercial soft contact lenses, significant advancements have made them more accessible and affordable. This progress in abundance, driven by continuous innovation, underscores the importance of fostering an environment conducive to scientific and entrepreneurial advancements for the prosperity of society.


In 1971, Bausch & Lomb manufactured the first US commercial soft contact lenses. An eye doctor fitting ran around $550, and a pair of contact lenses cost $65, putting total costs around $615. Unskilled workers at the time earned about $2 an hour. This means the time price was about 307.5 hours.

Today an eye exam is about $120, and lenses start at $200 for a 12-month supply, putting the cost at $320. Unskilled workers now earn about $16.51 an hour, indicating a time price of 19.4 hours.

Unskilled workers can now get 15.9 sets of contact lenses for the time price of one set in 1971. Abundance has been growing at a compound annual rate of 5.35 percent, doubling in abundance every 13.3 years.

Today an estimated 45 million Americans wear contact lenses, of which 30 million are women. Imagine if the manufacturers of eyeglasses had used government regulation and coercion to prevent the innovation of contact lenses?

The more we make of something, the more we learn. The more we learn, the lower the price. The lower the price, the higher our standard of living. This truth was described by Adam Smith in 1776 in The Wealth of Nations.

And what is wealth? As George Gilder notes, “Wealth is knowledge and growth is learning.” The nation that is best at growing new knowledge will enjoy the greatest wealth. Artificial intelligence offers the hope that this learning process can be dramatically enhanced.

We can thank the continuous innovations of scientists and entrepreneurs in developing new contact lens designs and manufacturing techniques. America’s comparative advantage has been its visionary leadership in encouraging everyone in discovering and creating valuable new knowledge that can be shared in free markets. We cannot allow fear to blind us to these truths and prevent a future of innovation and greater prosperity.

This article was published at Gale Winds on 3/12/2024.

Blog Post | Cost of Material Goods

The Good Old Days Were Really Expensive

Most things are more abundant and affordable today.

If you had a dime in 1900, you could buy a 1-ounce Hershey chocolate bar and a 6.5-ounce bottle of Coca-Cola. It sounds like those were happy days indeed. That is until you look at wages, which were around 14 cents an hour for blue-collar workers.

At Walmart today, a 1.55-ounce Hershey bar costs $1.17 and a 1.25-liter bottle (42.27 ounces) of Coke is $1.52. Blue-collar workers earn closer to $36.15 an hour in compensation.

We buy things with money but pay for them with our time. Money prices are expressed in dollars and cents, while time prices are expressed in hours and minutes. A time price is simply the money price divided by hourly income.

In 1900, it took more than 21.4 minutes to earn an ounce of chocolate and 3.3 minutes for an ounce of Coca-Cola. By 2023, the chocolate time price had fallen to 1.25 minutes, and sodas were down to 0.06 minutes (3.58 seconds).

Chocolate cost fell 94.2 percent while cola cost fell 98.2 percent. For the time required to earn 1 ounce of chocolate in 1900, you get 17.1 ounces today, and for the time required to earn 1 ounce of Coca-Cola in 1900, you get 55.2 ounces today. Chocolate is 1,611 percent more abundant while cola is 5,425 percent more abundant.

Things can get more expensive and more affordable at the same time. This is why you must always compare prices to wages to see the true price, which is how much time things cost you.

This article was published at Gale Winds on 3/19/2024.

Blog Post | Energy Prices

Where Is Gasoline the Most Affordable?

Remember that it’s the time price, not the money price, that counts.

Summary: The affordability of gasoline varies significantly worldwide due to varying taxes and subsidies. Analyzing the GDP per hour worked against the money price per gallon shows that the United States emerges as the most affordable country for purchasing gasoline, even compared to nations where gasoline prices are heavily subsidized by the government.


According to GlobalPetrolPrices.com, the average price of gasoline around the world is USD5.03 per gallon. However, there is substantial difference in these prices among countries due to the various taxes and subsidies for gasoline. All countries have access to the same petroleum prices of international markets, but countries do not all impose the same taxes. As a result, the retail price of gasoline varies significantly.

Graph displays the gasoline price per gallon in US dollars in various countries

The money price of 16 selected countries ranges from $2.26 in Russia to $8.55 in Denmark. But what about the time price? To calculate the time price, we first calculated the GDP per hour worked in each country. The data to calculate this ratio come from the World Bank and the Conference Board.

Graph displays the GDP per hour worked in various countries

We then divided GDP per hour worked by the money price per gallon. This gave us the gallons of gasoline that one hour of work would buy in each country:

Graph displays the gallons of gasoline per GDP per hour worked in various countries

We also divided the nominal price per gallon by GDP per hour worked to get the minutes required per gallon:

This chart illustrates how much more expensive relative to the US the other 15 countries are in terms of time price:

Chart displays the cost in time price of gasoline in 15 countries

Of the 16 countries analyzed, the US is by far the most affordable place to buy gasoline. There are other countries where gasoline is more affordable, but the gasoline price in those countries is heavily subsidized by government.

Tip of the Hat: Jeremy Horpendahl

This article was published at Gale Winds on 4/1/2024.

World Bank | Water Use

The GCC’s Journey Towards Water Security

“Thanks to innovation driven by the Gulf Cooperation Council (GCC) countries, notably advancements in membrane technologies and energy efficiency, the price of desalinated water has plummeted from US$5.00 per cubic meter in the 1980s to as low as US$0.40-0.50 in recent projects. This is making desalination increasingly affordable for countries worldwide.

Beyond desalination, the GCC countries are implementing diversified water management strategies to manage water demand. One of the most important areas is the reduction of ‘non-revenue water’ (NRW) — physical and commercial losses of water.”

From World Bank.