If health care in the U.S. were as cost efficient as the delivery of cosmetic procedures, Americans would have saved $1.19 trillion last year.
Gale L. Pooley, Marian L. Tupy —
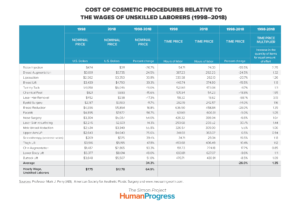
Professor Mark J. Perry from the American Enterprise Institute produces an annual report on the costs of cosmetic procedures, and hospital and medical care services. Between 1998 and 2018, the average cost of cosmetic procedures rose at a slower pace than inflation. In contrast, hospital and medical care costs rose well above inflation. Thus, while the former became more affordable, the latter became less affordable. We take Perry’s analysis a step further by looking at the time prices of cosmetic procedures and conclude with a few remarks about the cost of healthcare in America.
According to Perry’s analysis, inflation in the United States amounted to 54 percent over the last 20 years. Over the same time period, the nominal cost of 19 cosmetic procedures increased by 34 percent (unweighted average) or 32 percent (weighted average). In inflation-adjusted terms, therefore, the cost of cosmetic procedures fell. In contrast, hospital and medical care costs rose by 202 percent (four times the rate of inflation) and 110 percent (twice the rate of inflation) respectively. As Perry notes,
The competitive market for cosmetic procedures operates differently than the traditional market for health care in important and significant ways. Cosmetic procedures, unlike most medical services, are not usually covered by insurance. Patients typically paying 100 percent out-of-pocket for elective cosmetic procedures are cost-conscious and have strong incentives to shop around and compare prices at the dozens of competing providers in any large city. Providers operate in a very competitive market with transparent pricing and therefore have incentives to provide cosmetic procedures at competitive prices. Those providers are also less burdened and encumbered by the bureaucratic paperwork that is typically involved with the provision of most standard medical care with third-party payments.
Let’s interrogate Perry’s data a bit differently. Goods and services can become more affordable in two ways. First, the money price can decrease. Second, hourly income can increase. Note that incomes tend to rise faster than inflation, because people tend to become more productive over time. That’s a good thing, for as the Scottish economist Adam Smith noted in The Wealth of Nations 243 years ago, “The real price of everything…is the toil and trouble of acquiring it…What is bought with money or with goods is purchased by labor.”
The time price captures both the price fluctuations and the value of labor. As such, it better reflects the availability of goods and services in any given society. The time price can be defined as “the amount of time that a person has to work in order to earn enough money to buy something.” To calculate the time price, the nominal (or current) money price is divided by nominal hourly income. Dollars and cents are thus converted to hours and minutes of labor.
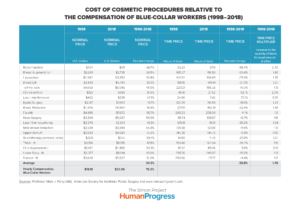
Having obtained the nominal prices of the 19 cosmetic procedures from Perry’s report, we then acquired the average hourly income data from www.measuringworth.com. This source, which is curated by Lawrence H. Officer of the University of Illinois at Chicago and Samuel H. Williamson of Miami University, includes nominal hourly wage rates of unskilled laborers and nominal hourly compensation rates of blue-collar workers. (On average, blue-collar worker receive about a third of their total compensation in benefits, including bonuses, paid leave, and company contributions to insurance and retirement plans.) What did we find?
The cost of the 19 cosmetic procedures relative to the wages of unskilled laborers fell by 26 percent on average. For the same amount of labor that an unskilled laborer had to work to earn enough money to purchase one item in our basket of cosmetic procedures in 1998, he or she could buy 1.35 items in 2018.
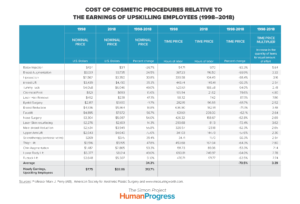
The cost of the 19 cosmetic procedures relative to the compensation of blue-collar workers fell by 31 percent on average. For the same amount of labor that a blue-collar worker had to work to earn enough money to purchase one item in our basket of cosmetic procedures in 1998, he or she could buy 1.45 items in 2018.
Finally, consider an upskilling worker, who is defined, solely for the purposes of this article, as an employee who started as an unskilled laborer in 1998, but acquired additional skills and ended up as a skilled worker in 2018. Such a worker would see the cost of 19 cosmetic procedures decline by 71 percent on average. For the same amount of labor he or she had to work to earn enough money to purchase one item in our basket of cosmetic procedures in 1998, he or she could buy 3.4 items in 2018.
Total nominal health care spending in America rose from $1.2 trillion in 1998 to $3.65 trillion in 2018. That amounts to 204 percent. In other words, the overall healthcare costs rose 6.3 times faster than Perry’s weighted average of cosmetic procedures (32 percent). If the overall provision of health care in the United States were as cost efficient as the delivery of cosmetic procedures, Americans would have spent $1.58 trillion (in 1998 dollars) on health care in 2018. That amounts to $2.46 trillion in 2018 dollars. Thus, the savings last year would have amounted to $1.19 trillion.
“Many people have a memory of some ancient, avocado-green washing machine or refrigerator chugging along for decades at their grandparents’ house. But even then, decade-spanning durability was uncommon.
Although I couldn’t find a ton of hard data on appliance lifespan over the past 40 years, nearly everyone I spoke with — service technicians, designers, engineers, trade-organization representatives, salespeople — said that kind of longevity was always the outlier, not the norm.
‘Everybody talks about the Maytag washing machine that lasts 50 years,’ said Daniel Conrad, a former product engineer at Whirlpool Corporation who is now the director of design quality, reliability, and testing for a commercial-refrigeration company. ‘No one talks about the other 4.5 million that didn’t last that long.'”
The Growing Abundance of Finished Goods: 1971-2024
1971 did not mark the beginning of an overall decline in US standards of living.
Marian L. Tupy —
Summary: Productivity, competition, and innovation have dramatically reduced the “time price” of consumer goods in the United States since 1971. The time required for a blue-collar worker to afford 75 finished goods has fallen dramatically, increasing the personal abundance available to these workers. This trend highlights the power of markets to enhance prosperity far beyond population growth, underscoring the importance of preserving economic freedom.
The website “WTF Happened in 1971?” highlights a collection of economic charts that purport to show a marked divergence in various economic, social, and financial metrics starting around 1971. The main argument presented on the website is that 1971 was a pivotal year in US economic history, primarily due to US President Richard Nixon’s decision to end the Bretton Woods system by detaching the US dollar from the gold standard. This shift allowed for fiat currency and government-controlled monetary policies, which the site argues led to inflation, income inequality, wage stagnation, and an increased cost of living.
Several economists showed that the actual picture of the post-1971 US economy is considerably less dystopian. In their 2022 book The Myth of American Inequality: How Government Biases Policy Debate,Phil Gramm, Robert Ekelund and John Early calculated that properly measured US income distribution (i.e., one that takes into account taxes and social welfare transfers) is less unequal than was the case all the way back to the late 1940s. Similarly, Scott Winship found that the “pay of the median worker . . . has risen much more slowly since the early 1970s” but noted that “the pay of American workers has tracked productivity trends.” Put differently, American workers continue to be paid what they are worth.
What about the cost of living? Mark J. Perry’s well-known “Chart of the Century” differentiates between budget items that grew more and less affordable over the last quarter of a century. When adjusted for wage growth—prices and wages can increase at the same time—Americans must work more hours to pay for hospital services, college tuition and fees, college textbooks, childcare and nursery school, and medical care services. Conversely, they must work fewer hours to afford housing (yes, you read that correctly), food and beverages, new cars, household furnishings, clothing, cellphone services, computer software, and toys.
Whether the rising cost of education and health care, for example, is due to government-created market distortions or the Baumol Effect (i.e., the phenomenon in which wages in labor-intensive industries with low productivity growth, such as health care or education, rise due to competition for workers with industries that experience high productivity growth, leading to increased costs in the former without corresponding efficiency gains), is subject of much debate. That said, it is good to remind ourselves of productivity gains that can be achieved in markets exposed to domestic and international competition and automatization.
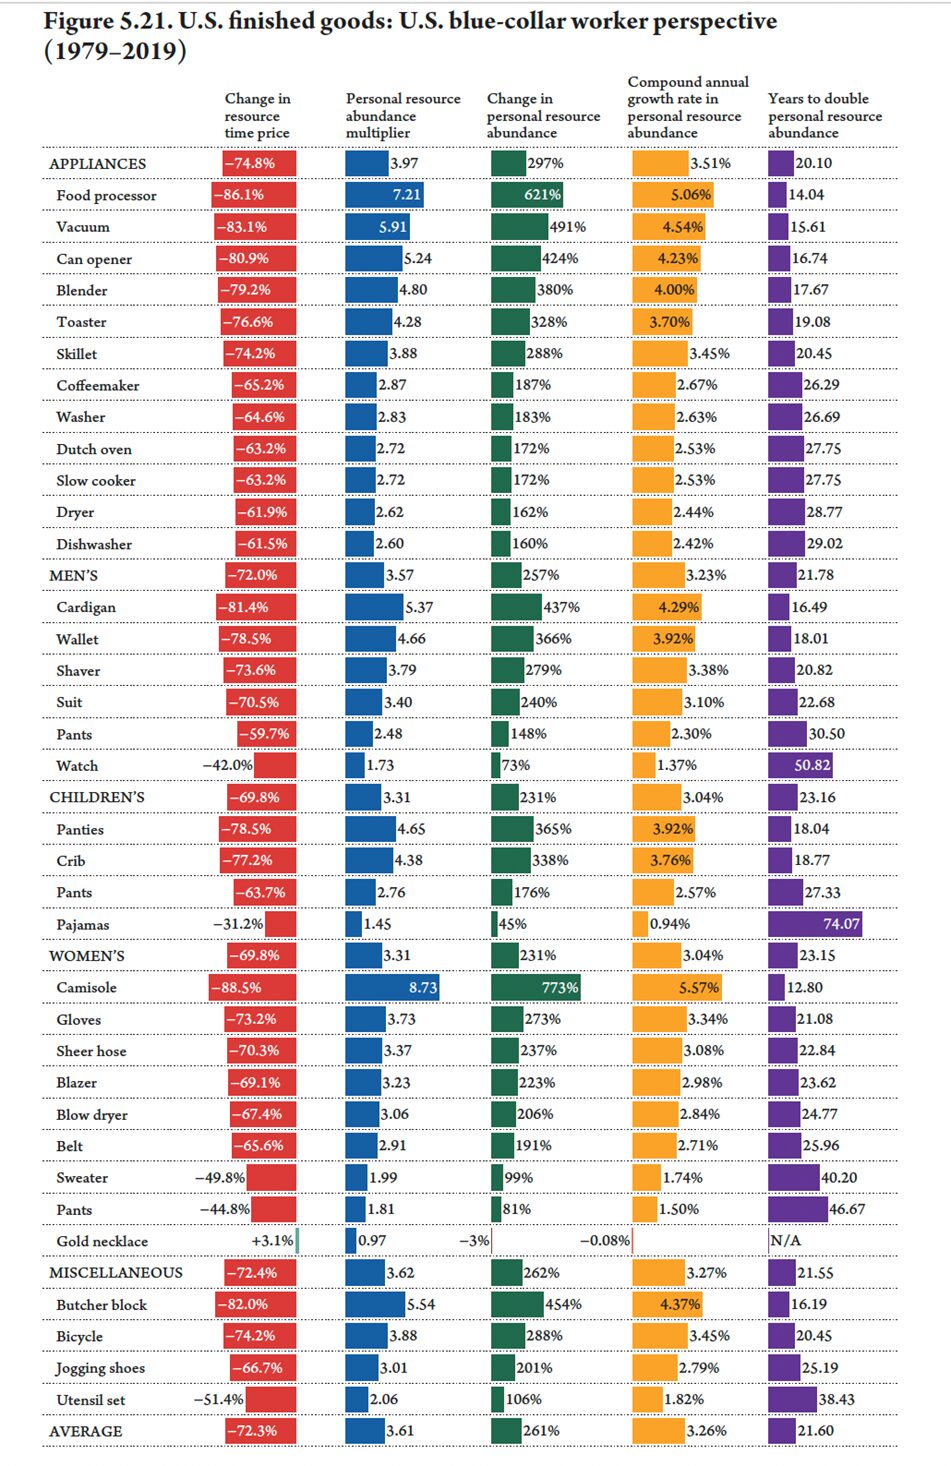
In our 2022 book Superabundance: The Story of Population Growth, Innovation, and Human Flourishing on an Infinitely Bountiful Planet, Gale L. Pooley and I looked at the time prices (i.e., the number of hours and minutes of work an American blue-collar worker has to work to buy something) of a variety of foods, fuels, minerals, and metals. One table (p. 172) is devoted to time prices of 35 finished goods between 1979 and 2019, the average time price of which fell by 72.3 percent. That means that the same length of labor that bought an American blue-collar worker one unit in the basket of 35 finished goods in 1979 got him or her 3.61 units in 2019. The worker’s personal finished goods abundance rose by 261 percent.
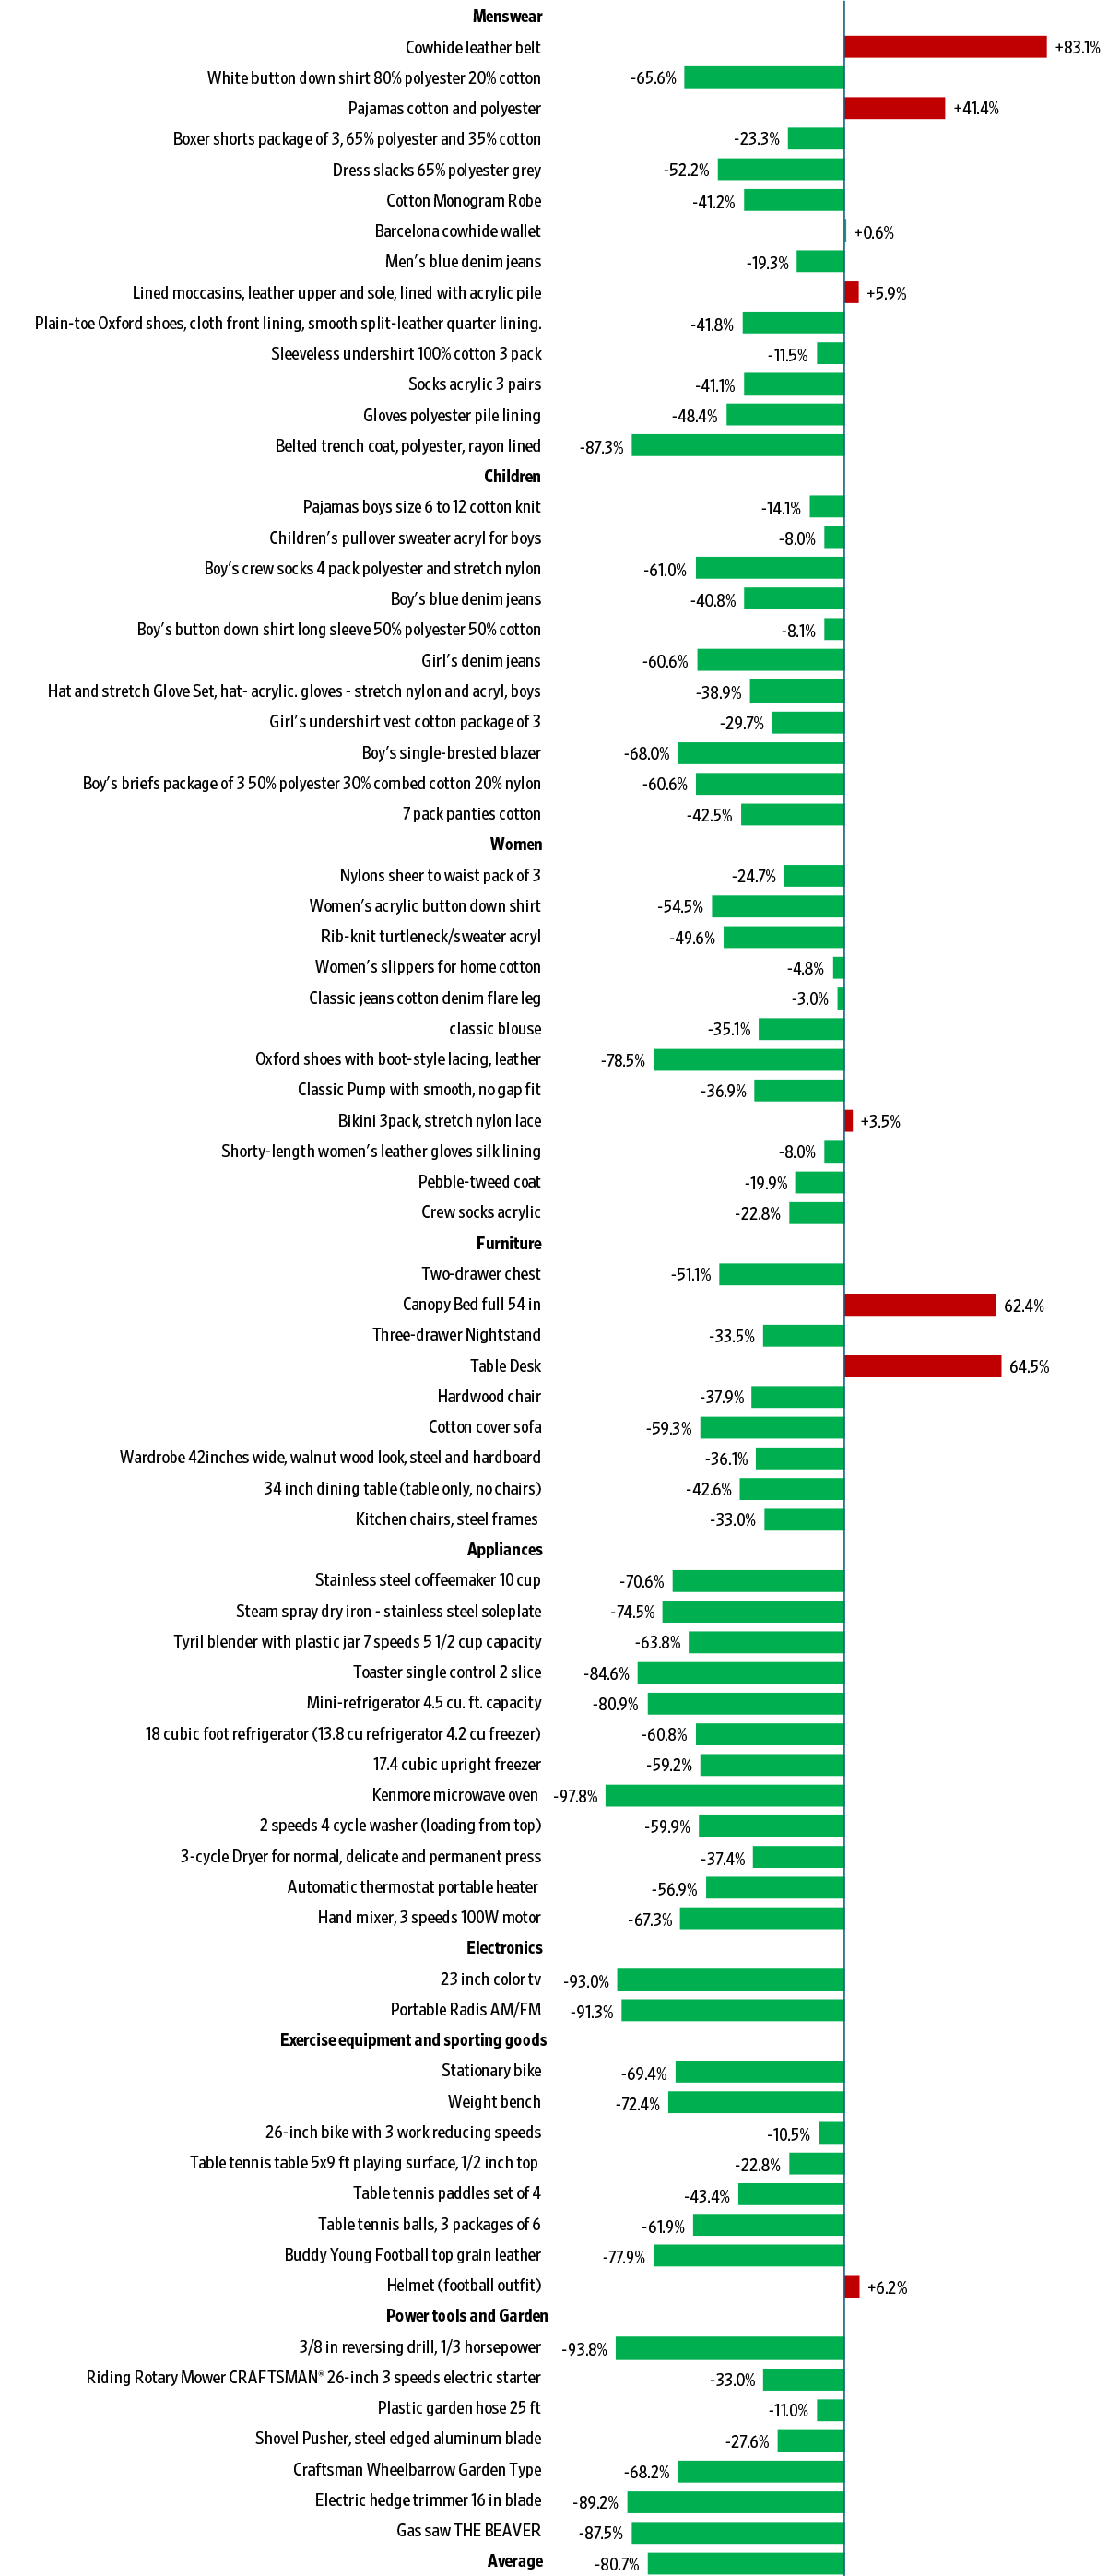
Recently, we undertook a similar exercise to ascertain the effect of the recent bout of inflation on the time prices of 75 finished goods between 1971 and 2024. The 1971 data (i.e., nominal prices of 75 finished goods) came from the 1971 Sears catalog. The 2024 data (i.e., nominal prices of similar 75 finished goods) came from Walmart, Macy’s, JCPenney, Kohl’s, Home Depot and Amazon. We divided the 1971 nominal prices of 75 finished goods by $4.26, which was the hourly compensation rate of the average American blue-collar worker in 1971. We divided the 2024 nominal prices of 75 finished goods by $37.15, which was the approximate average hourly compensation rate of the US blue-collar worker in 2024.
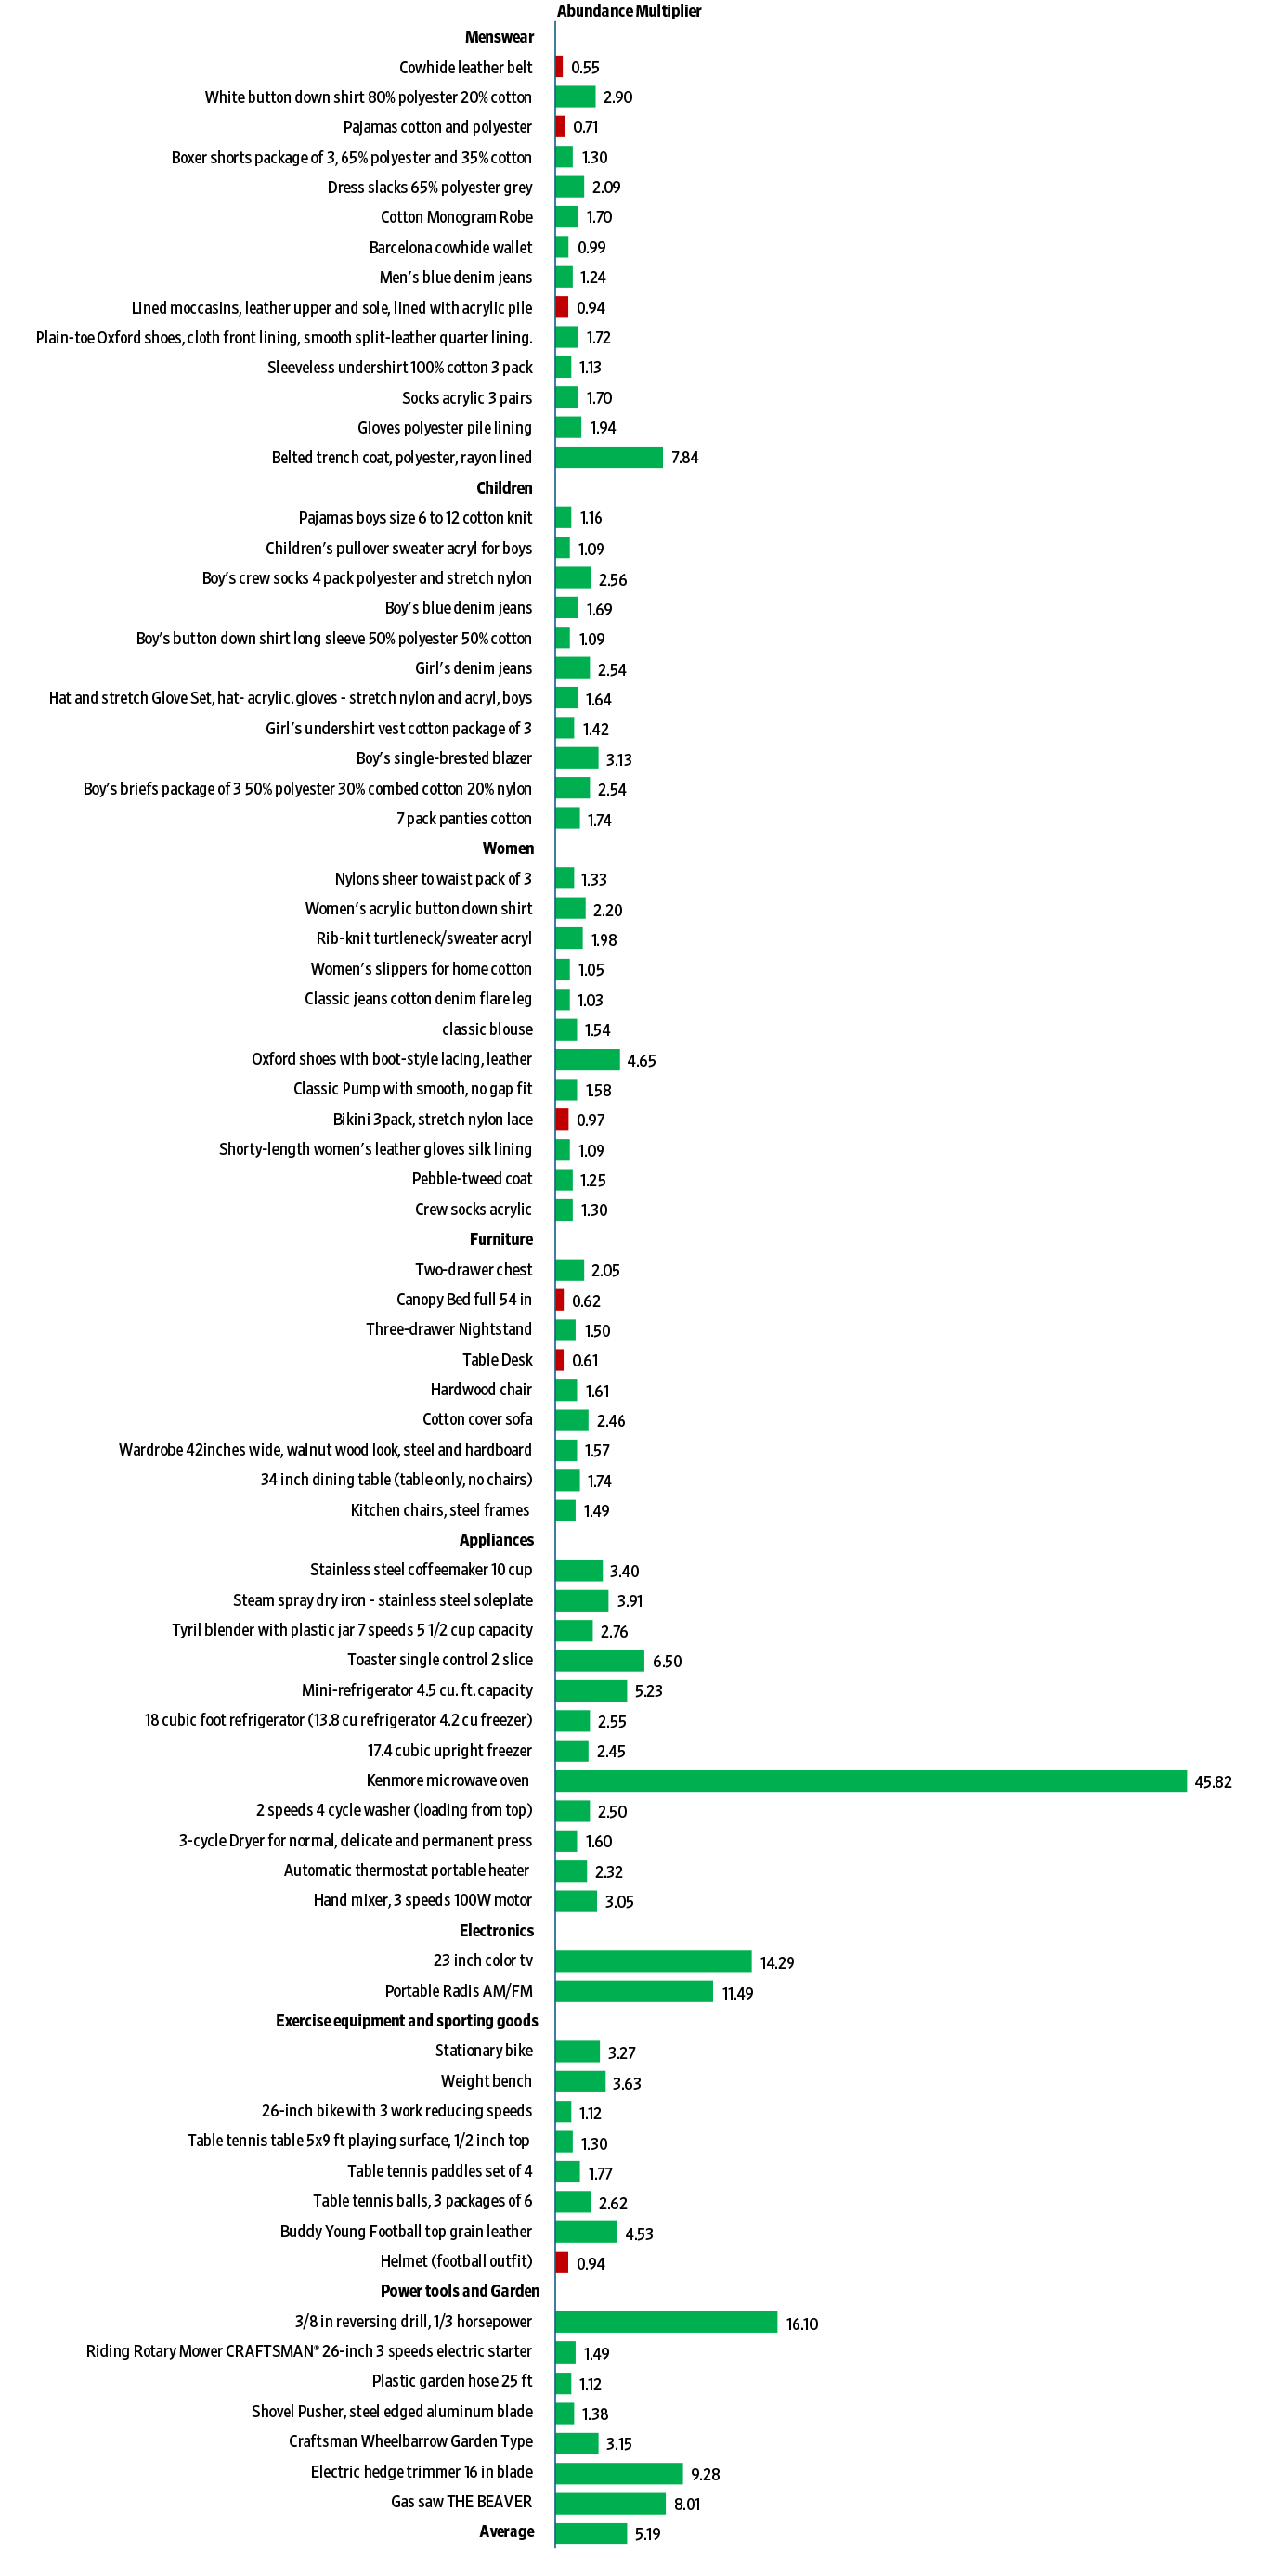
We found that the average time price of menswear, childrenswear, womenswear, furniture, appliances, electronics, sporting goods, and power tools and garden equipment fell 80.7 percent. That means that the same length of labor that bought a US blue-collar worker one unit in the basket of 75 finished goods in 1971 bought that worker 5.19 units in 2024. The worker’s personal abundance of 75 finished goods rose by 419 percent. The compound annual growth rate in personal abundance of finished goods came to 3.16 percent, indicating a doubling of personal abundance every 22.31 years. Given that personal abundance rose by 419 percent, while the US population rose only by 62 percent between 1971 and 2024, we can say that abundance rose at a superabundant rate (i.e., faster than population).
Mostly deregulated markets, where production is subject to competition and automatization, can result in substantial reduction in time price and consequent increase in abundance. Let us keep that in mind as the debate over the appropriate level of restrictions on the freedom of the market rages around the world—from the far-flung New Zealand to our own United States.
U.S. Finished Goods: U.S. Blue-Collar Worker Perspective (1971-2024)
“The push to commercialize solid-state batteries (SSBs) is underway with industries from automotive to storage betting on the technology. But while the hype around full solid-state batteries has somewhat subsided, with the technology taking longer than expected to take off, semi-solid-state batteries, which use a hybrid design of solid and liquid electrolyte, have been making steady progress toward commercialization.
TrendForce’s latest findings reveal that major manufacturers across the globe – such as Toyota, Nissan, and Samsung SDI – have already begun pilot production of all-solid-state batteries. It is estimated that production volumes could have GWh levels by 2027 as these companies race to scale up production.”
We’re All Billionaires Now (Thanks to New Knowledge)
We may not have a billion dollars in the bank, but we enjoy the benefits of many billions of dollars invested on our behalf.
Gale L. Pooley —
Summary: Modern society enjoys immense wealth through access to products created with high fixed costs but low marginal costs, thanks to mass markets. By leveraging technology and innovation, products from smartphones to streaming music and affordable medicine provide people with benefits once unimaginable. This abundance illustrates capitalism’s ability to generate shared prosperity, contrary to the views of critics who focus solely on the relative distribution of wealth.
Sen. Bernie Sanders (I-VT) has tweeted “There should be no billionaires.” Compared to 100 years ago, the United States is a country where everyone is a billionaire. We may not have a billion dollars in the bank, but we enjoy the benefits of many billions of dollars invested on our behalf in the products and services we use every day. Let me explain.
Fixed costs and marginal costs. In economics, we consider the cost to create a new product and then the cost to manufacture each additional unit. Many products have high fixed costs but low per unit costs when manufactured at scale. This per unit cost is also called marginal cost. The marginal costs on some products can reach zero.
More people mean we are all richer. We can enjoy products with such high fixed costs and low marginal costs because there are so many of us. Creators of these high fixed costs products can recoup these costs from millions, if not billions, of customers. The Scottish economist Adam Smith understood that in 1776. If you want to get rich, have lots of potential customers. Large markets also allow people to develop their skills and specialize in such things as drug and software development. The bigger the population and the more we specialize, the more variety and lower costs we enjoy in the marketplace.
Here are five examples:
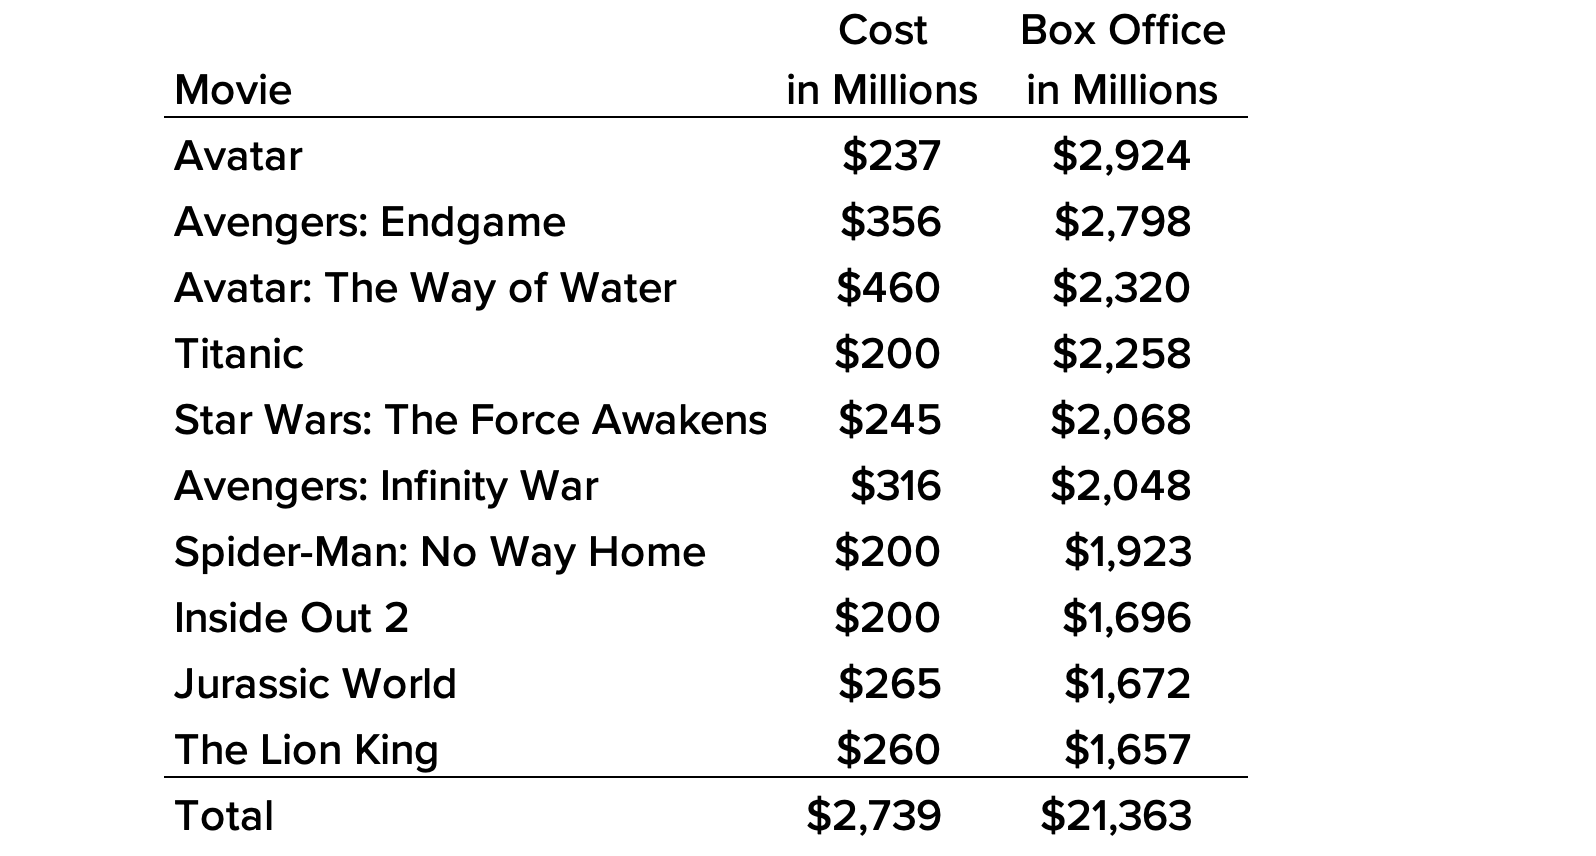
Movie billionaires. The top 10 highest-grossing films cost a total of $2.8 billion to create. You can now stream those movies at home on your $250, 55-inch large-screen high-definition TV along with 1,900 other movies for around $9.99 a month on Disney+. Unskilled workers earn around $17.17 an hour today, so it takes around 14.5 hours to buy the TV and 35 minutes of work each month to enjoy this multibillion-dollar benefit.
iPhone billionaires. It’s estimated that Apple spent $150 million over three years to develop the first iPhone, which was released in 2007. It sold for $499. How could it be sold so cheap if it cost so much? According to CNBC, Apple has sold over 2.3 billion iPhones and has over 1.5 billion active users. That’s how.
In 2009, Apple spent $1.33 billion on research and development. This year, it will have risen to $32 billion. The company has spent $208 billion on developing new products over the past 16 years. About half of Apple’s revenue comes from iPhone sales. Assuming half of its research and development investment has gone into the iPhone, we are enjoying a product that costs over $100 billion for about $30 a month, or around an hour and 45 minutes of work for a typical unskilled worker.
Note: In 2009, Amazon spent $1.24 billion on research and development, similar to Apple. This year, it expects to spend over $85 billion. In the past 16 years, Amazon has spent $485 billion.
Medicine billionaires. The cost to develop a new drug is estimated to range from less than $1 billion to more than $2 billion. The U.S. Congressional Budget Office notes, “Those estimates include the costs of both laboratory research and clinical trials of successful new drugs as well as expenditures on drugs that do not make it past the laboratory-development stage, that enter clinical trials but fail in those trials or are withdrawn by the drugmaker for business reasons, or that are not approved by the FDA.” Once a drug is approved, the marginal cost can be very low, maybe under a dollar.
If it costs $1 billion to develop a new drug, but each new unit of the pill only costs a dollar, how much should you charge the customer for it? The answer depends on the size of the market. If the market is 1,000 people, your costs will be $1 billion plus $1,000. You would have to sell each pill for $1 million plus $1 to break even. If your market was a million people, the breakeven price would drop to $1,001. If your market was a billion potential customers, the price per pill drops to $2.00. This is why new drugs are typically developed for widespread medical conditions. The fixed costs must be spread across a sufficiently extensive market. This is amazing when you think about it. You get a pill that required $1 billion to develop for $2.00 if a billion other people have the same medical problem.
Book billionaires. The Harry Ransom Center estimates that before the invention of the printing press, the total number of books in Europe was around 30,000. The United Nations Educational, Scientific and Cultural Organization estimates there are roughly 158,464,880 unique books in the world as of 2023.
When Gutenberg innovated printing in 1440, an average book cost around 135 days of labor, ranging from 15 days for a short book to 256 days for a major work. If workers put in eight hours a day, they’d have to work 1,080 hours to afford an average book. Today, blue-collar compensation (wages and benefits) is around $37 an hour. If there had been no printing innovation, it would cost about $40,000 to buy a book today.
Google has become the new Gutenberg. It has a library of more than 10 million free books available for users to read and download. Assuming the average book is around 250 pages and a half inch thick, you would need a bookshelf around 80 miles long to hold this library.
Before Gutenberg and his press, Google and the internet, Amazon and its digital tablet, and the manufacture of computer memory chips, it would have cost $400 billion to have a library of 10 million volumes. It would have taken 5.4 million people working full time for a year to create this library in 1439.
Today, you can have this library for around $43. That’s $35 for the tablet and $8 for the 2 TB memory stick. Another valuable feature we enjoy today is being able to search for a word or phrase in any of these books.
Music billionaires. Thomas Edison developed the original phonograph record in 1877. Suddenly people did not have to be present at a live performance to hear music. In 1949, RCA Victor became the first label to roll out 45 RPM vinyl records, and by the 1950s, the price was around 65 cents each. Unskilled workers at the time were earning around 97 cents an hour. This put the time price of a song at 40 minutes.
Steve Jobs introduced the iTunes Store on April 28, 2003, and sold songs for 99 cents. By this time, unskilled wages had increased to $9.25 an hour. The time price of a song had dropped 84 percent to 6.42 minutes. Listeners in 2003 got six songs for the price of one in 1955.
Apple Music was launched on June 30, 2015. Today, a student can access 90 million songs for $5.99 a month. Soundcloud is another popular music streaming service with over 320 million songs priced at $4.99 a month, or 18 minutes of time for an unskilled worker.
In 1955, the time to earn the money for an unskilled worker to buy the Soundcloud catalog of 320 million songs on 45 RPM records would have taken 106,666,667 hours. At today’s rate of $17.17 an hour, it would have cost $1,831,466,666.
Capitalist billionaires. Under capitalism, the only way wealth can grow is if entrepreneurs create it in the form of new products and services. Becoming a billionaire is a by-product of how successful a person is at creating and producing. When someone creates a product based on knowledge, it is non-rivalrous. (Paul Romer won a Nobel prize economics in part for explaining this truth.) Non-rivalry means we can all use a product at the same time. It’s as if we all own the product. Knowledge products make us all billionaires.
Bernie Sanders’s does not seem to understand or appreciate these economic truths. He wants to expropriate capital from Elon Musk and other innovators and give the money to his fellow politicians and bureaucrats to enrich their friends and supporters. Once this capital is seized, however, entrepreneurs will be much less motivated to create more. Ask all the entrepreneurs who lived in the former Soviet Union, and those in China under Mao Zedong, how 100 percent taxation disincentivized them from creating and taking risks.
This article was published at Gale Winds on 11/7/2024.