
01 / 05
New Study Reveals that U.S. Poverty Has Plunged

Blog Post | Wealth & Poverty

New Study Reveals that U.S. Poverty Has Plunged

The most reliable indicators of wealth clearly show that American poverty is in decline.

The government says that America’s poverty rate is 11.8 percent. It also says that the poverty rate has hovered around 11 to 15 percent since 1970 suggesting little or no progress against poverty in decades.

But the Census Bureau’s official poverty rate is biased upwards and kind of meaningless. In terms of material well-being, families near the bottom are much better off today than in past decades because of general economic growth and larger government hand-outs.

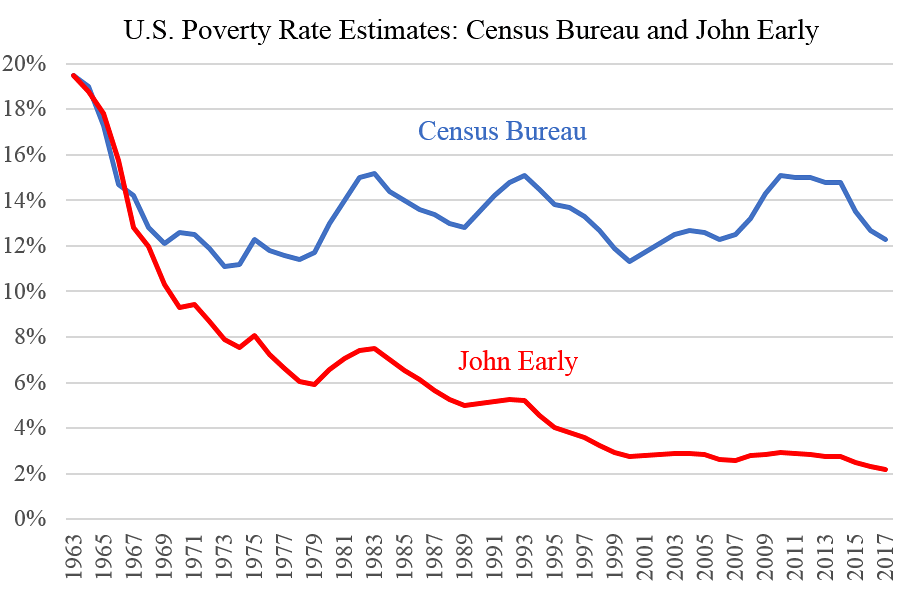
In a Cato study, John Early recalculated the U.S. poverty rate using more complete data and found that it fell from 19.5 percent in 1963 to just 2.2 percent in 2017. (The study’s charts are updated here.) Early is a former Assistant Commissioner of the Bureau of Labor Statistics.

Bruce Meyer and James Sullivan perform a similar exercise in this new study. They find that the poverty rate fell from 13.0 percent in 1980 to 2.8 percent in 2018. Meyer-Sullivan calculate their figure based on consumption rather than income, but the general idea is the same. Meyer is at the University of Chicago and Sullivan is at the University of Notre Dame.

The Early and Meyer-Sullivan estimates are charted below. Both estimates reflect a large reduction in material deprivation for less fortunate Americans. Unfortunately, this great news about the American economy is usually ignored in media reports and political discussions.

Both Early and Meyer-Sullivan use a more accurate inflation measure than the one used for adjusting the official poverty rate each year. And they both correct for the fact that the Census—in its main poverty series—excludes numerous government benefits including Medicaid, food stamps, and earned income tax credits. Both studies make a number of further adjustments.

The charts below show the Early and Meyer-Sullivan poverty rates compared to the official Census series. Note that all poverty rate calculations stem from essentially arbitrary poverty thresholds measured in relation to a chosen base year. John Early anchors his series to the official rate in 1963. Meyer-Sullivan anchor their series to the official rate in 1980.

The important thing is not the calculated poverty rate in any particular year but the trend over time. The official series shows no sustained improvement in poverty in recent decades, while the better estimates from Early and Meyer-Sullivan suggest large gains for households near the bottom.

In sum, using somewhat different methods, Early and Meyer-Sullivan both show that the official poverty data is far too pessimistic.
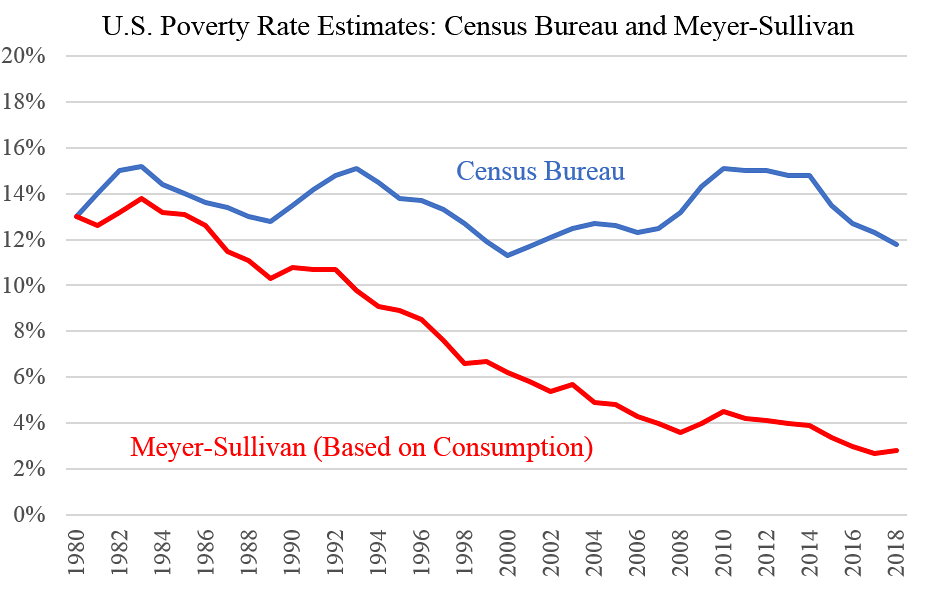
I interpolated the value for 1982 in Meyer-Sullivan.

This originally appeared in Cato at Liberty. 

New York Times | Household Income

US Real Median Household Income Hit a Record in 2025

“The financial well-being of Americans held relatively steady last year, even as the cost of living continued to climb.

The poverty rate was 13.1 percent in 2025, the same as in 2024, according to data released on Tuesday by the Census Bureau. Poverty for children and people over age 65 did not change, while poverty among those without a high school degree rose. The share of Americans without health insurance stayed level.

Median household income improved last year to $87,460, the highest level on record, adjusted for inflation.”

From New York Times.

United Nations | Household Income

Remittances to Developing Nations Nearly Double

“Migrants sent $728.6 billion home to families in low and middle-income countries in 2025, nearly double the amount recorded a decade earlier, according to a new report from the UN’s International Fund for Agricultural Development (IFAD).

These transfers, known as remittances, grew by 94 per cent between 2016 and 2025, far outpacing the 28 per cent increase in the number of migrants from those countries.

The gap shows that growth is not simply the result of more people migrating: on average, migrants abroad are sending larger amounts home.

Some 220 million migrants and people from the diaspora support an estimated 1.1 billion relatives.”

From United Nations.

Wall Street Journal | Household Income

US Incomes Climbed Last Year, Census Bureau Says

“Household incomes rose last year for the first time since the Covid-19 pandemic began, reflecting the effects of easing inflation and a strong job market.

The new data from the U.S. Census Bureau on Tuesday signaled an improvement in 2023 after inflation that spiked to a 40-year-high the prior year swallowed up household income gains.

Inflation-adjusted median household income was $80,610 in 2023, up 4% from the 2022 estimate of $77,540, the bureau said in its annual report card on households’ financial well-being. This move returned incomes to about where they were in 2019, the peak that was hit just before the pandemic.”

From Wall Street Journal.

Wall Street Journal | Wealth & Poverty

The Dramatic Turnaround in Millennials’ Finances

“The median household net worth of older millennials, born in the 1980s, rose to $130,000 in 2022 from $60,000 in 2019, according to inflation-adjusted data from the Federal Reserve Bank of St. Louis. Median wealth more than quadrupled to $41,000 for Americans born in the 1990s, which includes the generation’s youngest members, born in 1996. 

The turnaround has been so dramatic that millennials—mocked at times for being perpetually behind in building wealth, buying homes, getting married and having children—now find themselves ahead.

In early 2024, millennials and older members of Gen Z had, on average and adjusting for inflation, about 25% more wealth than Gen Xers and baby boomers did at a similar age, according to a St. Louis Fed analysis.”

From Wall Street Journal.