
Summary: Economist Mark Perry’s “Chart of the Century” reveals that many goods—from TVs to clothing—have become significantly more affordable since 2000, while heavily regulated sectors like healthcare and education have not done so well. Focusing on time prices rather than dollar amounts provides a clearer picture of improving living standards. Since 2000, the Consumer Price Index (CPI) has increased by 89.9 percent, but average hourly wages have increased by 127.4 percent. On average, an hour of your time will buy 19.7 percent more goods and services now than it would have in 2000.
It’s time for our semiannual update of Professor Mark Perry’s chart showing the percentage change in nominal prices for various US consumer goods and services alongside changes in average hourly wages. Perry’s data come from the Bureau of Labor Statistics (BLS).
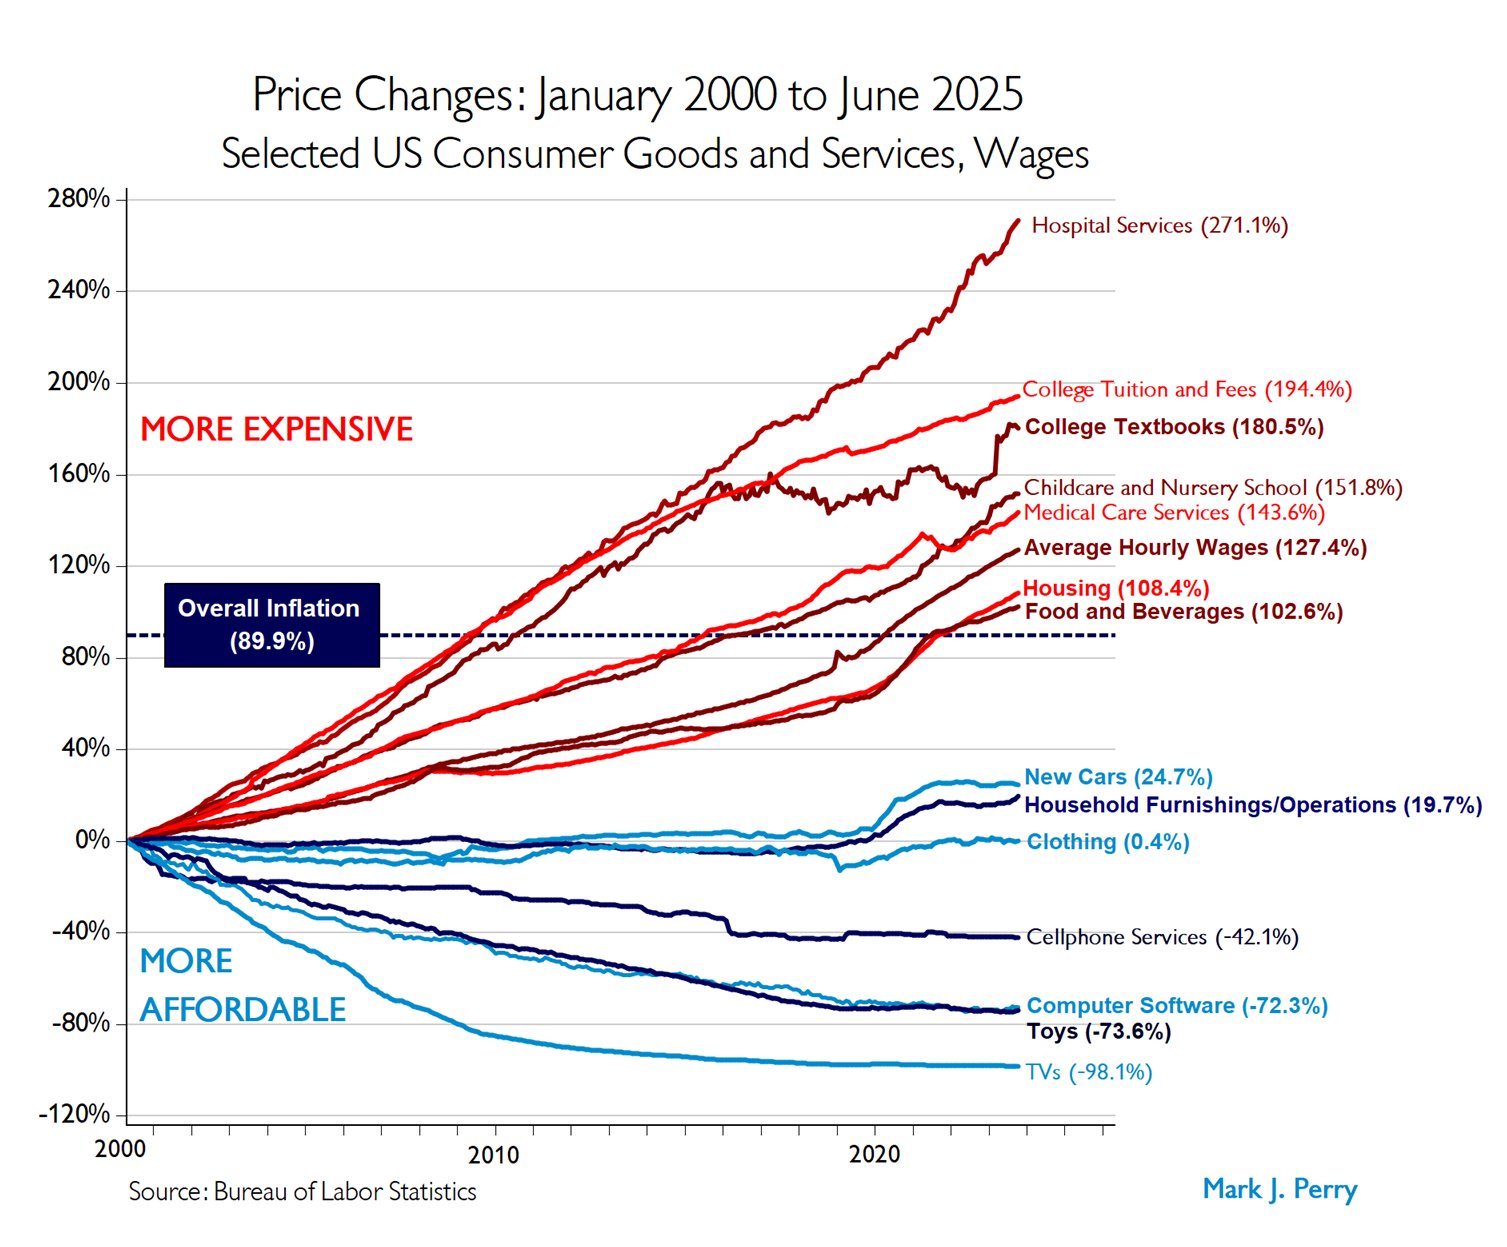
Of the 14 products tracked, four have seen a drop in nominal prices—TVs, toys, computer software, and cell phone services. Another five have risen in dollar terms but are actually cheaper in time prices: clothing, household furnishings, new cars, food and beverages, and housing. What stands out most, though, is that the products becoming less abundant—medical care services, childcare, college textbooks, tuition, and hospital services—are also the ones most heavily influenced by government intervention, whether through subsidies, regulation, or restricted supply.
We’ve compared the nominal price change of each product to the change in nominal average hourly wages, from which we can show the change in the time prices—positive or negative. Next, we compare the time prices over time to measure changes in abundance. This bar chart illustrates these changes:
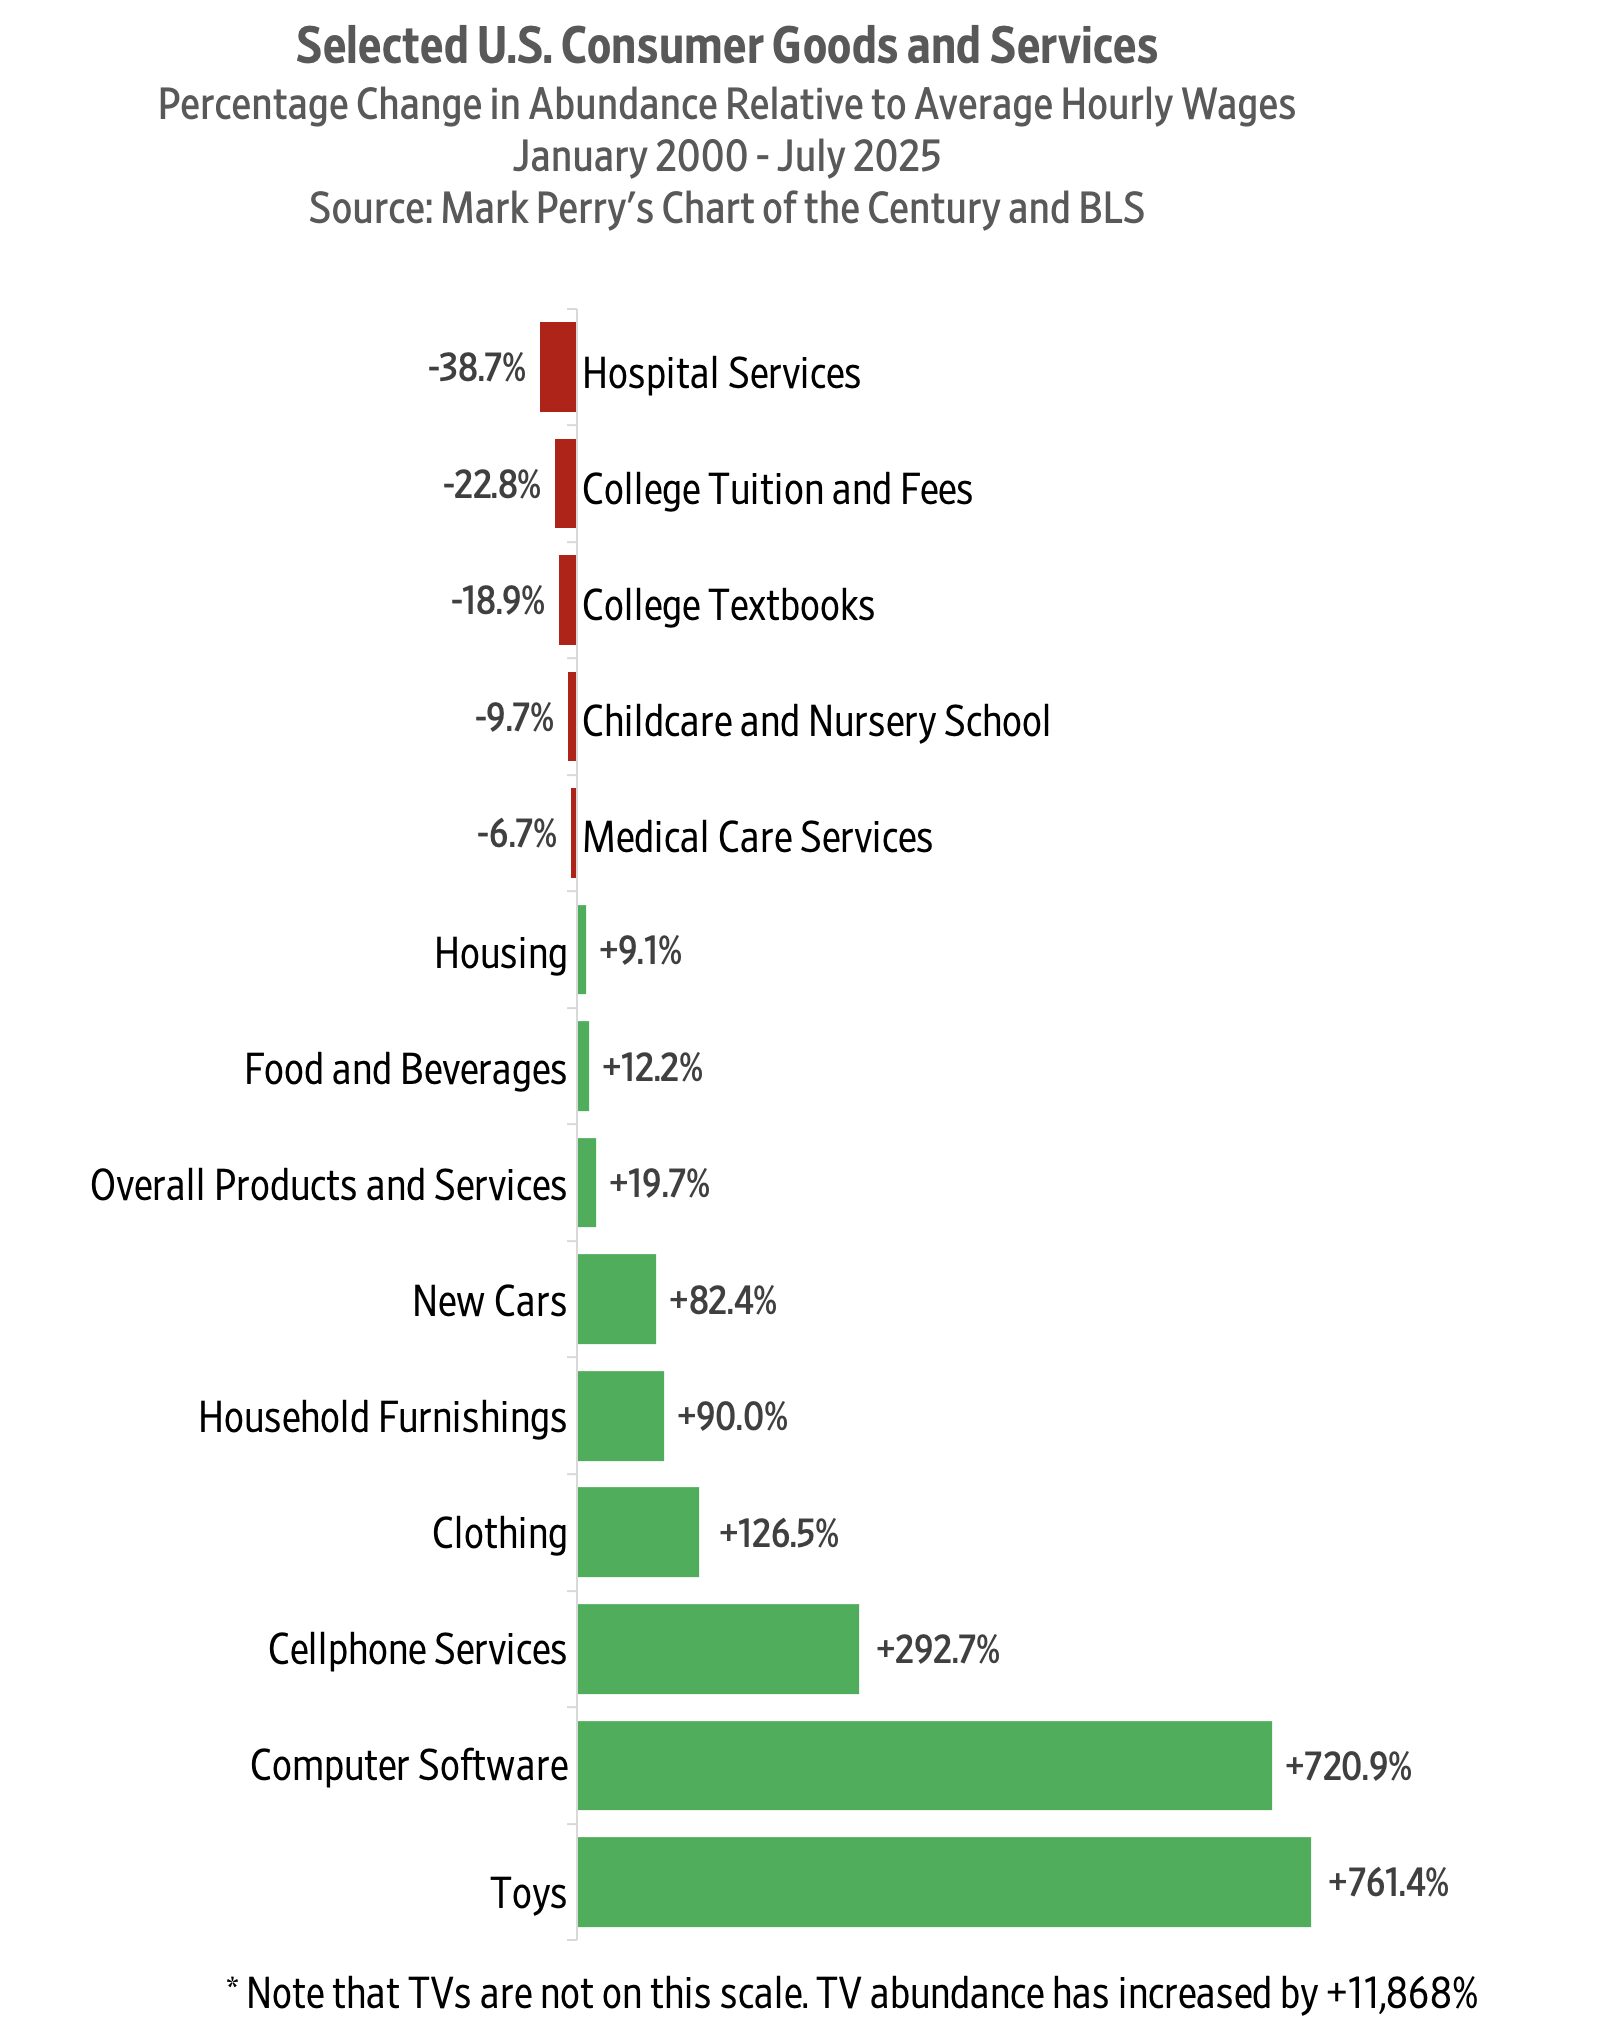
Also note that this chart does not include TVs. The time price of TVs decreased by over 99 percent. For the time it took to earn the money to buy one TV in 2000, you would get almost 120 TVs today. TV abundance increased by 11,868 percent. The horizontal scale on the chart would be 15.6 times wider if we included TVs; everything else would look tiny.
Over this 25-year period, overall inflation increased by 89.9 percent while average hourly income increased by 127.4 percent. Hourly income increased 19.7 percent faster than prices. This indicates a 16.5 percent decrease in overall time prices. You get 19.7 percent more today for the same amount of time 25 years ago.
That illustrates the fact that things can get simultaneously more expensive in money prices and more affordable in time prices. As long as hourly wages are increasing faster than the prices of goods and services, time prices are decreasing, which is another way of saying personal abundance is increasing.
Time prices are a better way to measure standards of living. To really understand our economy, we must think in hours and minutes, not dollars and cents. Time prices are the true prices.