Summary: Trade has been a driving force behind economic growth, poverty reduction, and rising living standards across the globe. Far from harming the poor, open markets have helped lift billions out of extreme poverty while improving health, education, and life expectancy. History and modern evidence alike show that free exchange expands the economic “pie” for everyone, making prosperity the norm rather than the exception.
In his book The Rational Optimist, the British science writer Matt Ridley argued that economic progress began when people began to trade. “By exchanging,” he explained, “human beings discovered ‘the division of labour,’ the specialisation of efforts and talents for mutual gain… The more human beings diversified as consumers and specialised as producers, and the more they then exchanged, the better off they have been, are and will be.” For Ridley, “exchange is to cultural evolution as sex is to biological evolution.”
The Scottish father of economics, Adam Smith, recognized the economic potential of trade when he noted that “the liberal system of free exportation and free importation” is “not only the best palliative of a dearth, but [also] the most effectual preventative of a famine.”
While economists disagree on several policy issues, trade is generally not one of them. For example, survey data suggest that 95 percent of economists agree that tariffs tend to reduce economic welfare. Another 90 percent do not think the United States should restrict outsourcing.
You’d never know that by listening to today’s political debates. While protectionism is nothing new, the recent rise in anti-trade policies is an unfortunate setback for the United States and for the world.
Far from a rigged game that exploits those at the bottom, the globalization of the market system has brought global extreme poverty to its lowest levels in human history (Figure 1). That is why the Turkish-American Nobel Prize–winning economist Daron Acemoglu and his coauthors have described the creation of the market system as “one of the greatest achievements of humankind.”
Figure 1. Share of global population living in extreme poverty, including and excluding China.

Note: Extreme poverty is defined as living below the International Poverty Line of $2.15 per day. These data are adjusted for inflation and for differences in living costs between countries. These data are expressed in international dollars at 2017 prices. The data relates to income measured after taxes and benefits, or to consumption per capita.
Furthermore, despite claims to the contrary, the United States’ participation in the global economy has significantly benefited American consumers and workers. Real incomes have not stagnated over the past few decades. They’ve risen, including for those at the bottom of the income distribution (Figure 2).
Figure 2. Real median personal income in the United States
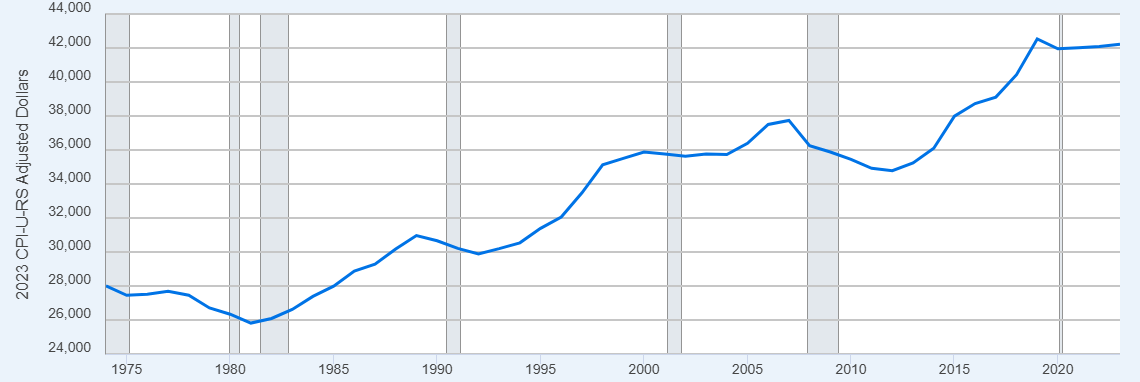
Note: Shaded areas indicate US recessions.
Nor has international trade hollowed out American manufacturing. While employment in the sector has declined as a result of automation and productivity gains, manufacturing output—especially output per worker—has increased.
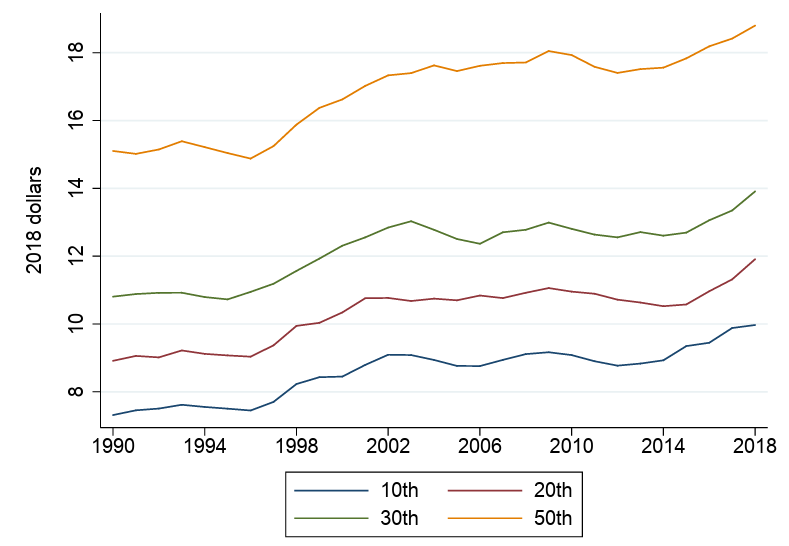
As Michael Strain from the American Enterprise Institute observes, “America is upwardly mobile, particularly for those nearer the bottom of the income distribution. Incomes aren’t stagnant. Workers do enjoy the fruits of their labor. The argument that life hasn’t improved for typical households in decades borders on the absurd. The game is not rigged. The American Dream is not dead (Figure 3).”
Figure 3. Average real wage at percentiles of the wage distribution
In a 2020 article, I reviewed the scholarship linking trade to economic growth and poverty reduction. Overall, the empirical literature shows that trade reduces poverty predominantly through economic growth. Critics sometimes claim that growth leaves those at the bottom behind. It may improve the average, they say, but only because of large income boosts at the top.
That talking point is simply untrue. Economic freedom, including openness to trade, and growth have been shown to improve incomes across the board. A rising tide truly does lift all boats, not just the yachts of the wealthy. Growth positively touches every tier of the economic ladder. A bigger economic pie means better living standards for everyone involved, making economic growth pro–poor.
The Indian economist Arvind Panagariya has documented trade’s role in the economic success of Hong Kong, Singapore, Taiwan, South Korea, India, China, and other countries throughout Asia, Africa, and Latin America. Across more than 200 jurisdictions and five decades of data, he found a causal relation between trade and per capita income: the countries that experienced intensive growth always maintained a high and/or expanding trade-to-GDP ratio.
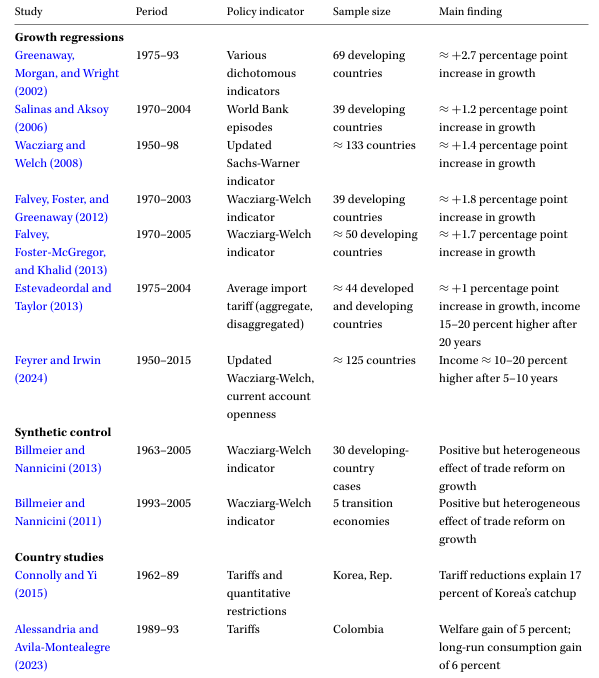
In a new review of the literature, Dartmouth’s Douglas Irwin found the same thing. The empirical research on trade liberalization has been “remarkably consistent” in its conclusion that open trade fosters growth in productivity and, therefore, standards of living (Tables 1 and 2). Tariffs, on the other hand, hold growth, productivity and standards of living back. Previous literature reviews have come to similar conclusions. That is why economists from all sides of the political spectrum come together on trade.
Table 1. Selected studies of trade reform and economic growth.
Despite the populist rhetoric about helping the American workers and consumers, those same workers and consumers end up eating the cost of tariffs in the form of higher prices. The negative effects of protectionism also have a disproportional impact on the poor, who tend to gain the most from trade.
And keep in mind that living standards aren’t just about income. Open market economies have higher adult literacy rates, longer life expectancies, lower infant mortality rates, better environmental stewardship, and greater life satisfaction than closed economies do. As Nobel Prize–winning American economist Robert Lucas wrote, “The consequences for human welfare involved in questions [about economic growth] are simply staggering. Once one starts to think about them, it is hard to think about anything else.”
Table 2. Selected studies of trade reform and industry productivity
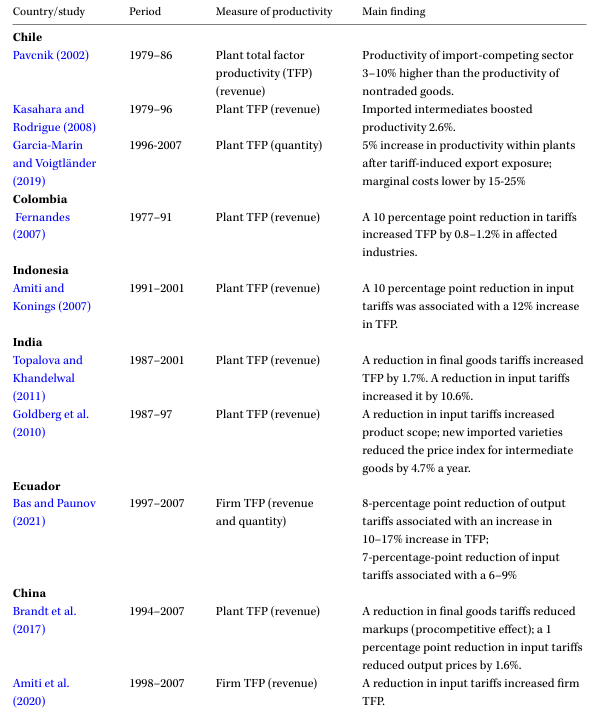
Note: TFP = total factor productivity.
Income inequality is a major criticism of an open economy, but, interestingly enough, most studies find no relation between greater economic freedom and income inequality (though the findings are somewhat mixed). It’s worth noting that concerns over income inequality are often concerns over inequality within already rich countries. When it comes to inequality, in other words, it tends to be the global rich arguing with the super global rich (and much of that concern is overblown).
But look at the bigger picture. Overall, globalization has led to both a decline in global poverty and global inequality (Figure 4).
Figure 4. Global income inequality: Gini index, 1820–2020
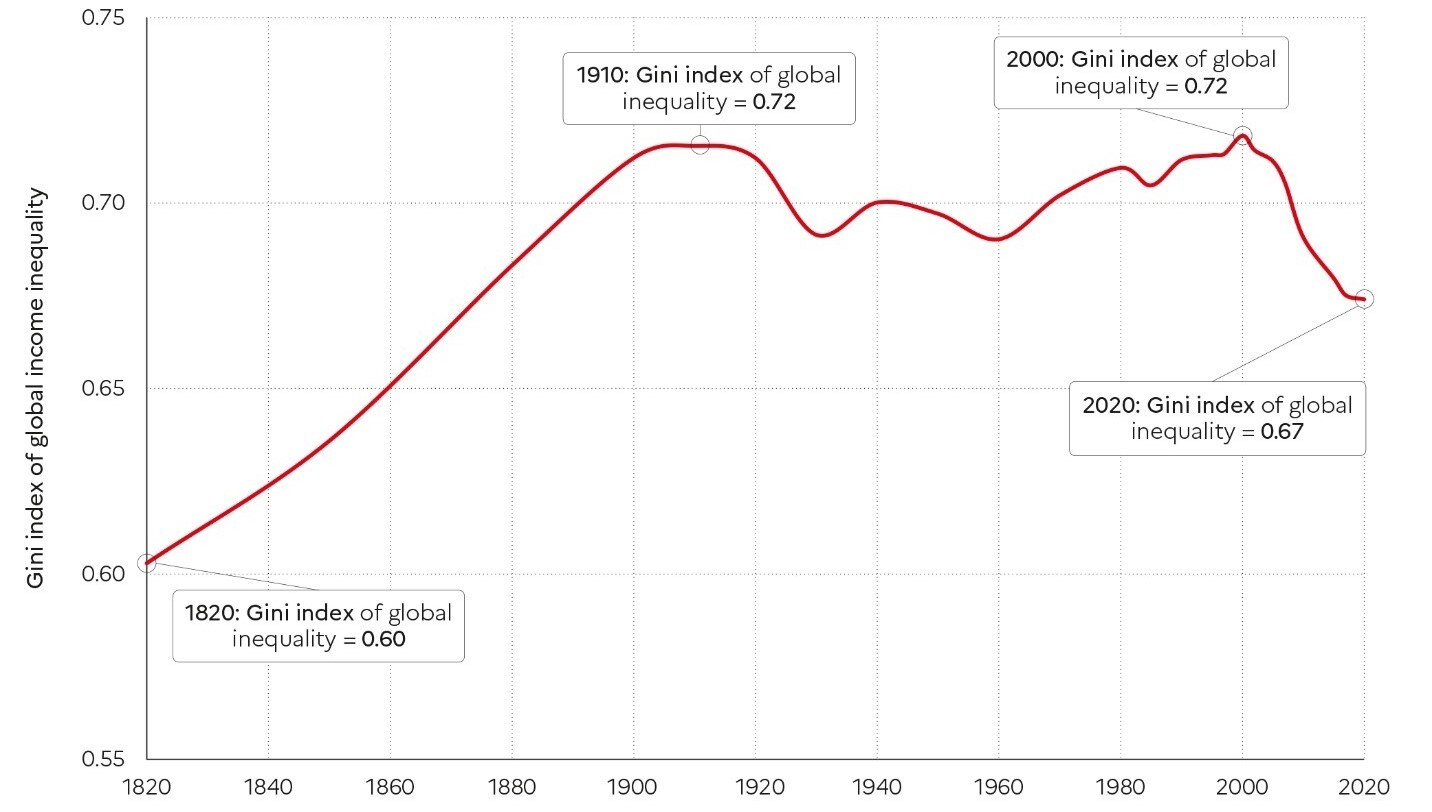
Note: Global inequality, as measured by the global Gini coefficient, rose from about 0.6 in 1820 to about 0.7 in 1910 and then stabilized around 0.7 between 1910 and 2020. It is still too early to say whether the decline in the global Gini coefficient observed since 2000 will continue.
Income is measured per capita after pension and unemployment insurance transfers and before income and wealth taxes.
According to the 2024 “Economic Freedom of the World” report, the share of income earned by the poorest 10 percent in the most economically free countries is about the same as that of the poorest 10 percent in the least economically free countries. In other words, the income distribution—the slicing of the economic pie—looks the same across countries, no matter the level of economic freedom.
Figure 5. Economic freedom and income share of lowest 10 percent
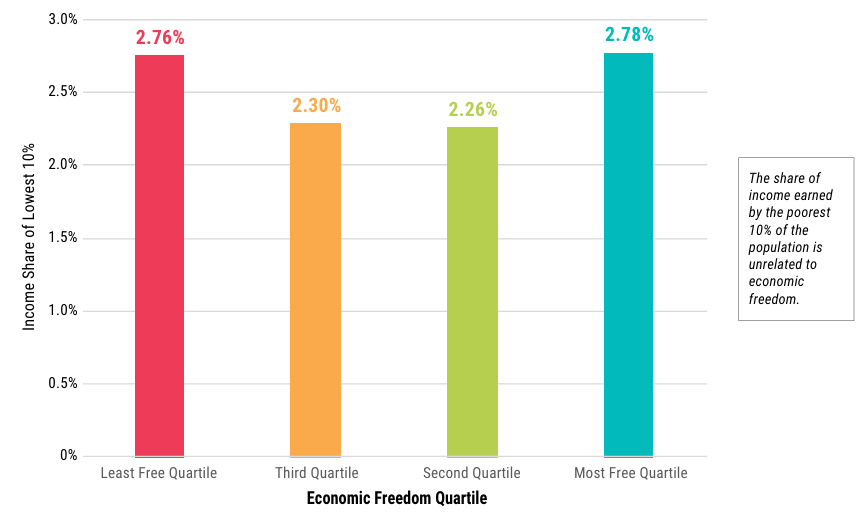
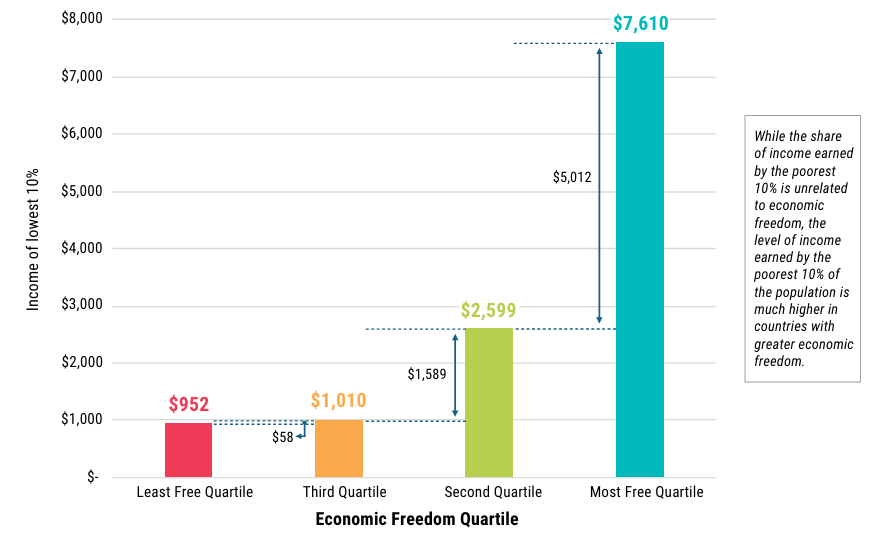
But the amount of income earned by the poorest 10 percent in the most economically free countries is eighttimes that of the poorest 10 percent and slightly more than the average person in the least economically free countries (Figures 5 and 6). The poor’s portion of the economic pie may be the same across countries, but free countries have bigger pies.
Figure 6. Economic freedom and income share of lowest 10 percent
We did not redistribute our way into riches or plunder our way into prosperity. Instead, the historical shifts both institutionally and culturally in favor of a trade economy led to a radical upsurge in material well-being that the American economist Deirdre McCloskey has aptly labeled “The Great Enrichment”:
In the two centuries after 1800 the trade-tested goods and services available to the average person in Sweden or Taiwan rose by a factor of 30 or 100. Not 100 percent, understand—a mere doubling—but in its highest estimate a factor of 100, nearly 10,000 percent, and at least a factor of 30, or 2,900 percent. The Great Enrichment of the past two centuries has dwarfed any of the previous and temporary enrichments.
It’s not that we suddenly figured out how to slice up the economic pie just right. We made the pie 2,900 to 10,000 percent bigger through commercial exchange. When the pie is bigger, there’s more pie to go around. And we’re all richer for it.