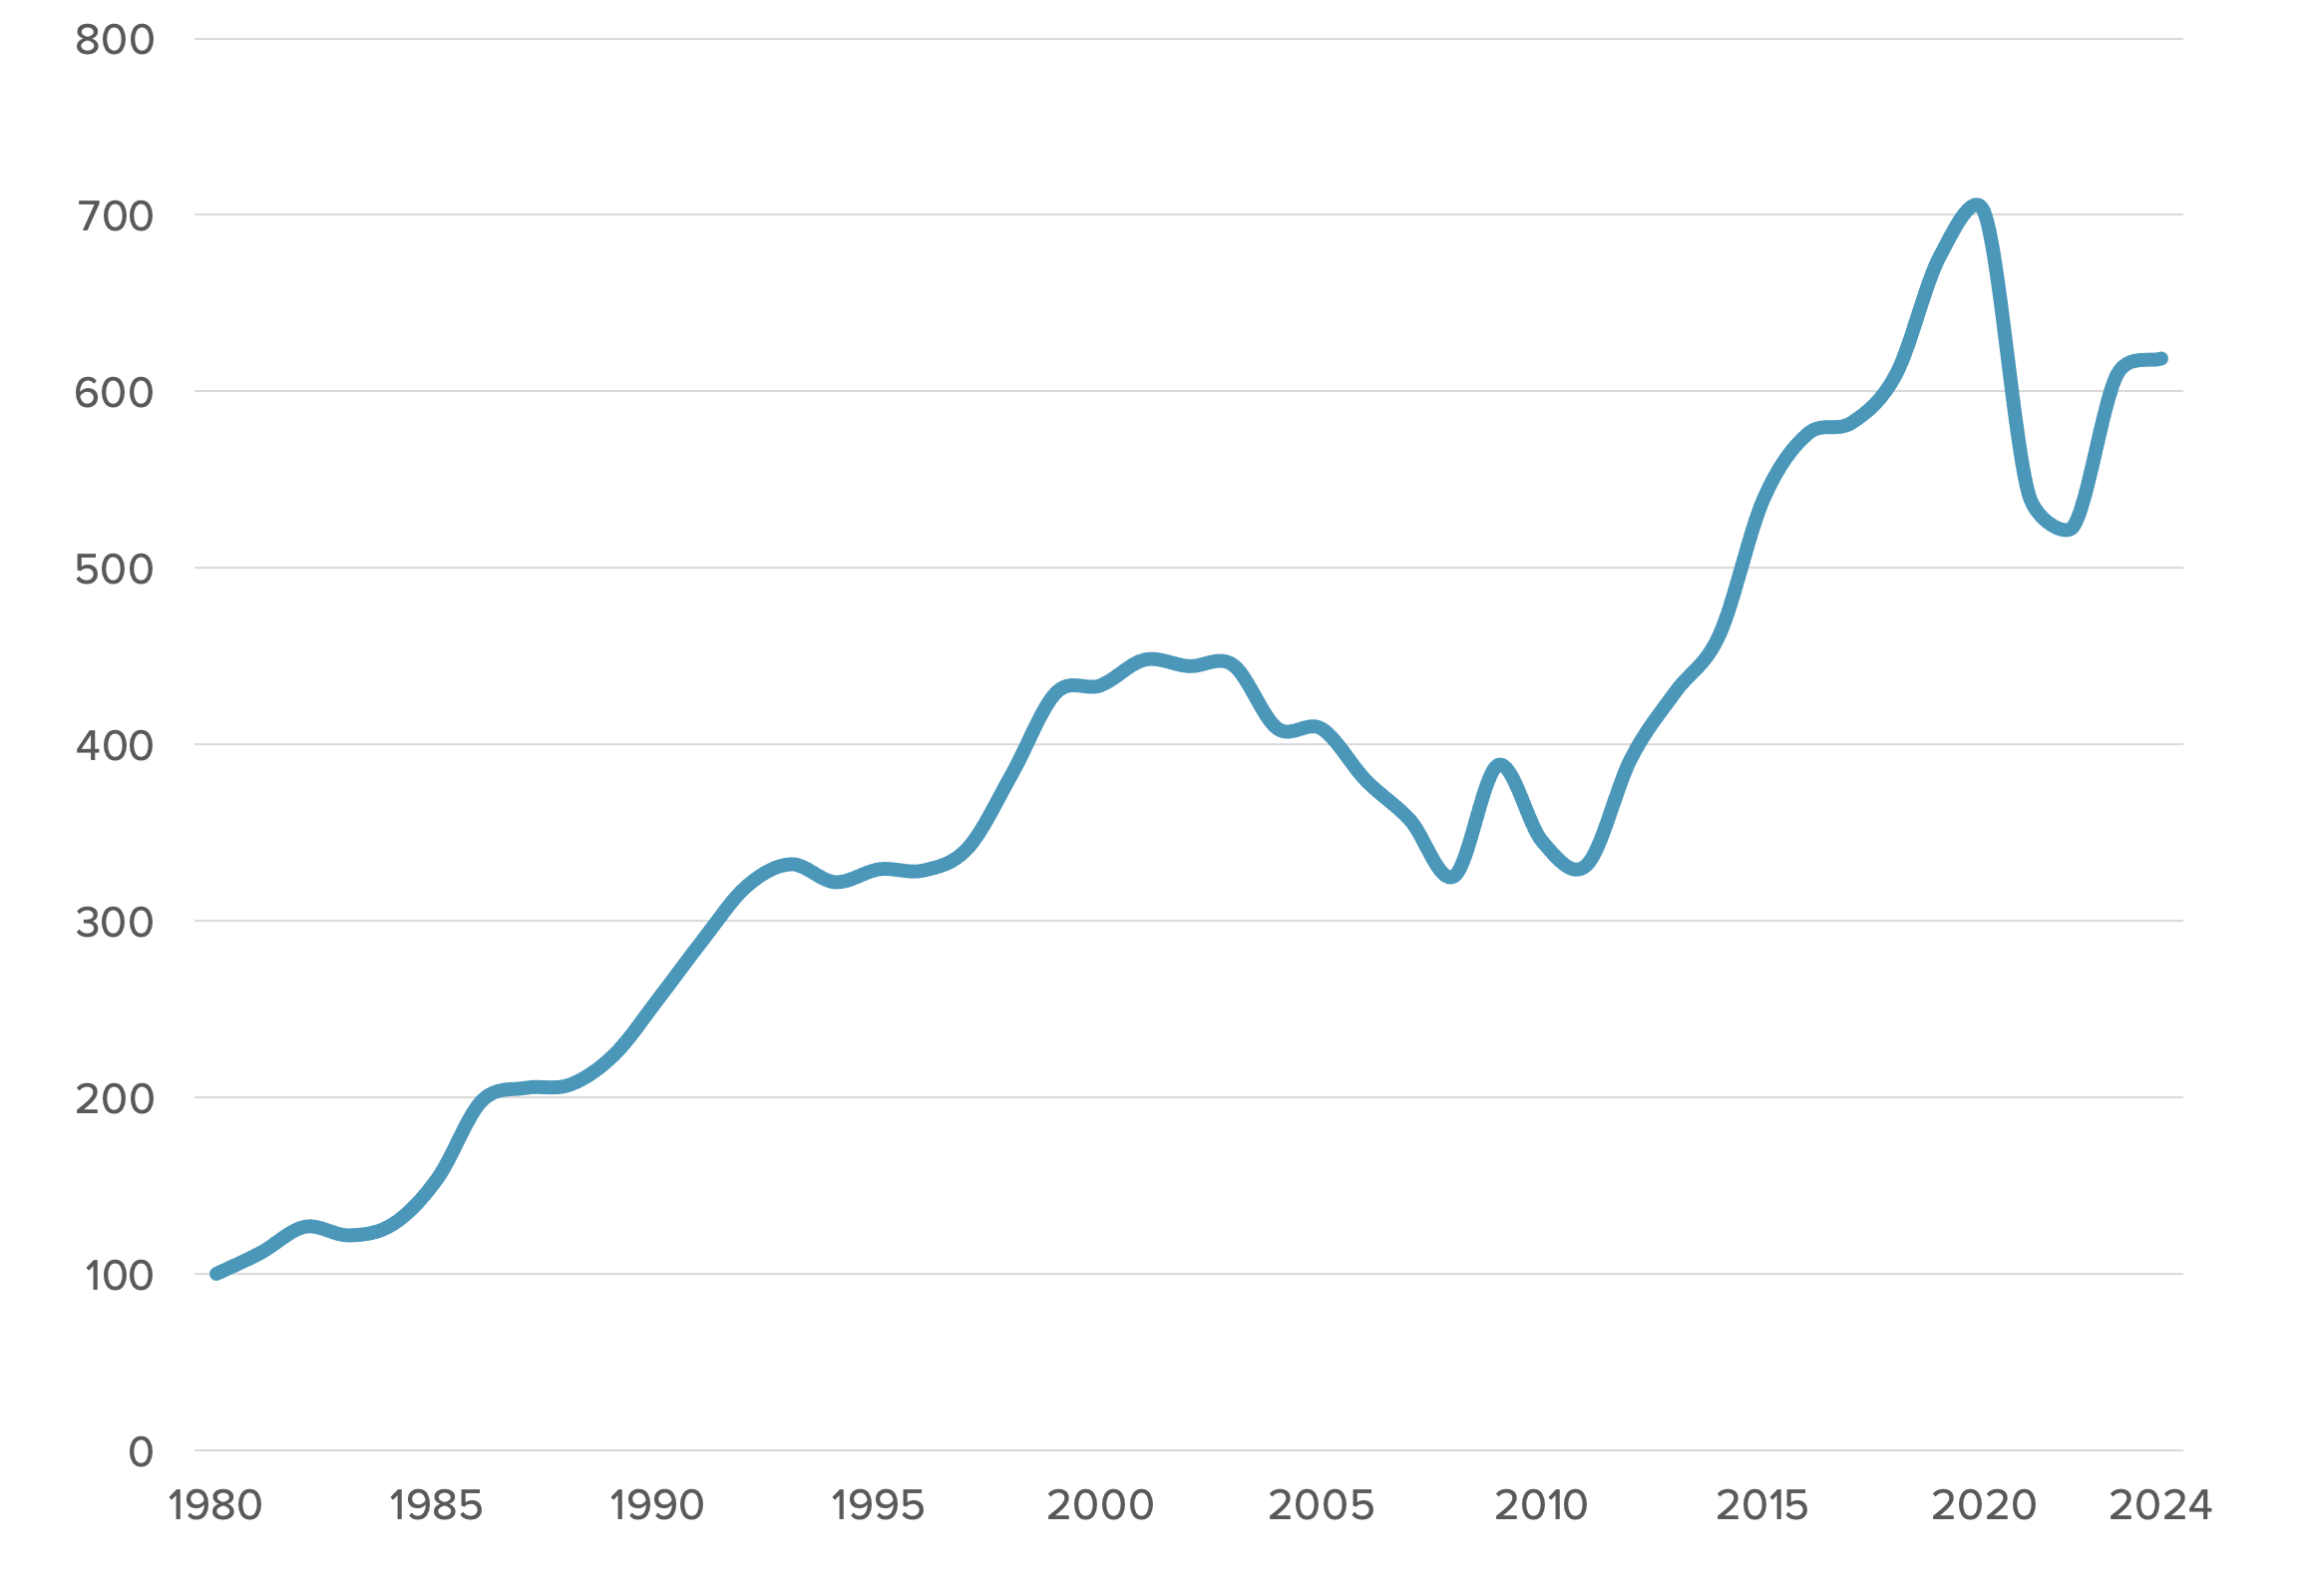
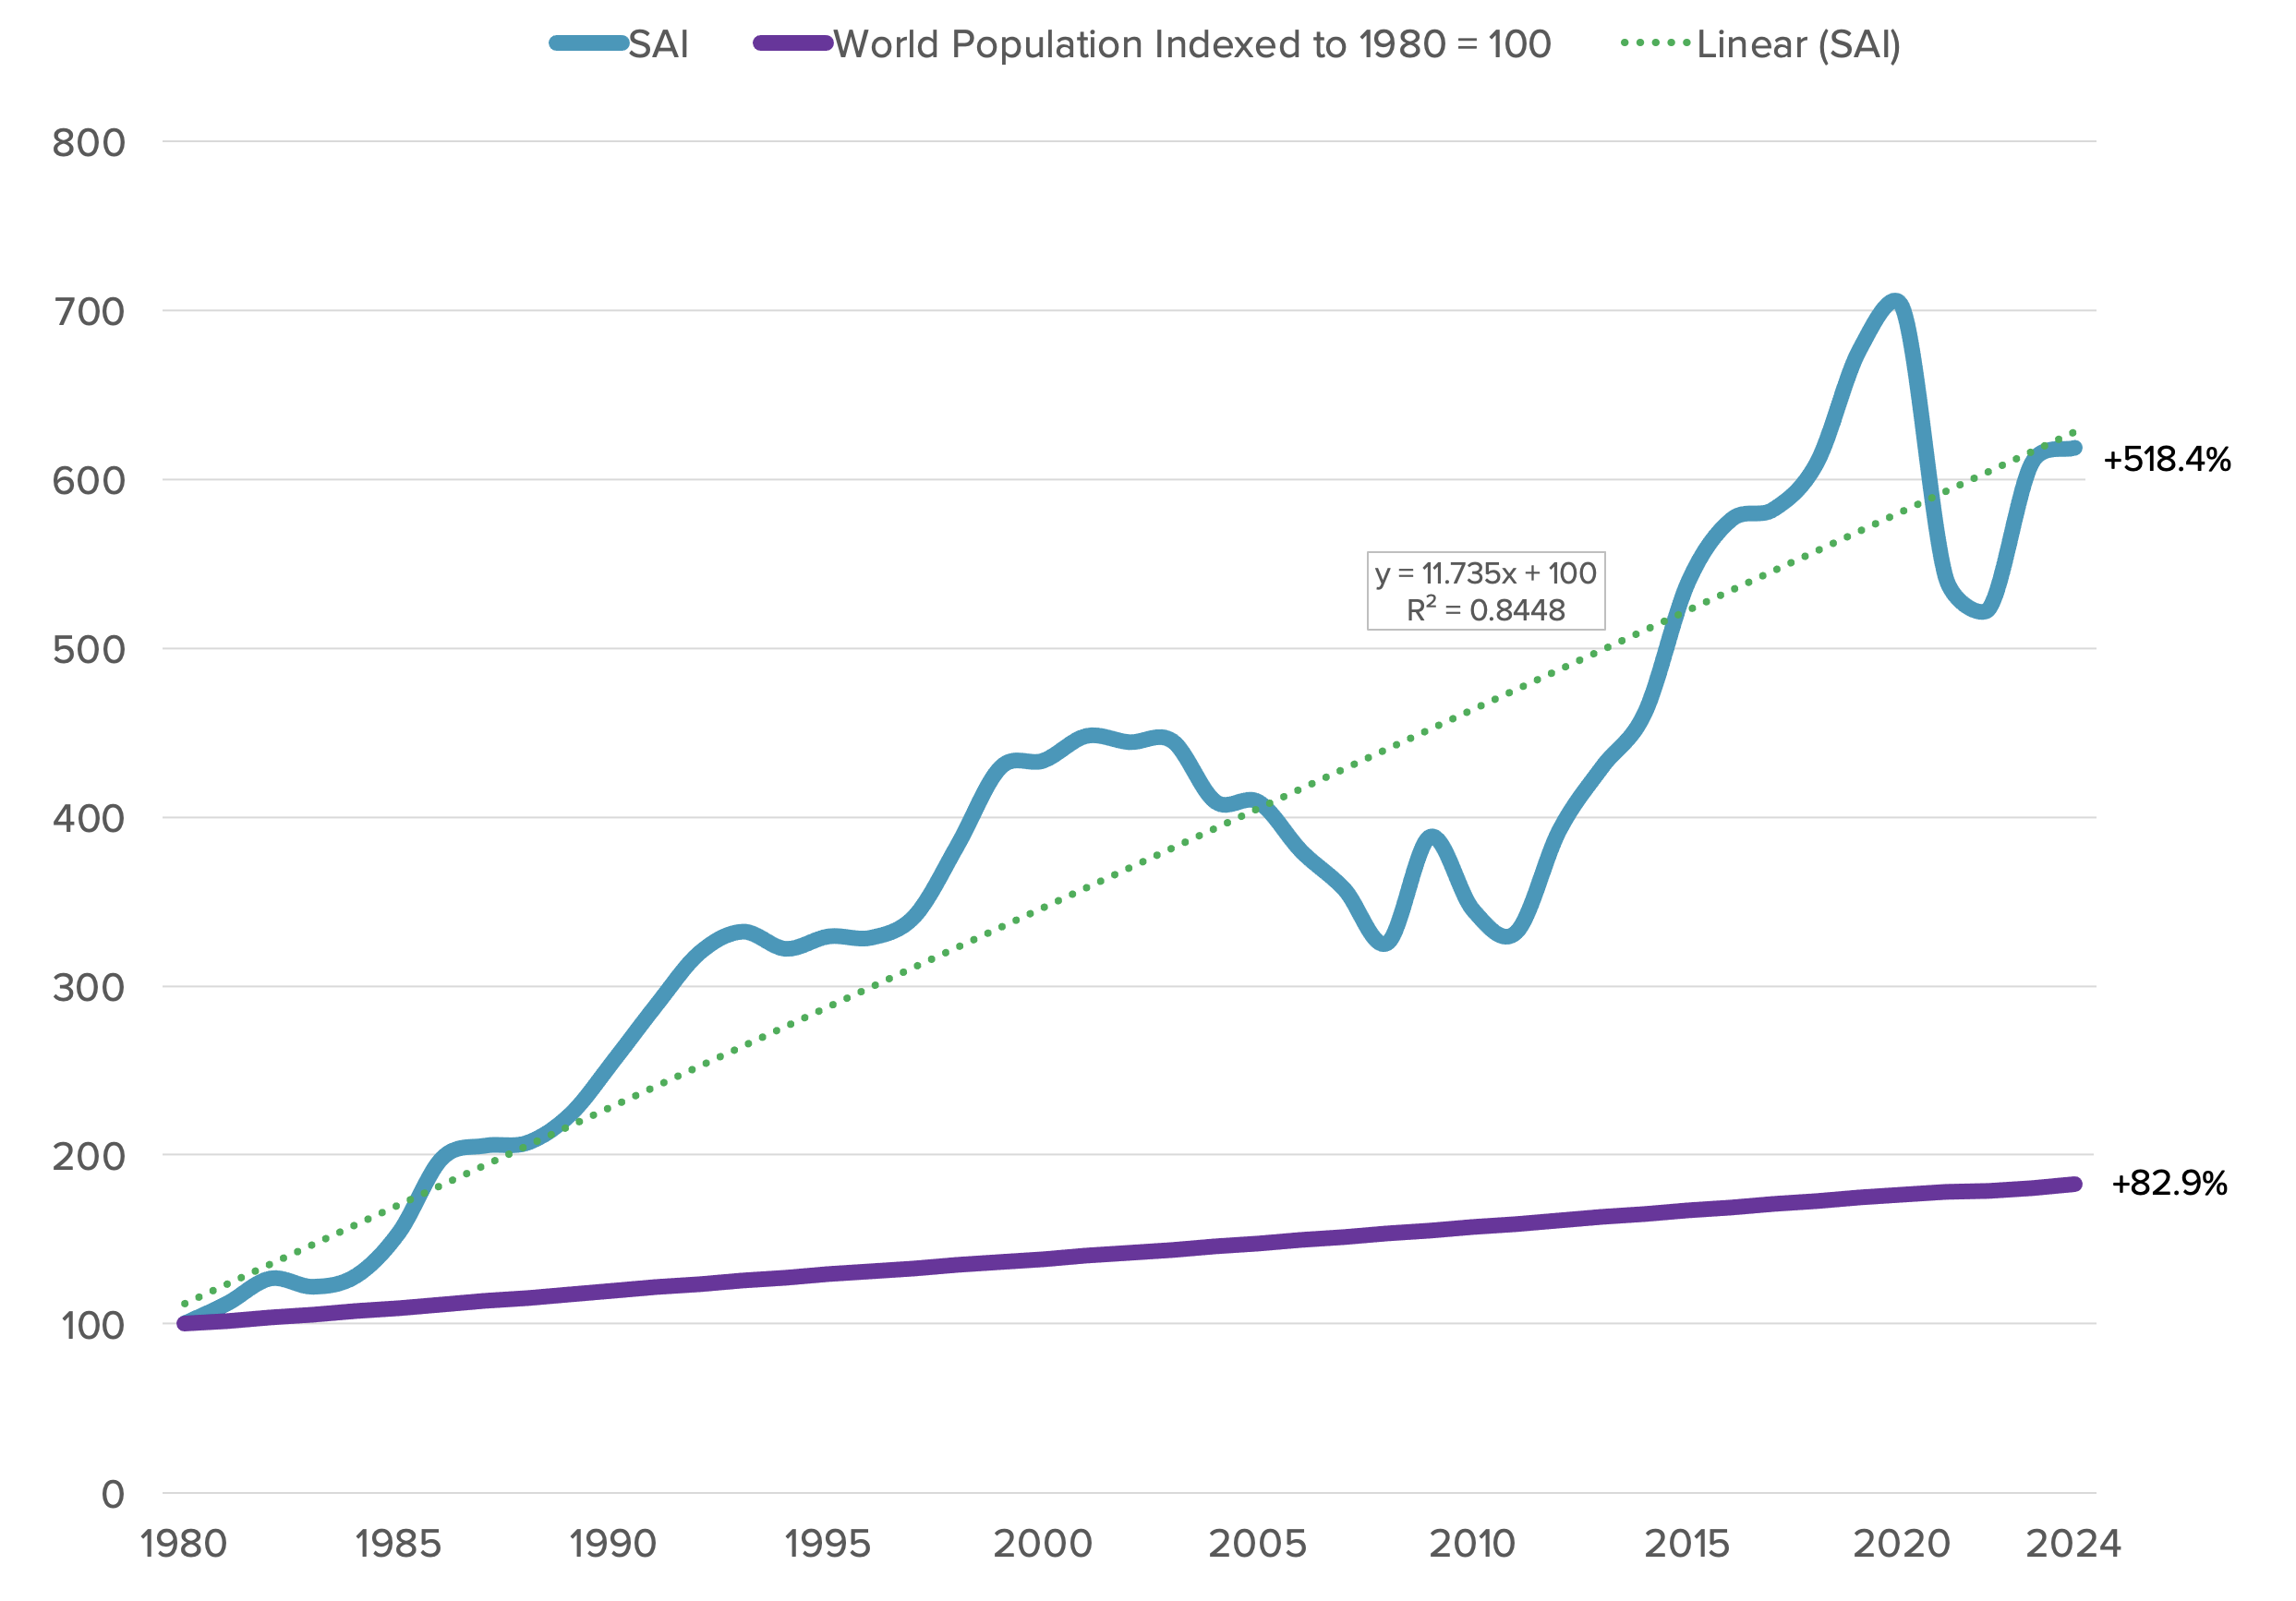
The Simon Abundance Index (SAI) measures the relationship between resource abundance and population. It converts the per capita abundance of 50 basic commodities and the size of the global population into a single value. The index began in 1980 with a base value of 100. In 2024, the SAI stood at 618.4, indicating that resources have become 518.4 percent more abundant over the past 44 years. All 50 commodities in the dataset were more abundant in 2024 than they were in 1980. The global abundance of resources increased at a compound annual growth rate of 4.22 percent, thus doubling every 17 years.
Figure 1: The Simon Abundance Index, 1980–2024 (1980 = 100)
The SAI is based on the ideas of Julian Simon, a University of Maryland economist and Cato Institute senior fellow who pioneered research and analysis of the relationship between population growth and resource abundance. If resources were truly finite, as many people believe, an increase in population would be expected to lead to scarcity and higher prices. However, as Simon discovered through exhaustive research spanning decades, the opposite was true. As the global population increased, resources tended to become more abundant.
How is that possible? Simon recognized that atoms, without knowledge, have no economic value. Knowledge transforms atoms into resources—and the supply of undiscovered knowledge is limitless. He also understood that only humans can discover and create new knowledge. Therefore, resources can be effectively infinite, and humans are the ultimate resource.
Consider this example. Before the 19th century, agriculture relied heavily on manure for fertilization, limiting crop yields due to its low nitrogen content. As populations grew, farmers sought more potent alternatives. In the early 1800s, guano—bird droppings rich in nitrogen, phosphorus, and potassium—was discovered on islands off the coast of Peru. Its extraordinary effectiveness led to a global guano trade boom, fueling industrial agriculture in Europe and America. By the late 19th century, however, supplies started to dwindle.
The breakthrough came in the early 20th century with the Haber–Bosch process, developed by the German chemists Fritz Haber and Carl Bosch. This method allowed for the synthetic fixation of atmospheric nitrogen into ammonia, producing fertilizer on an industrial scale. It decoupled food production from natural nitrogen sources, revolutionizing agriculture and enabling the rapid expansion of global populations. It is estimated that without synthetic fertilizer, the planet’s food production would be able to support only four billion rather than eight billion people.
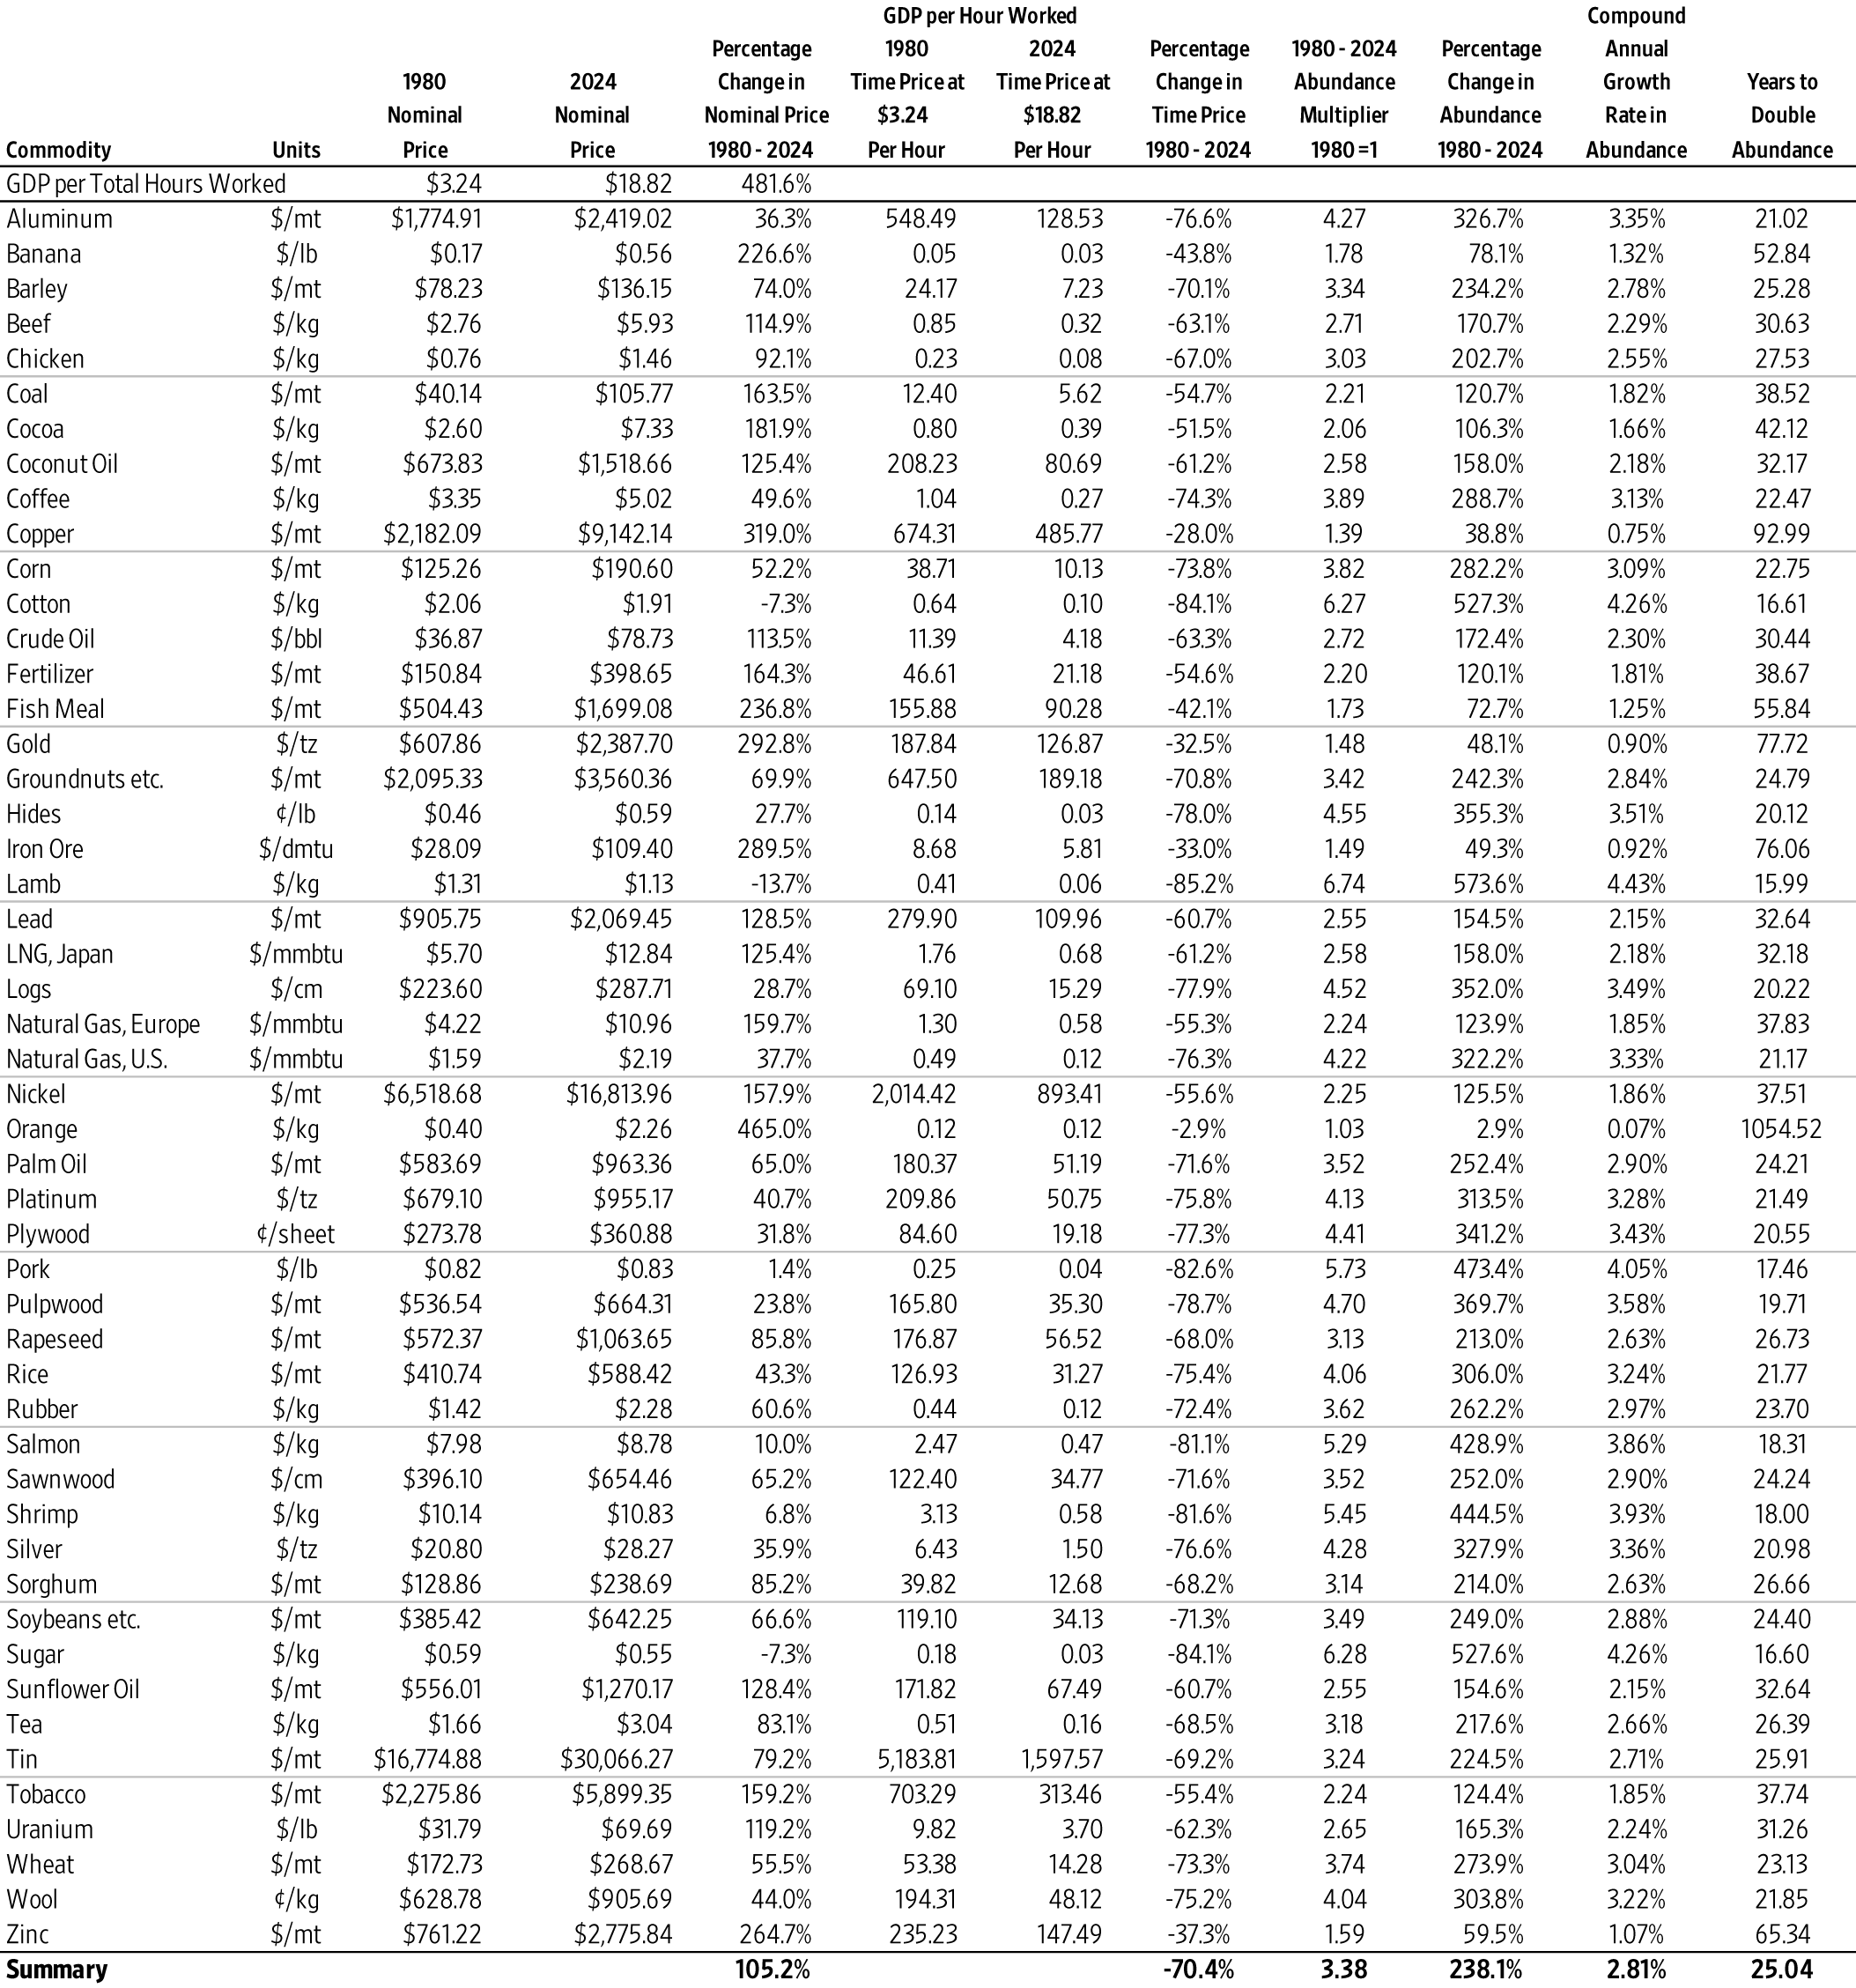
Individual Commodity Changes Between 1980 and 2024
The SAI uses “time prices” to measure changes in relative abundance. Time prices tell you how long you must work to earn enough money to buy something. As long as you work less time this year than last year to afford something, your standard of living is rising. Time prices are a simple and intuitive way to compare the true cost of things.
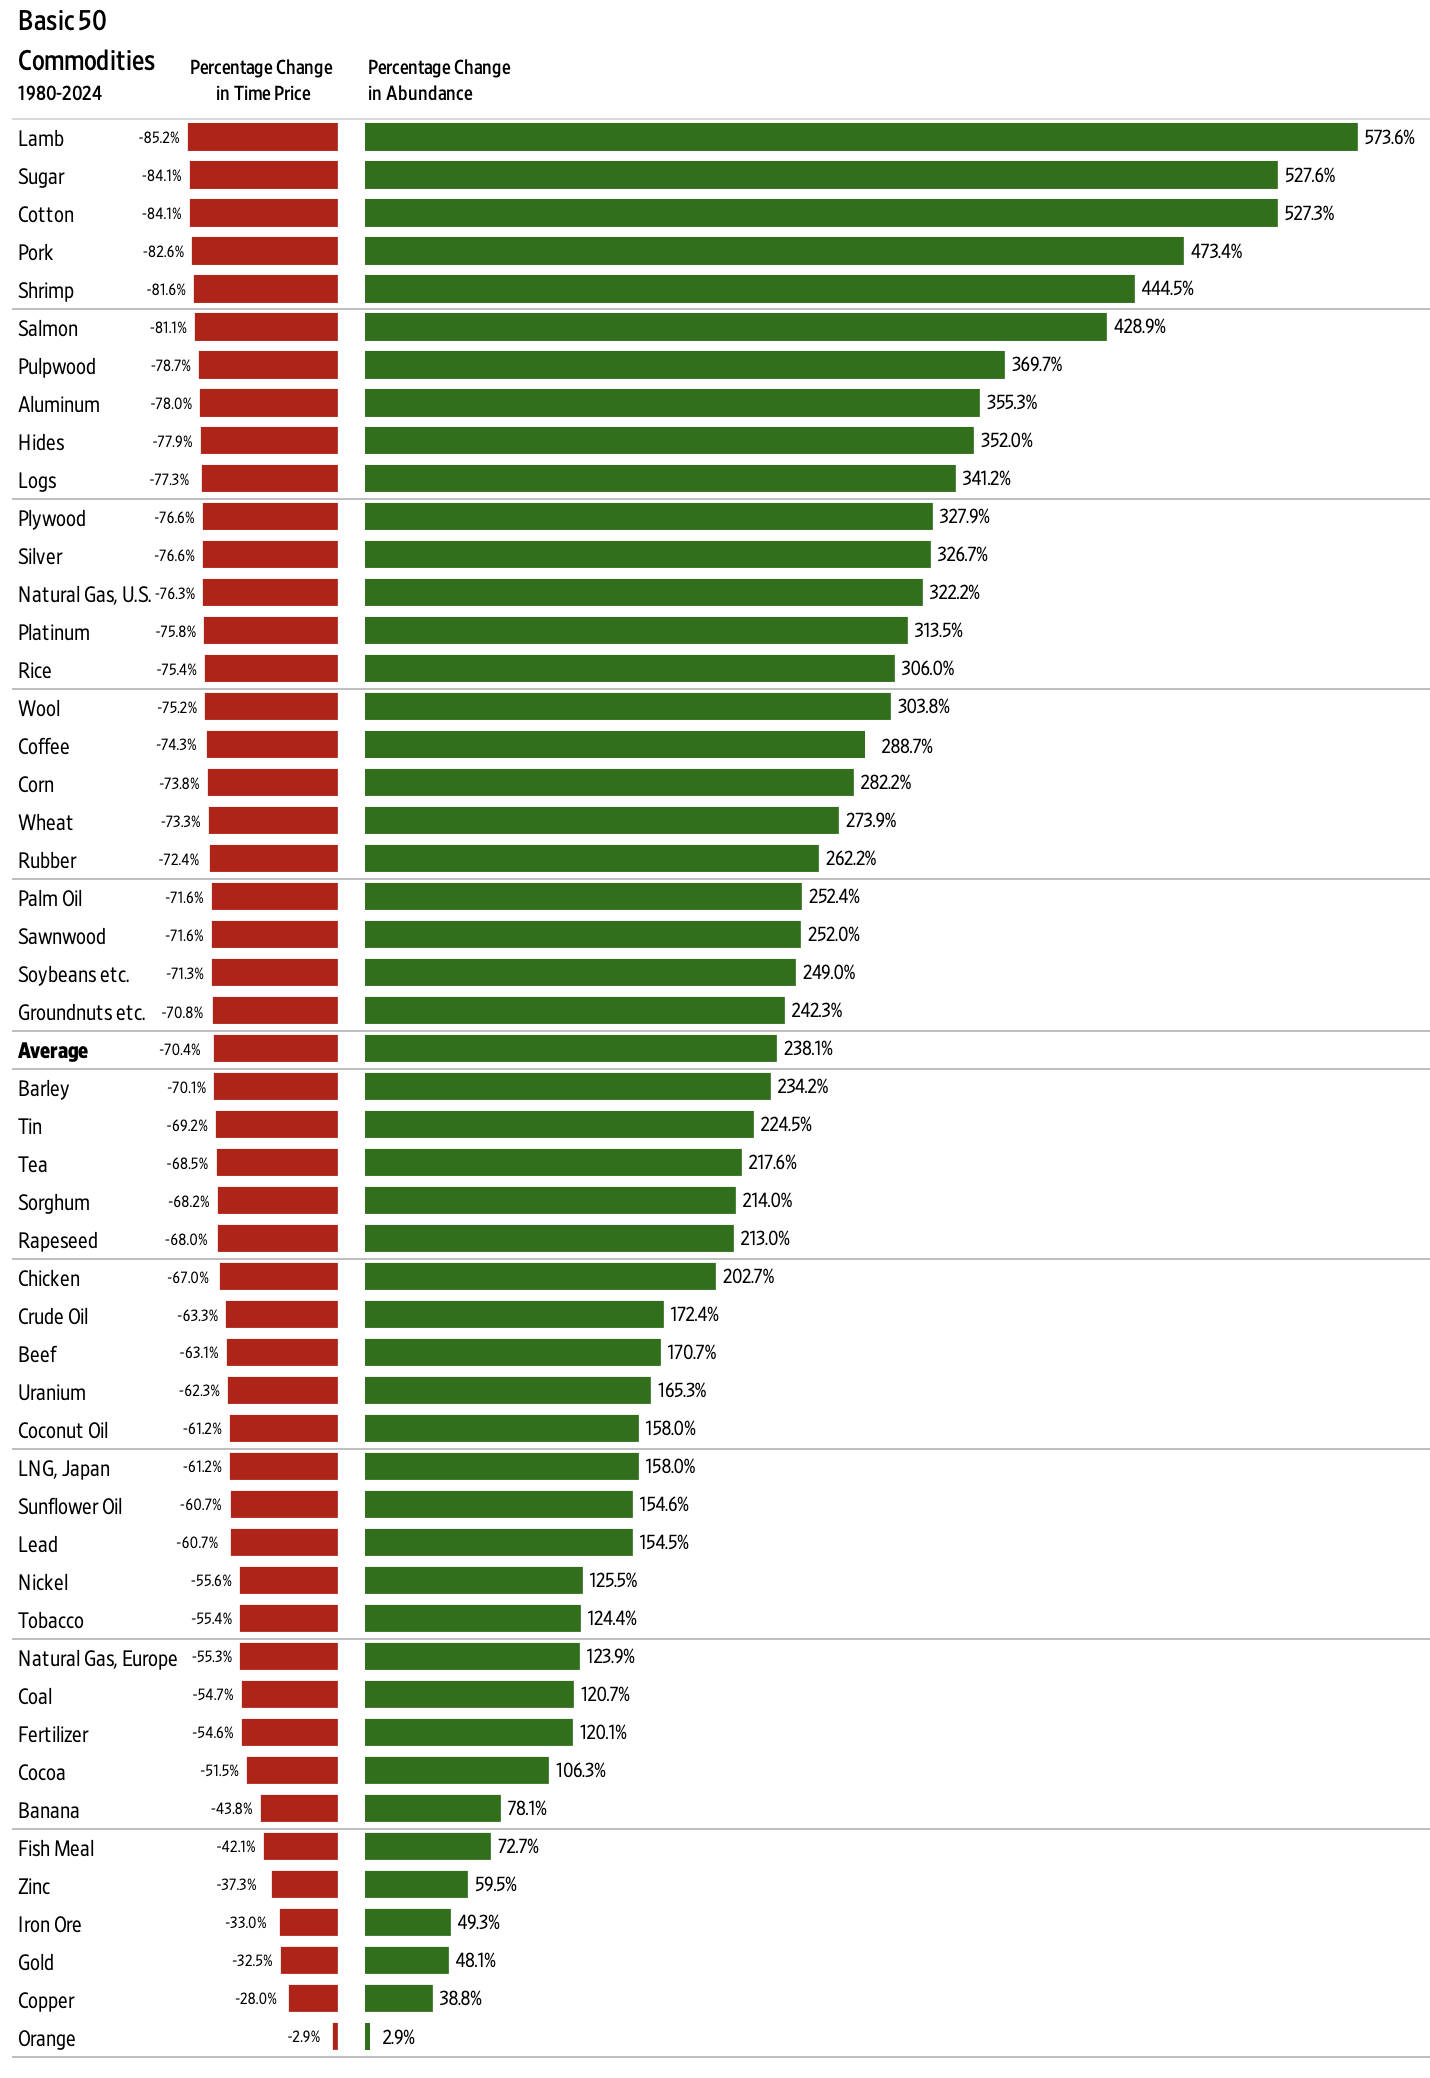
Time prices for individual commodities decreased, on average, by 70.4 percent between 1980 and 2024, ranging from −2.9 percent for oranges to −85.2 percent for lamb. That means that the average inhabitant of the planet saw their personal resource abundance increase by 238.1 percent, ranging from 2.9 percent for oranges to 573.6 percent for lamb. Put differently, the same length of work that allowed the average inhabitant of the planet to purchase 1 unit in our basket of 50 commodities in 1980 allowed him or her to buy 3.381 units in 2024.
To continue with our fertilizer example: Since 1980, the time price of fertilizer has fallen by 56.4 percent. The same length of work that allowed the average inhabitant of the planet to purchase 1 unit of fertilizer in 1980 allowed him or her to buy 2.2 units in 2024, an increase of 120 percent.
Figure 2: Individual Commodity Percentage Change in Time Price and Percentage Change in Abundance, 1980–2024
Finally, the SAI is calculated by multiplying personal resource abundance by population size. As noted, between 1980 and 2024, personal resource abundance increased by 238.1 percent. Over this same period, the global population increased by 82.9 percent, rising from 4.444 billion to 8.126 billion. The relevant equation is:
SAI = (1 + percentage change in population) x (1 + percentage change in personal resource abundance) x 100
SAI = 1.829 x 3.381 x 100
SAI = 618.4
Individual Commodity Changes from 2023 to 2024
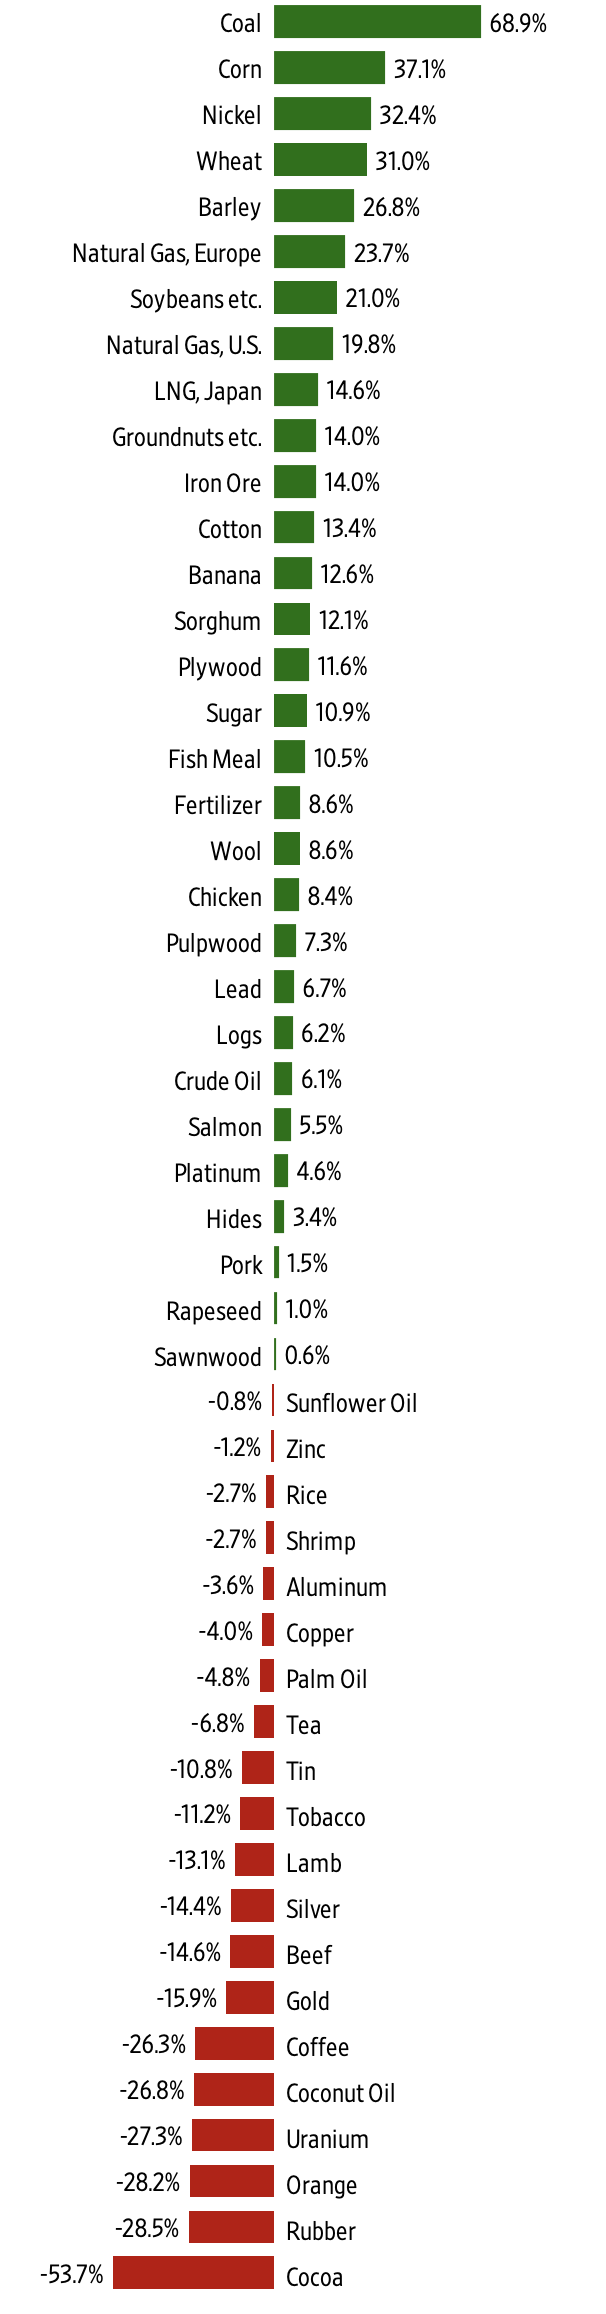
The SAI increased by 1.48 percent from 609.4 in 2023 to 618.4 in 2024. During that period, 30 of the 50 commodities in the dataset became more abundant, while 20 became less abundant. The one-year change in abundance ranged from a 68.9 percent increase for coal to a 53.7 percent decrease for cocoa.
Figure 3: Individual Commodity Percentage Change in Abundance, 2023–2024
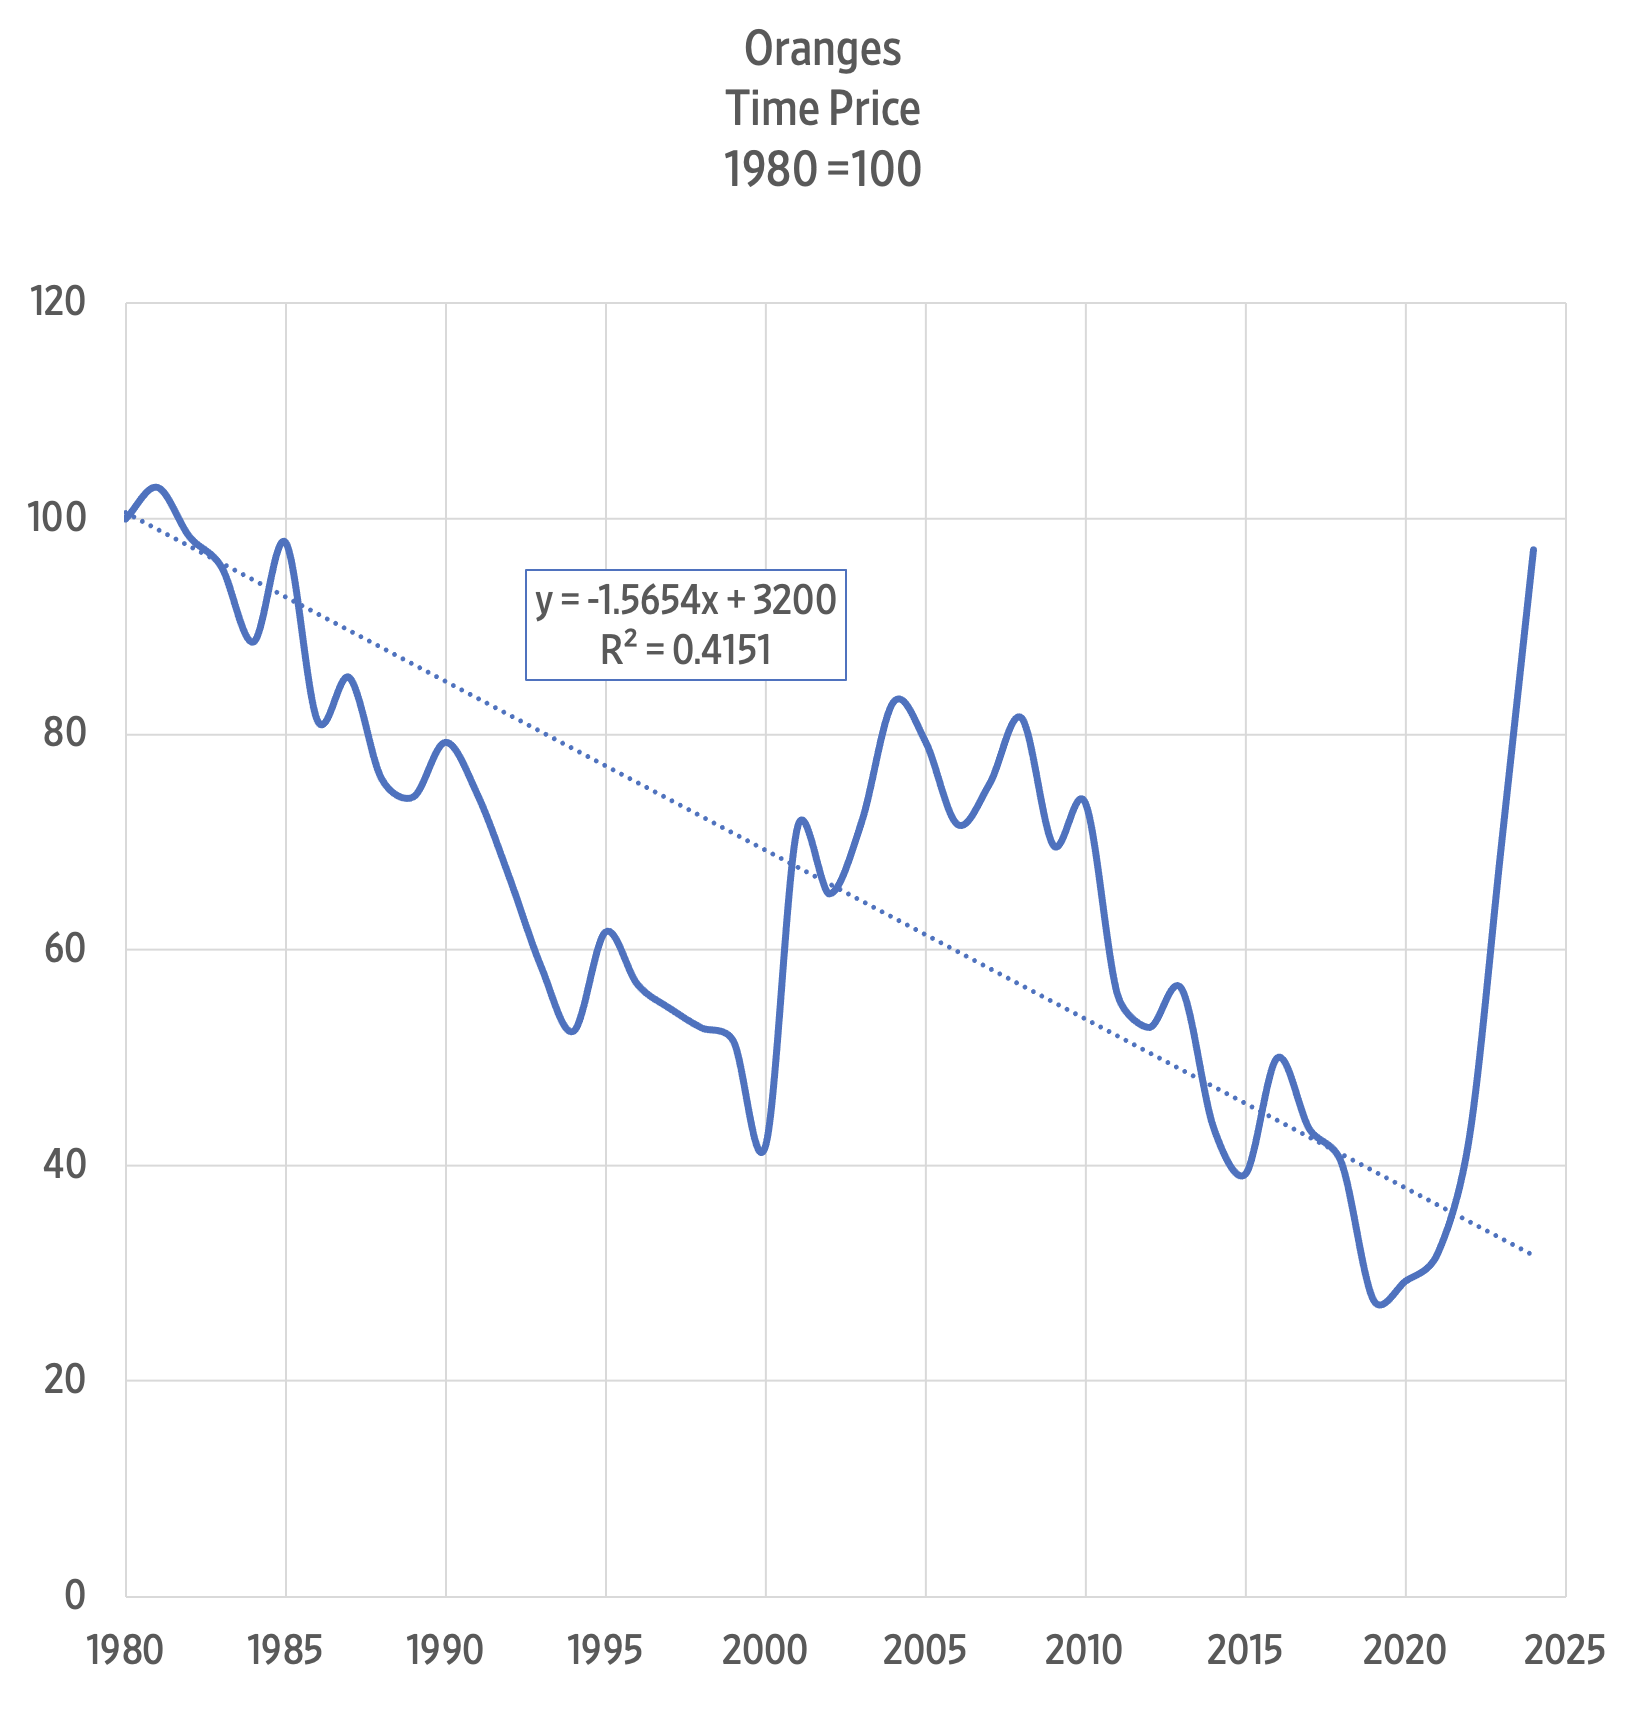
Oranges
The abundance of oranges has not changed greatly since 1980. The lowest time price on record for oranges occurred in 2019, when you could get 3.64 oranges for the time price of 1 orange in 1980. Even with the recent nominal price spike, however, the time price of oranges has been declining at an average rate of 1.56 percent per year.
Julian Simon noted that short-term price spikes are expected due to temporary market conditions. He also noted that these higher prices create incentives for people to focus on discovering new knowledge that will make that specific product more abundant in the long run.
This new knowledge eventually shows up in even lower prices. You can see that in the chart for oranges, as the underlying trend points to lower time prices and increasing abundance over the long run. Because of that factor and the 44-year trendline, we can expect that the time price of oranges will probably be lower in 2025. Time will tell.
Conclusion
The SAI began to recover in 2023 from the effects of COVID-19-related government lockdown policies and monetary expansion. Despite natural disasters, political turmoil, and wars since 1980, resource abundance has continued to increase more than six times faster than the population grew—a phenomenon we call “superabundance.”
To stick with our fertilizer example: Abundance of fertilizer has grown at a compound annual growth rate of 1.81 percent per year. The global population grew by 1.38 percent per year. Therefore, we can say that fertilizer, growing 31 percent faster than the population, is superabundant.
We explore these topics in our book Superabundance: The Story of Population Growth, Innovation, and Human Flourishing on an Infinitely Bountiful Planet.
Additional Information:
Appendix A: Alternative Figure 1 with a Regression Line, Equation, R-Square, and Population
Appendix B: The Basic 50 Commodities Analysis, 1980–2024
Appendix C: Why Time Is Better than Money for Measuring Resource Abundance
To better understand changes in our living standards, we must shift from thinking in terms of quantities to thinking in terms of prices. While the quantity of a resource is important, economists focus on prices because prices contain more information. Prices signal whether a product is becoming more or less abundant. However, prices can be distorted by inflation. To address that, economists often convert current nominal prices into real or constant prices—a process that can be subjective and contentious.
To overcome those challenges, we can use time prices. The most important consideration from the perspective of an individual consumer is how much time it takes to earn the money needed to buy a product. A time price is simply the money price divided by hourly income. While money prices are expressed in dollars and cents, time prices are expressed in hours and minutes. There are at least seven reasons why time is a better measurement tool than money:
- Time prices contain more information than money prices: Since innovation tends to lower prices and increase wages, time prices better capture the benefits of new knowledge and the growth of human capital. Looking only at prices without considering wages tells only half the story. Time prices provide a clearer view of the full economic picture.
- Time prices avoid the complications of inflation adjustments: Time prices transcend all the complications associated with trying to convert nominal prices to real prices. Time prices avoid the subjective and disputed adjustments, such as the Consumer Price Index (CPI), the GDP deflator or implicit price deflator (IPD), the Personal Consumption Expenditures Price Index (PCE), and purchasing power parity (PPP). Time prices rely solely on nominal prices and nominal hourly incomes at each point in time.
- Time prices are universally applicable: Time prices can be calculated on any product with any currency at any time and from any place. That means you can compare the time price of oranges in France in 1850 to the time price of oranges in New York in 2024. Researchers can also choose from various hourly income measures as the denominator.
- Time is an objective and universal constant: As the American economist George Gilder has noted, the International System of Units (SI) has established seven key metrics, of which six are bounded in one way or another by the passage of time. As the only irreversible element in the universe, with directionality imparted by thermodynamic entropy, time is the ultimate frame of reference for all measured values.
- Time cannot be inflated or counterfeited: Time is both fixed and continuous.
- We should measure time inequality, not income inequality: Since everyone has exactly 24 hours each day, examining differences in how time is spent provides a more meaningful perspective on standards of living than comparing income alone. This approach yields a less negative—and perhaps more accurate—picture of inequality.
- Time cannot be bought or sold: If it could, the rich people would never die.
These seven reasons make time prices superior to money prices when measuring resource abundance. Time prices are elegant, intuitive, and simple. They represent the true cost we pay for the things we buy. Time prices are the true prices.