fbpx
01 / 05
Thanksgiving Will Be 13 Percent More Abundant This Year

Blog Post | Cost of Living

Thanksgiving Will Be 13 Percent More Abundant This Year

Professor Jeremy Horpedahl has provided updated numbers on the percentage changes in four products essential to enjoying our Thanksgiving holiday. Remember, it’s not how expensive things are but how affordable they are that counts. To measure affordability, we must compare prices to wages. This is what time prices do for us. A time price is simply the nominal money price divided by nominal hourly income. Since last year, the nominal money prices of our four essential items have decreased from 0.8 percent to 13 percent, while nominal hourly income has increased by 4.4 percent. That means that personal abundance has increased by between 5.2 percent and 20 percent.

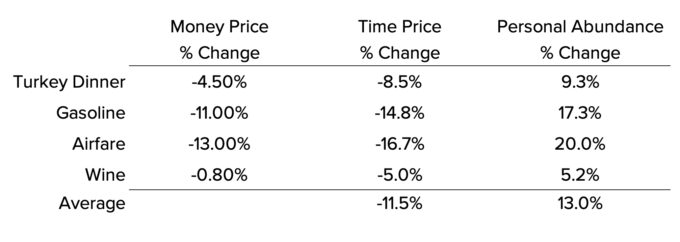
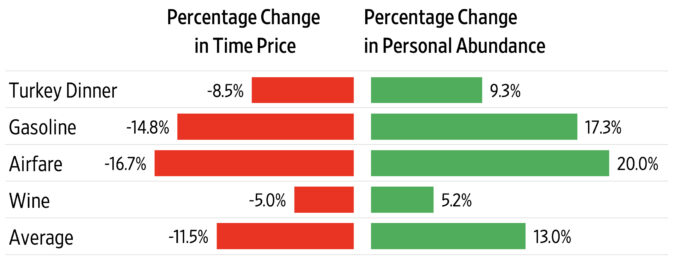
Dividing the percentage change in the nominal money prices by the percentage change in nominal wages reveals the percentage change in the time price. Personal abundance is how much more you now enjoy for the same amount of time relative to last year. We get 13 percent more Thanksgiving this year for the same amount of time it took last year.

Sources: “Cost of Thanksgiving Dinner Down Slightly from Record High in 2022,” news release, American Farm Bureau Federation, November 15, 2023; U.S. Energy Information Administration, “US Regular All Formulations Gas Price,” FRED Economic Data, Federal Reserve Bank of St. Louis, updated November 13, 2023; Bureau of Labor Statistics, “Consumer Price Index for All Urban Consumers: Airline Fares in US City Average,” FRED Economic Data, Federal Reserve Bank of St. Louis, updated November 14, 2023; Bureau of Labor Statistics, “Average Price: Wine, Red and White Table, All Sizes, Any Origin (Cost per 1 Liter/33.8 Ounces) in US City Average,” FRED Economic Data, Federal Reserve Bank of St. Louis, updated November 14, 2023; and Bureau of Labor Statistics, “Average Hourly Earnings of Production and Nonsupervisory Employees, Total Private,” FRED Economic Data, Federal Reserve Bank of St. Louis, updated November 3, 2023.

We describe the process of transforming scarcities into abundances in our book, Superabundance, available at Amazon. Jordan Peterson calls it a “profoundly optimistic book.” There has never been a better time to create more life.

Blog Post | Food Prices

Home Alone with Pizza Abundance

For the time price of one pizza in 1990, unskilled workers get 3.8 pizzas today. Upskilling workers get 8.4.

In the classic 1990 holiday movie Home Alone, the McCallister family orders 10 pizzas and the bill comes to $122.50 (plus tip). Unskilled workers at the time were earning around $6.03 an hour. That would put the time price of the 10 pizzas at 20.3 hours, or about 2 hours per pizza.

Jadrian Wooten and Chris Clarke over at Monday Morning Economist conducted a price check on how much 10 basic cheese and pepperoni pizzas cost today at a Little Caesars near the McCallisters’ home. It came to only $91.98 (plus tip). So, the nominal price of pizza actually shrank!

Unskilled workers are earning closer to $17.17 an hour today, so that would put the time price of 10 pizzas at 5.35 hours, or about 32 minutes per pizza. The time price of pizza has fallen by 73.6 percent. That means that for the time it took to earn the money to buy one pizza in 1990, you get 3.8 pizzas today. That’s a 280 percent increase in personal pizza abundance.

Since 1990, the US population has increased by 36.3 percent, from 248 million to 340 million. Each 1 percent increase in population corresponded to a 7.71 percent increase in pizza abundance.

If you started your first job in 1990 and went from being an unskilled worker to a blue collar worker in 2024, your hourly compensation (wages and benefits) increased from $6.03 an hour to $38 an hour. Your personal pizza abundance went from one pizza to 8.4 pizzas. Enjoy the party.

This article was published at Gale Winds on 10/22/2024.

Blog Post | Food Prices

Thanksgiving Dinner Will Be 8.8 Percent Cheaper This Year

Be thankful for the increase in human knowledge that transforms atoms into valuable resources.

Summary: There has been a remarkable decrease in the “time price” of a Thanksgiving dinner over the past 38 years, despite nominal cost increases. Thanks to rising wages and innovation, the time required for a blue-collar worker to afford the meal dropped significantly, making food much more abundant. Population growth and human knowledge drive resource abundance, allowing for greater prosperity and efficiency in providing for more people.


Since 1986, the American Farm Bureau Federation (AFBF) has conducted an annual price survey of food items that make up in a typical Thanksgiving Day dinner. The items on this shopping list are intended to feed a group of 10 people, with plenty of leftovers remaining. The list includes a turkey, a pumpkin pie mix, milk, a vegetable tray, bread rolls, pie shells, green peas, fresh cranberries, whipping cream, cubed stuffing, sweet potatoes, and several miscellaneous ingredients.

So, what has happened to the price of a Thanksgiving Day dinner over the past 38 years? The AFBF reports that in nominal terms, the cost rose from $28.74 in 1986 to $58.08 in 2024. That’s an increase of 102.1 percent.

Since we buy things with money but pay for them with time, we should analyze the cost of a Thanksgiving Day dinner using time prices. To calculate the time price, we divide the nominal price of the meal by the nominal wage rate. That gives us the number of work hours required to earn enough money to feed those 10 guests.

According to the Bureau of Labor Statistics, the blue-collar hourly wage rate increased by 240.2 percent – from $8.96 per hour in October 1986 to $30.48 in October 2024.

Remember that when wages increase faster than prices, time prices decrease. Consequently, we can say that between 1986 and 2024 the time price of the Thanksgiving dinner for a blue-collar worker declined from 3.2 hours to 1.9 hours, or 40.6 percent.

That means that blue-collar workers can buy 1.68 Thanksgiving Day dinners in 2024 for the same number of hours it took to buy one dinner in 1986. We can also say that Thanksgiving dinner became 68 percent more abundant.

Here is a chart showing the time price trend for the Thanksgiving dinner over the past 38 years:

The lowest time price for the Thanksgiving dinner was 1.87 hours in 2020, but then COVID-19 policies struck, and the time price jumped to 2.29 hours in 2022.

In 2023, the time price of the Thanksgiving dinner came to 2.09 hours. This year, it came to 1.91 hours – a decline of 8.8 percent. For the time it took to buy Thanksgiving dinner last year, we get 9.6 percent more food this year.

Between 1986 and 2024, the US population rose from 240 million to 337 million – a 40.4 percent increase. Over the same period, the Thanksgiving dinner time price decreased by 40.6 percent. Each one percentage point increase in population corresponded to a one percentage point decrease in the time price.

To get a sense of the relationship between food prices and population growth, imagine providing a Thanksgiving Day dinner for everyone in the United States. If the whole of the United States had consisted of blue-collar workers in 1986, the total Thanksgiving dinner time price would have been 77 million hours. By 2024, the time price fell to 64.2 million hours – a decline of 12.8 million hours or 16.6 percent.

Given that the population of the United States increased by 40.4 percent between 1986 and 2024, we can confidently say that more people truly make resources much more abundant.

An earlier version of this article was published at Gale Winds on 11/21/2024.

Business Standard | Food Prices

India’s Average Household Food Spending Falls Dramatically

“According to the paper, the share of total household expenditure on food has declined substantially in rural and urban areas across all states and UTs.

‘It is the first time in modern India (post-independence) that average household spending on food is less than half the overall monthly spending of households and is a marker of significant progress,’ it said.

The paper is a comprehensive analysis of the Household Consumption Expenditure Survey 2022/23 and comparison with 2011/12.

‘Overall, there has been a significant increase in households’ average monthly per capita expenditure across rural and urban India across all states and UTs,’ the paper said, adding that the magnitude of the rise is substantial but varies across states and regions.”

From Business Standard.