fbpx
01 / 05
Pizzabundance

Blog Post | Food Prices

Pizzabundance

Even with the recent price increase, Little Caesars pizza has become 80% more abundant since 1997.

Summary: This article examines how the price and abundance of pizza have changed over time in the United States, using Little Caesars pizza as an example. It shows that despite a recent price increase, pizza has become 80 percent more abundant since 1997, meaning that people can buy more pizza for their time.


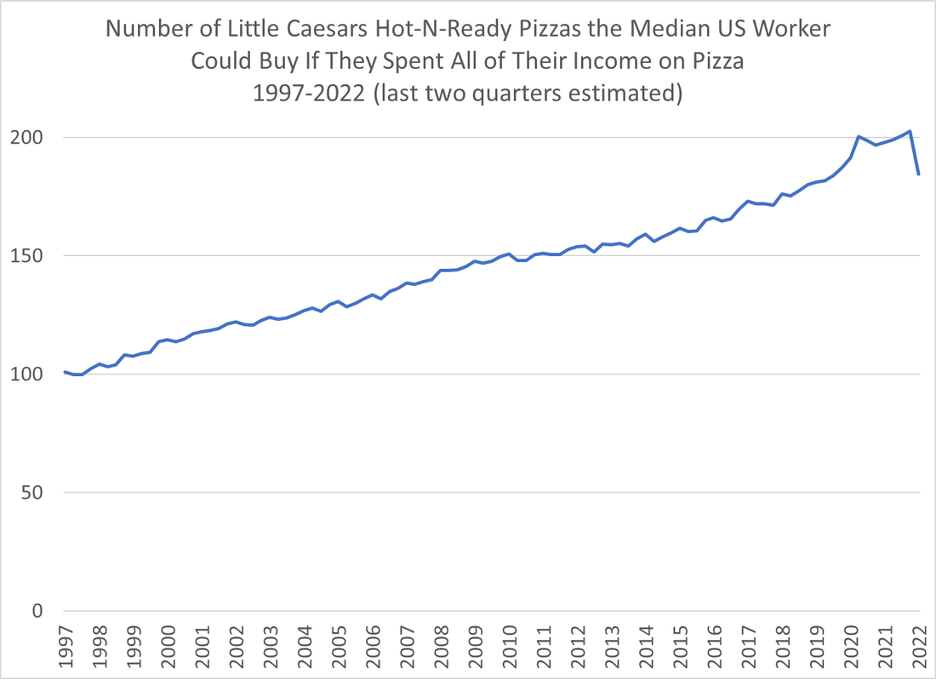
The pizza chain Little Caesars is raising the price of its famous $5 Hot-N-Ready pizza for the first time in a quarter-century. The staple diet of college students everywhere was first introduced in 1997. This fine chart provided by Professor Jeremy Horpedahl shows the number of pizzas the median U.S. worker could buy if they spent all their weekly earnings on pizza.

Number of Little Ceasars Hot-N-Ready Pizzas the Median US Worker Could Buy if they Spent All of their Income on Pizza

That’s a nice illustration of time prices. The nominal price stayed the same, but the time price fell by 50 percent because nominal wages doubled. You now get two pizzas for the time it took to earn the money to get one in 1997. Pizzas became 100 percent more abundant.

The New York Post reports that the price of the promotional pie, which was first advertised with shaker boards, is increasing by 11 percent to $5.55. Little Caesars CEO Dave Scrivano said the price hike is meant to balance rising labor and commodities costs, as the price of pepperoni has soared by more than 50 percent over the course of the pandemic.

After considering the recent price increase, these pizzas are still 44 percent less expensive today than they were in 1997. That means that you get 80 percent more pizza for your time today than 25 years ago. Pizza abundance is thus growing at 2.37 percent a year.

COVID may have claimed another victim, one that will be sadly missed in dorm rooms across the world, unless students can find 55 extra cents in their sofa cushions.

Blog Post | Trade

The Rising Tide: How Trade Lifts All Boats

Free exchange turns scarcity into abundance for rich and poor alike.

Summary: Trade has been a driving force behind economic growth, poverty reduction, and rising living standards across the globe. Far from harming the poor, open markets have helped lift billions out of extreme poverty while improving health, education, and life expectancy. History and modern evidence alike show that free exchange expands the economic “pie” for everyone, making prosperity the norm rather than the exception.


In his book The Rational Optimist, the British science writer Matt Ridley argued that economic progress began when people began to trade. “By exchanging,” he explained, “human beings discovered ‘the division of labour,’ the specialisation of efforts and talents for mutual gain… The more human beings diversified as consumers and specialised as producers, and the more they then exchanged, the better off they have been, are and will be.” For Ridley, “exchange is to cultural evolution as sex is to biological evolution.”

The Scottish father of economics, Adam Smith, recognized the economic potential of trade when he noted that “the liberal system of free exportation and free importation” is “not only the best palliative of a dearth, but [also] the most effectual preventative of a famine.”

While economists disagree on several policy issues, trade is generally not one of them. For example, survey data suggest that 95 percent of economists agree that tariffs tend to reduce economic welfare. Another 90 percent do not think the United States should restrict outsourcing.

You’d never know that by listening to today’s political debates. While protectionism is nothing new, the recent rise in anti-trade policies is an unfortunate setback for the United States and for the world.

Far from a rigged game that exploits those at the bottom, the globalization of the market system has brought global extreme poverty to its lowest levels in human history (Figure 1). That is why the Turkish-American Nobel Prize–winning economist Daron Acemoglu and his coauthors have described the creation of the market system as “one of the greatest achievements of humankind.”

Figure 1. Share of global population living in extreme poverty, including and excluding China.

Sources: World Bank Poverty and Inequality Platform 2024; Our World in Data 2024.

Note: Extreme poverty is defined as living below the International Poverty Line of $2.15 per day. These data are adjusted for inflation and for differences in living costs between countries. These data are expressed in international dollars at 2017 prices. The data relates to income measured after taxes and benefits, or to consumption per capita.

Furthermore, despite claims to the contrary, the United States’ participation in the global economy has significantly benefited American consumers and workers. Real incomes have not stagnated over the past few decades. They’ve risen, including for those at the bottom of the income distribution (Figure 2).

Figure 2. Real median personal income in the United States

Source: Federal Reserve Economic Data (FRED), St. Louis Fed

Note: Shaded areas indicate US recessions.

Nor has international trade hollowed out American manufacturing. While employment in the sector has declined as a result of automation and productivity gains, manufacturing output—especially output per worker—has increased.

As Michael Strain from the American Enterprise Institute observes, “America is upwardly mobile, particularly for those nearer the bottom of the income distribution. Incomes aren’t stagnant. Workers do enjoy the fruits of their labor. The argument that life hasn’t improved for typical households in decades borders on the absurd. The game is not rigged. The American Dream is not dead (Figure 3).”

Figure 3. Average real wage at percentiles of the wage distribution

Source: Michael Strain, The American Dream Is Not Dead, p. 47.

In a 2020 article, I reviewed the scholarship linking trade to economic growth and poverty reduction. Overall, the empirical literature shows that trade reduces poverty predominantly through economic growth. Critics sometimes claim that growth leaves those at the bottom behind. It may improve the average, they say, but only because of large income boosts at the top.

That talking point is simply untrue. Economic freedom, including openness to trade, and growth have been shown to improve incomes across the board. A rising tide truly does lift all boats, not just the yachts of the wealthy. Growth positively touches every tier of the economic ladder. A bigger economic pie means better living standards for everyone involved, making economic growth propoor.

The Indian economist Arvind Panagariya has documented trade’s role in the economic success of Hong Kong, Singapore, Taiwan, South Korea, India, China, and other countries throughout Asia, Africa, and Latin America. Across more than 200 jurisdictions and five decades of data, he found a causal relation between trade and per capita income: the countries that experienced intensive growth always maintained a high and/or expanding trade-to-GDP ratio.

In a new review of the literature, Dartmouth’s Douglas Irwin found the same thing. The empirical research on trade liberalization has been “remarkably consistent” in its conclusion that open trade fosters growth in productivity and, therefore, standards of living (Tables 1 and 2). Tariffs, on the other hand, hold growth, productivity and standards of living back. Previous literature reviews have come to similar conclusions. That is why economists from all sides of the political spectrum come together on trade.

Table 1. Selected studies of trade reform and economic growth.

Source: Irwin, “Does Trade Reform Promote Economic Growth?” p. 162.

Despite the populist rhetoric about helping the American workers and consumers, those same workers and consumers end up eating the cost of tariffs in the form of higher prices. The negative effects of protectionism also have a disproportional impact on the poor, who tend to gain the most from trade.

And keep in mind that living standards aren’t just about income. Open market economies have higher adult literacy rates, longer life expectancies, lower infant mortality rates, better environmental stewardship, and greater life satisfaction than closed economies do. As Nobel Prize–winning American economist Robert Lucas wrote, “The consequences for human welfare involved in questions [about economic growth] are simply staggering. Once one starts to think about them, it is hard to think about anything else.”

Table 2. Selected studies of trade reform and industry productivity

Source: Irwin, “Does Trade Reform Promote Economic Growth?” p. 168.

Note: TFP = total factor productivity.

Income inequality is a major criticism of an open economy, but, interestingly enough, most studies find no relation between greater economic freedom and income inequality (though the findings are somewhat mixed). It’s worth noting that concerns over income inequality are often concerns over inequality within already rich countries. When it comes to inequality, in other words, it tends to be the global rich arguing with the super global rich (and much of that concern is overblown).

But look at the bigger picture. Overall, globalization has led to both a decline in global poverty and global inequality (Figure 4).

Figure 4. Global income inequality: Gini index, 1820–2020

Note: Global inequality, as measured by the global Gini coefficient, rose from about 0.6 in 1820 to about 0.7 in 1910 and then stabilized around 0.7 between 1910 and 2020. It is still too early to say whether the decline in the global Gini coefficient observed since 2000 will continue.

Income is measured per capita after pension and unemployment insurance transfers and before income and wealth taxes.

According to the 2024 “Economic Freedom of the World” report, the share of income earned by the poorest 10 percent in the most economically free countries is about the same as that of the poorest 10 percent in the least economically free countries. In other words, the income distribution—the slicing of the economic pie—looks the same across countries, no matter the level of economic freedom.

Figure 5. Economic freedom and income share of lowest 10 percent

But the amount of income earned by the poorest 10 percent in the most economically free countries is eighttimes that of the poorest 10 percent and slightly more than the average person in the least economically free countries (Figures 5 and 6). The poor’s portion of the economic pie may be the same across countries, but free countries have bigger pies.

Figure 6. Economic freedom and income share of lowest 10 percent

We did not redistribute our way into riches or plunder our way into prosperity. Instead, the historical shifts both institutionally and culturally in favor of a trade economy led to a radical upsurge in material well-being that the American economist Deirdre McCloskey has aptly labeled “The Great Enrichment”:

In the two centuries after 1800 the trade-tested goods and services available to the average person in Sweden or Taiwan rose by a factor of 30 or 100. Not 100 percent, understand—a mere doubling—but in its highest estimate a factor of 100, nearly 10,000 percent, and at least a factor of 30, or 2,900 percent. The Great Enrichment of the past two centuries has dwarfed any of the previous and temporary enrichments.

It’s not that we suddenly figured out how to slice up the economic pie just right. We made the pie 2,900 to 10,000 percent bigger through commercial exchange. When the pie is bigger, there’s more pie to go around. And we’re all richer for it.

Blog Post | Food Prices

Thanksgiving Dinner Will Be 8.8 Percent Cheaper This Year

Be thankful for the increase in human knowledge that transforms atoms into valuable resources.

Summary: There has been a remarkable decrease in the “time price” of a Thanksgiving dinner over the past 38 years, despite nominal cost increases. Thanks to rising wages and innovation, the time required for a blue-collar worker to afford the meal dropped significantly, making food much more abundant. Population growth and human knowledge drive resource abundance, allowing for greater prosperity and efficiency in providing for more people.


Since 1986, the American Farm Bureau Federation (AFBF) has conducted an annual price survey of food items that make up in a typical Thanksgiving Day dinner. The items on this shopping list are intended to feed a group of 10 people, with plenty of leftovers remaining. The list includes a turkey, a pumpkin pie mix, milk, a vegetable tray, bread rolls, pie shells, green peas, fresh cranberries, whipping cream, cubed stuffing, sweet potatoes, and several miscellaneous ingredients.

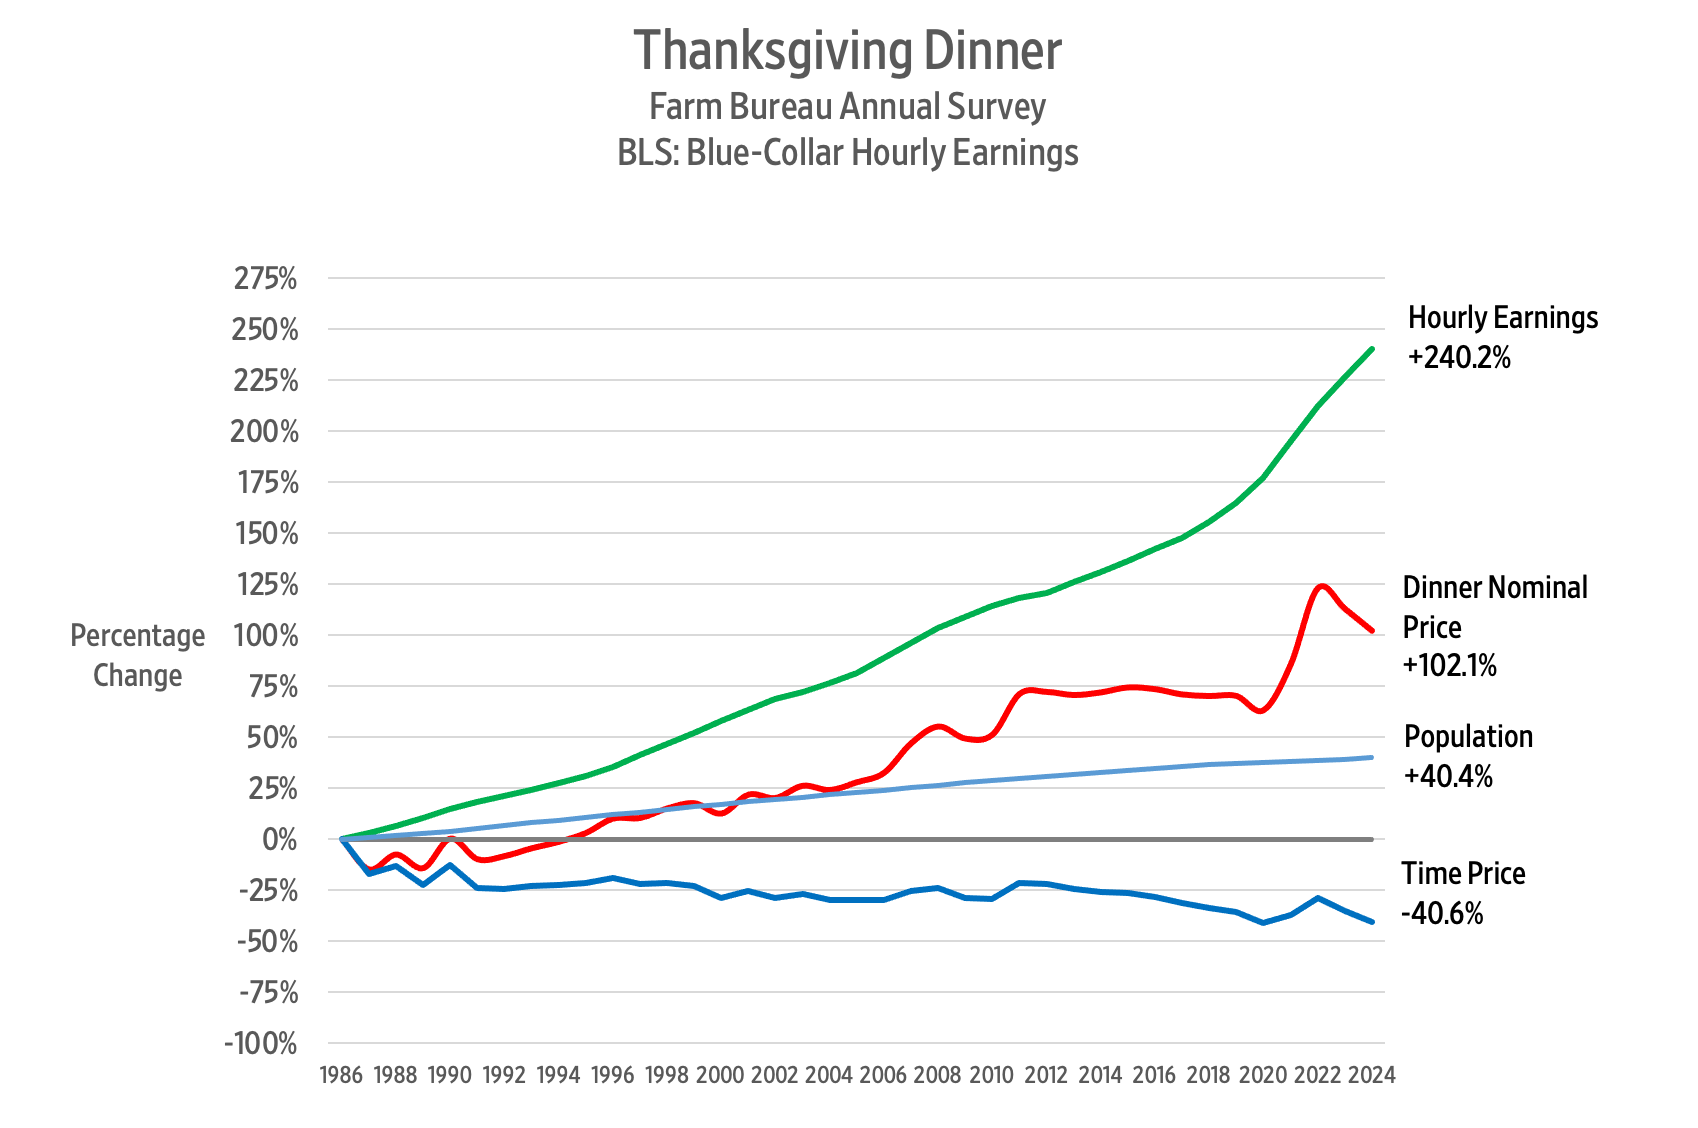
So, what has happened to the price of a Thanksgiving Day dinner over the past 38 years? The AFBF reports that in nominal terms, the cost rose from $28.74 in 1986 to $58.08 in 2024. That’s an increase of 102.1 percent.

Since we buy things with money but pay for them with time, we should analyze the cost of a Thanksgiving Day dinner using time prices. To calculate the time price, we divide the nominal price of the meal by the nominal wage rate. That gives us the number of work hours required to earn enough money to feed those 10 guests.

According to the Bureau of Labor Statistics, the blue-collar hourly wage rate increased by 240.2 percent – from $8.96 per hour in October 1986 to $30.48 in October 2024.

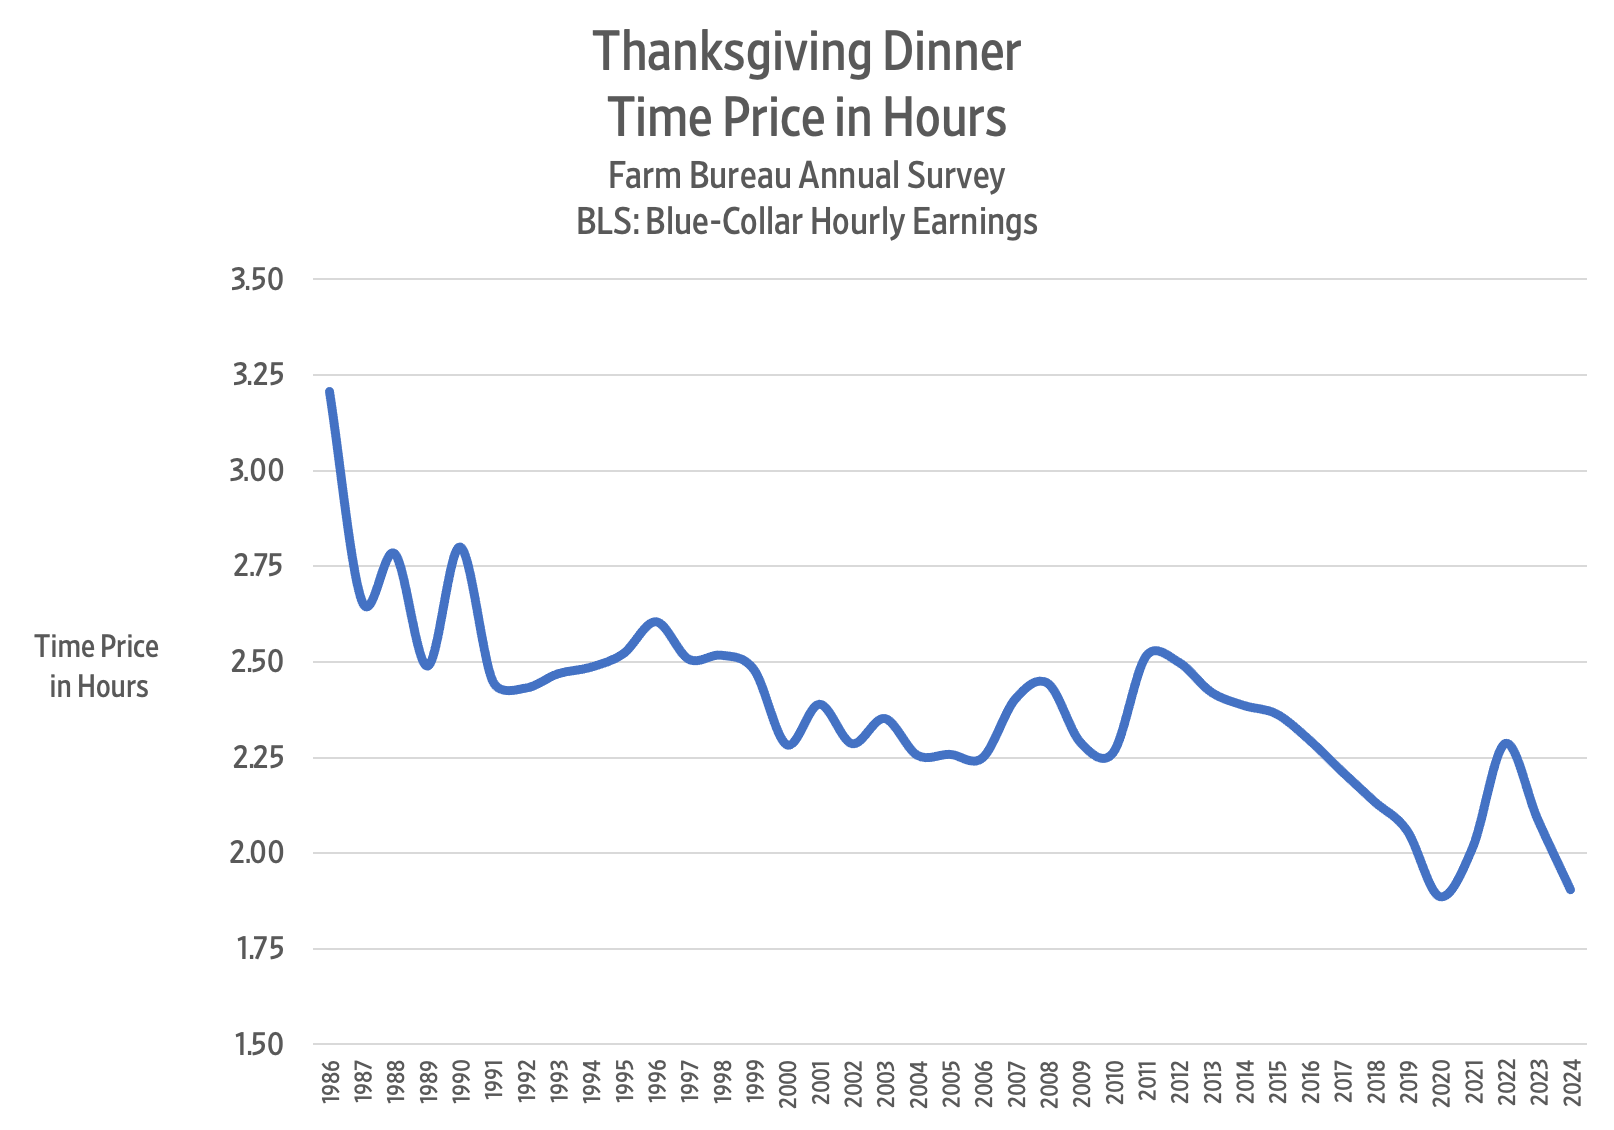
Remember that when wages increase faster than prices, time prices decrease. Consequently, we can say that between 1986 and 2024 the time price of the Thanksgiving dinner for a blue-collar worker declined from 3.2 hours to 1.9 hours, or 40.6 percent.

That means that blue-collar workers can buy 1.68 Thanksgiving Day dinners in 2024 for the same number of hours it took to buy one dinner in 1986. We can also say that Thanksgiving dinner became 68 percent more abundant.

Here is a chart showing the time price trend for the Thanksgiving dinner over the past 38 years:

The figure shows that the time price of a Thanksgiving dinner for a blue collar worker has gone down since 1986.
The figure shows that the time price of a Thanksgiving meal has decreased, while population, the nominal price of the meal, and hourly earnings have all increased.

The lowest time price for the Thanksgiving dinner was 1.87 hours in 2020, but then COVID-19 policies struck, and the time price jumped to 2.29 hours in 2022.

In 2023, the time price of the Thanksgiving dinner came to 2.09 hours. This year, it came to 1.91 hours – a decline of 8.8 percent. For the time it took to buy Thanksgiving dinner last year, we get 9.6 percent more food this year.

Between 1986 and 2024, the US population rose from 240 million to 337 million – a 40.4 percent increase. Over the same period, the Thanksgiving dinner time price decreased by 40.6 percent. Each one percentage point increase in population corresponded to a one percentage point decrease in the time price.

To get a sense of the relationship between food prices and population growth, imagine providing a Thanksgiving Day dinner for everyone in the United States. If the whole of the United States had consisted of blue-collar workers in 1986, the total Thanksgiving dinner time price would have been 77 million hours. By 2024, the time price fell to 64.2 million hours – a decline of 12.8 million hours or 16.6 percent.

Given that the population of the United States increased by 40.4 percent between 1986 and 2024, we can confidently say that more people truly make resources much more abundant.

An earlier version of this article was published at Gale Winds on 11/21/2024.

NBC News | Personal Income

The Typical US Worker Out-Earned Inflation by $1,400 a Year

“While higher costs for everything from milk to medicines have preoccupied U.S. consumers in the pandemic era, earnings have also risen enough, on average, to push up households’ purchasing power a bit. And blue-collar workers have been the biggest beneficiaries.

An analysis published in July by economists at the Treasury Department found that the median worker can afford the same representative basket of goods and services as they did in 2019 — plus have an additional $1,400 a year.”

From NBC News.

Wall Street Journal | Wealth & Poverty

The Dramatic Turnaround in Millennials’ Finances

“The median household net worth of older millennials, born in the 1980s, rose to $130,000 in 2022 from $60,000 in 2019, according to inflation-adjusted data from the Federal Reserve Bank of St. Louis. Median wealth more than quadrupled to $41,000 for Americans born in the 1990s, which includes the generation’s youngest members, born in 1996. 

The turnaround has been so dramatic that millennials—mocked at times for being perpetually behind in building wealth, buying homes, getting married and having children—now find themselves ahead.

In early 2024, millennials and older members of Gen Z had, on average and adjusting for inflation, about 25% more wealth than Gen Xers and baby boomers did at a similar age, according to a St. Louis Fed analysis.”

From Wall Street Journal.