Nineteenth Century Inequality Not As Bad As We Think
A proper interpretation of consumption data shows that the 1800s fostered an egalitarian shift in wealth distribution.
Joakim Book —
When prices change, how that impacts people depends crucially on which prices increase and what goods and services people are consuming. Across the western world, price inflation–the rate at which prices increase–has been relatively slow for over a decade. Central bankers have consistently undershot their inflation targets despite their careful implentation of complex monetary policy.
The supposed dearth of inflation might seem like small comfort–or a cruel joke–to the Californian hipster paying $15 for a smoothie bowl, the German renter whose rents are increasing at a stunning rate or the London young professional shoveling out £5 for an unimpressive lunch sandwich. The larger the diversity in consumption patterns, the less appropriate it is to aggregate price changes into a general price index such as CPI or PCE statistics.
One reason for the dissonance between official figures and real-world experience is the weight that statisticians place on various items when constructing a consumer price index (e.g. the Bank of England’s CPI; the ECB’s HICP; the Fed’s PCE). For instance, in the price index used by the European Central Bank, housing costs make up only 17% of the index, whereas the Federal Reserve places a 24% weight on housing expenses. That divergence turns a 25% increase in housing costs–with all other prices and consumption patterns held constant–into a 4.25% overall inflation in the Eurozone but a 6% inflation in the U.S.
While policymakers are aware of those data limitations and we have standardized statistical ways to adjust for quality improvements, these problems can still cause headaches. One illustrative example is the impact of iPhone prices on Sweden’s price index; Martin Enlund, FX strategist at Nordea, estimates that the quality adjustment of iPhones alone reduced the reported price increase by 0.1 percentage points every year for the last 5 years.
That minor detail has some implication for our modern world, considering that the Riksbank’s interest rate decisions have turned on such small margins before. Looking at these differences in consumption bundles and quality adjustments over longer historical periods, they quickly become astronomical. In a famous paper, Nobel Laureate William Nordhaus surveyed “lumens”–a unit for light–emitted by various sources throughout the centuries. Nordhaus estimated the price of light, the essential service its originators provide us with, to have fallen by 99.97% between 1800 and 1992.
Over decades or centuries, even small differences can result in very large adjustments when we evaluate past incomes. For instance, how much better is a computer as a calculating tool than an abacus? Is a keyboard and word processor ten, fifty or a hundred times better than quills, ink, and bulky, slowly decaying paper?
A recent study by Vincent Geloso and Peter Lindert makes a big deal out of consumption bundles. By disaggregating purchases by working classes and upper classes, they make a revolutionary discovery: beginning earlier than we used to believe, the poor’s standards of living improved faster than those of the rich. Contrary to the tired claim that capitalism involves the rich getting richer while the poor get poorer, it seems that during the 19th century the opposite was true.
The authors reach this conclusion by using different consumption bundles for two different income segments. People’s standards of living depend on what they themselves consume, not on what they could buy if they had the rich’s consumption patterns:
“[T]he contrasts that matter are contrasts in individuals’ abilities to buy what they care to buy, or need to buy, and not the (nominal) inequality in their ability to buy the same common bundle as some other class could buy.”
The components that drove this extraordinary reduction in cost of living, argue Geloso and Lindert, were falling prices of grain-based foods and a rise in the relative price of services that the poorer classes supplied (mostly wage rates for common labor).
The American rise in inequality over the nineteenth century, using both top-1% / bottom-99% and top-10% / bottom-40% metrics, is much less pronounced than previously believed. The authors conclude:
“[T]he ‘nineteenth-century’ period 1815–1914 brought a clearly egalitarian shift in the price structure for all four countries—England, Canada, the USA, and post-1850 Australia. The net change over these 100 years is unmistakable.”
A century before Paul Ehrlich would predict imminent starvation in the entire world (specifically in what he thought was a remarkably backwards India), the world surplus of grains had enriched the poor–even in the “dark Satanic mills” of Britain. The lower relative price of grains mitigated and partly reversed the economic inequality we tend to associate with the nineteenth century.
The exact bundles used to measure consumption matter greatly for understanding prosperity, today as well as in the past.
Populism feeds on myths about living standards that simply don't stand up to scrutiny.
Marian L. Tupy —
Back in May, a young American called Akki caused a minor twitterstorm by seemingly showing what many pundits in the U.S. media frequently assert – that ordinary Americans are worse off today than they were in the late 1970s. A number of better educated twitterati soon pointed out that Akki, a self-declared member of #TheResistance, engaged in what former U.S. President George W. Bush once referred to as “fuzzy math.” In the meantime, Akki’s misleading claim scored over 197,000 likes on Twitter. It seems that in addition to the U.S. dollar, Americans have come to crave a new kind of currency: victimhood. Many Americans of all political persuasions relish the feeling of aggrievement and the accompanying sense of moral superiority, and if that means that they have to pretend that their lives are worse than those of their ancestors, so be it.
Per Akki, a loaf of bread in 1977 cost $0.32. In May 2019, it cost $1.98. In the meantime, the median income per person, Akki also claimed, remained the same. Ergo, Americans were worse off in 2019 than they were in 1977. The data from the Federal Reserve Bank of St. Louis, the most authoritative of sources, tells a somewhat different story. The real median income per person in 1977 came to $23,202. It stood at $31,099 in 2016 (the last year for which data are available). Both figures are in 2017 dollars. So, an American in the middle of the income spectrum was about $7,897 (or 34 percent) better off in 2016 than he or she would have been in 1977. And that’s not counting the increase in non-wage benefits that, due to the quirks of the U.S. tax code, continue to expand. As for the price of bread, Akki’s $0.32 would amount to $1.36 today. Target sells a loaf of bread for $1.09.
Thanks to Akki and many other misinformed people on both sides of the political spectrum, a myth of stagnating American standards of living has arisen and continues to spread. According to South Bend mayor and 2020 Democratic presidential hopeful Pete Buttigieg, the supposed stagnation started with the election of Ronald Reagan to the U.S. presidency in 1980. But, of course! “What we’ve seen is that the rising tide rose, right? GDP went up. Growth went up. Productivity went up — big numbers went up and most of our boats didn’t budge. For 90 percent of Americans, you start the clock right around the time I’m born [1982]. Income didn’t move at all — so lower to middle income, really, almost all of us,” Buttigieg said.
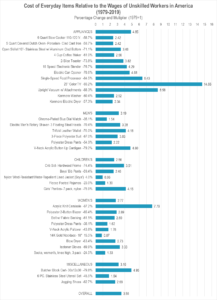
Having shown the massively decreasing cost of food in the United States in previous columns, I shall now turn to the cost of other everyday items, including appliances and clothing, between 1979 (the year before Reagan’s election) and 2019. Together with Gale Pooley, associate professor of business management at Brigham Young University-Hawaii, I looked at the prices of everyday items as they appeared in the 1979 Sears Christmas Book and compared them to the prices of identical (or almost identical) items as they appeared on Walmart’s website in 2019. We then divided the Sears’ prices by the hourly wage of unskilled workers in 1979 ($3.69) and Walmart’s prices by the hourly wage of unskilled workers in 2019 ($12.78).
The average time price (i.e., the amount of time that a person has to work in order to earn enough money to buy something) of everyday items relative to the hourly wages of unskilled workers declined by 72 percent. It declined by 75 percent for skilled workers and by 89 percent for upskilling workers (i.e., workers who started as unskilled workers in 1979, but ended up as skilled workers in 2019). That means that for the same amount of work that allowed an unskilled worker to purchase one item in our basket of everyday items in 1979, he or she could buy 3.56 items in 2019 (on average). A skilled worker’s purchasing power increased from one to four and upskilling worker’s purchasing power increased from one to nine.
There are a lot of reasons for the rise of populism in the West, but one, almost trite, reason is often overlooked. Our schools and our media not only fail to educate the citizenry; they actively mis-educate the electorate. Instead of showing the unbelievable progress that humanity has made since the start of the Enlightenment some three centuries ago, history classes, to the extent that history is still taught, are used to whip up resentment and a sense of victimhood among different socio-economic, racial, ethnic, religious and gender groups. The media breathlessly repeat stories of (real and imagined) oppression and (supposed) economic retrenchment, even though people in the West currently enjoy a period of unprecedented peace and prosperity. Akki’s tweet is but a tiny part of a broader trend of victimhood-Olympics.
So, to the question that is so often raised by so many talking-heads on television, professors in the classroom and politicians making stump speeches – Why populism? – I have only one answer: look in the mirror.
Unskilled Workers and Food Prices in America (1919-2019)
Basic food items in America have become almost eight times cheaper relative to unskilled labor over the last 100 years.
Marian L. Tupy —
Speaking to an enthusiastic crowd at the South by Southwest conference in Texas on March 9, Congresswoman Alexandria Ocasio-Cortez (D-NY) stated that “Capitalism is an ideology of capital – the most important thing is the concentration of capital and to seek and maximise profit … we’re reckoning with the consequences of putting profit above everything else in society. And what that means is people can’t afford to live.” “Capitalism is irredeemable,” she concluded.
The cost of living isn’t easy to calculate. A declining cost of home appliances, for example, needs to be juxtaposed with the growing cost of healthcare, etc. In the space of this short op-ed, I want to focus on an expense that is intimately tied up with the very survival of human beings – the price of food. Throughout the history of our species, people lived in a state of undernourishment. In developed countries today, obesity is a growing problem and food is cheaper than ever.
In fact, basic food items in America have become almost eight times cheaper relative to unskilled labor over the last 100 years.
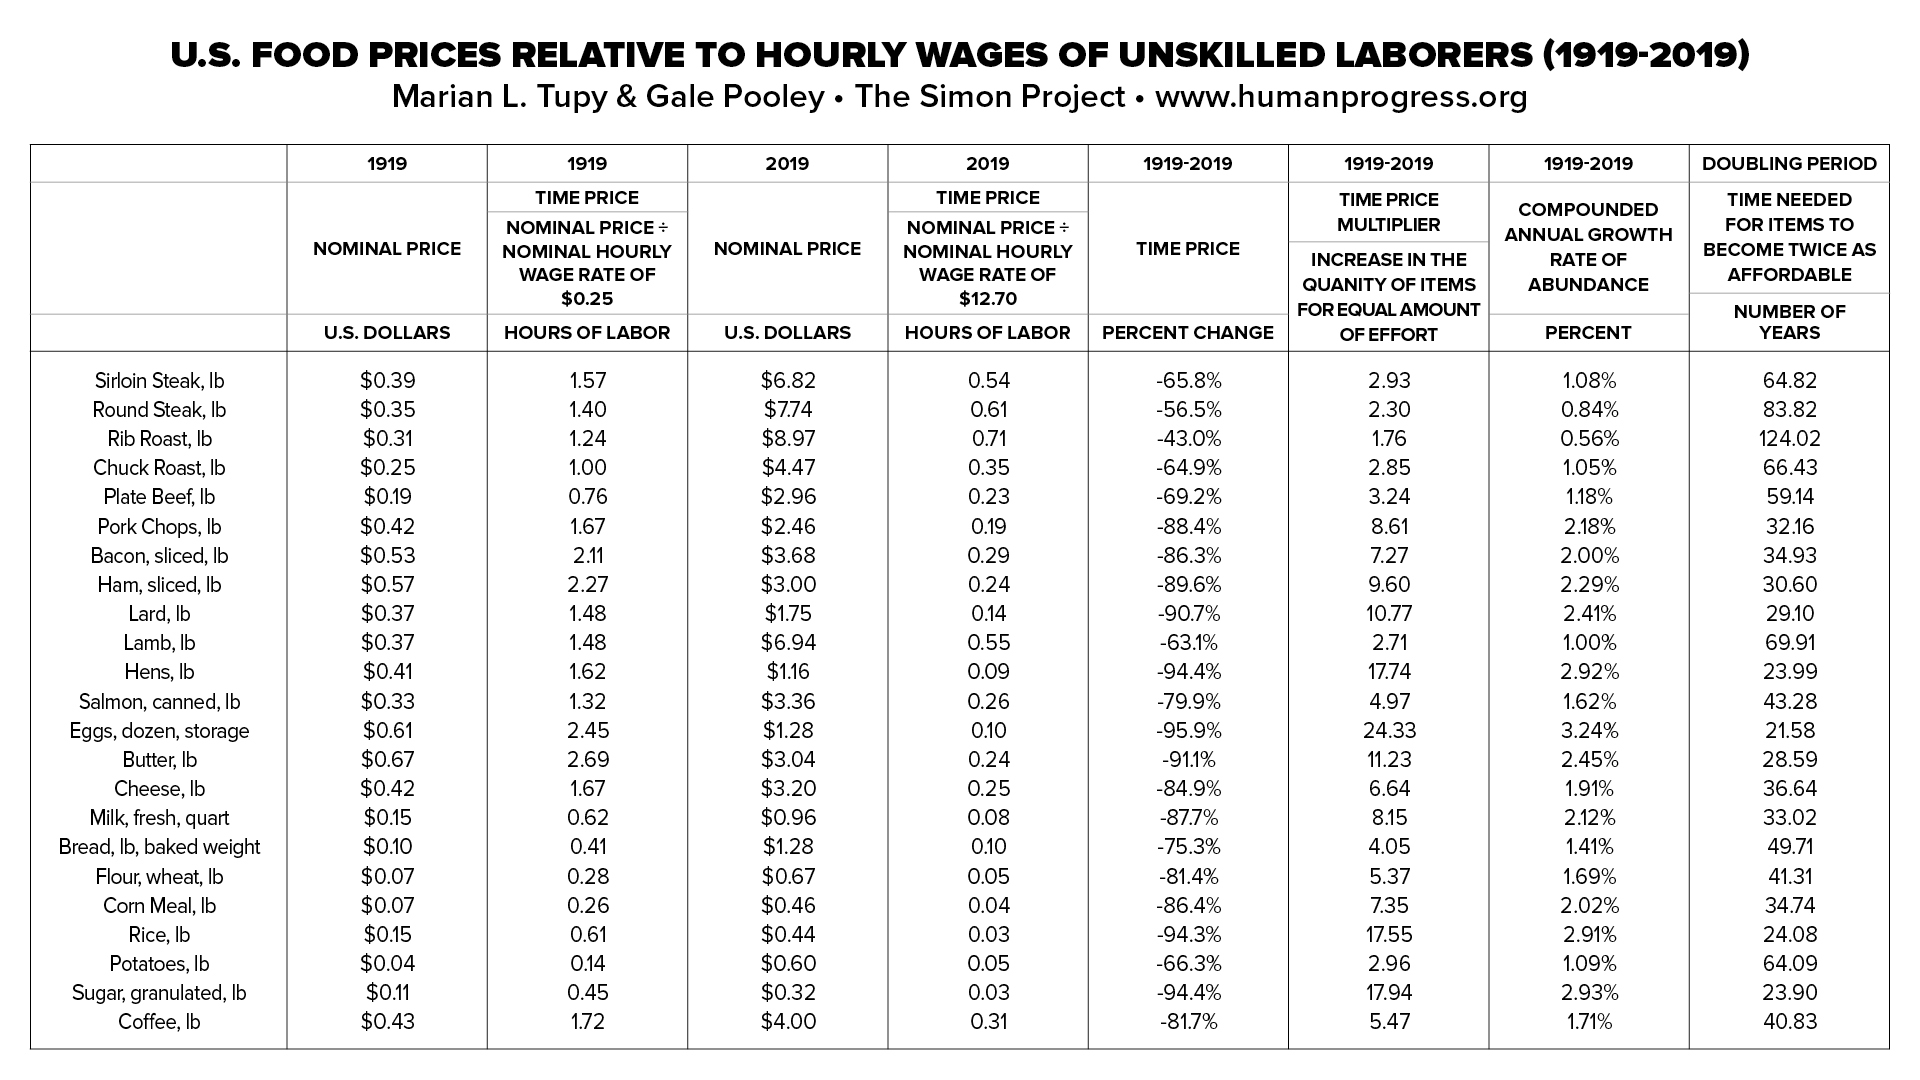
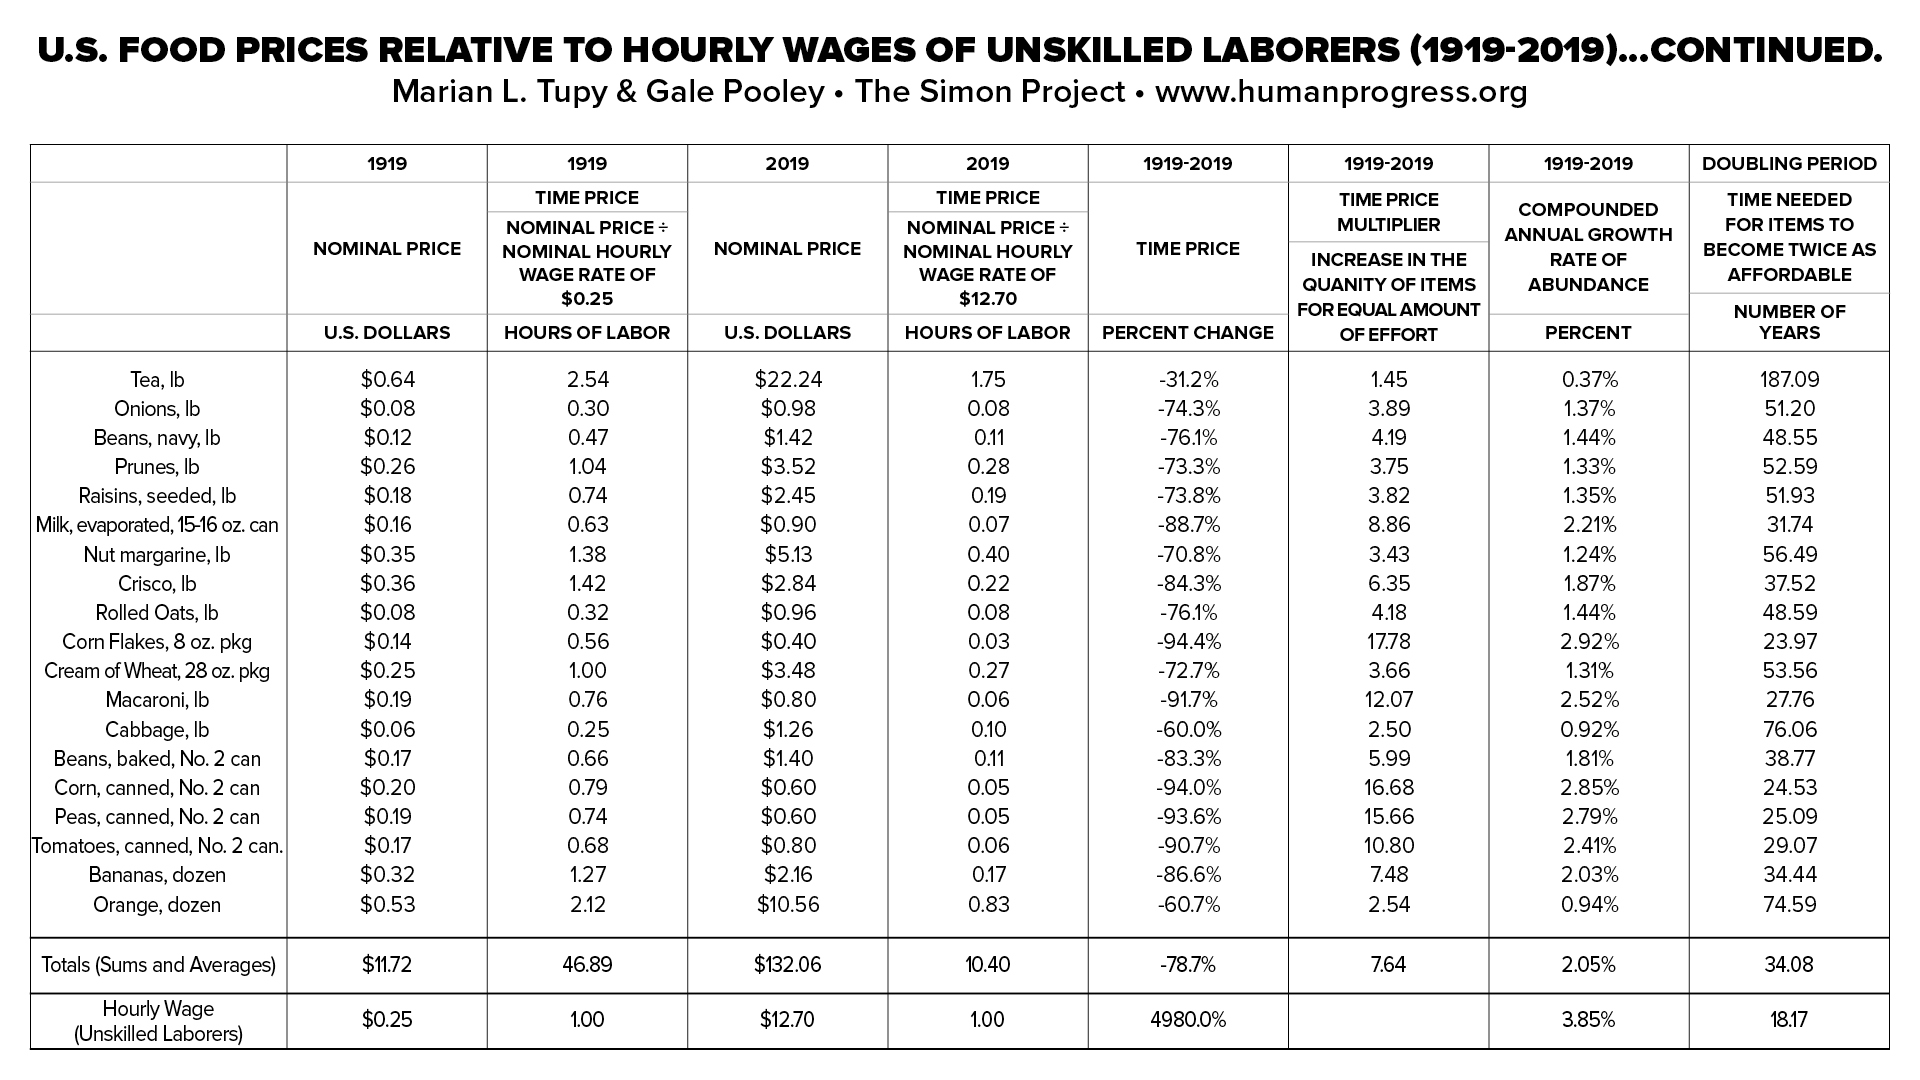
This analysis of the cost of food in America over the last century begins with Retail Prices, 1913 to December 1919: Bulletin of the United States Bureau of Labor Statistics, No. 270, which was published in 1921. On pages 176-183, we encounter nominal prices of 42 food items – ranging from a pound of sirloin steak to a dozen oranges – as registered in the city of Detroit in 1919. Those can be seen in the second column of the attached graphic.
Our second step was to express those nominal prices in terms of hours of human labor. Together with Gale Pooley, associate professor of business management, Brigham Young University-Hawaii, we took the index of hourly wages of unskilled laborers (i.e., workers at the bottom of the income ladder) between 1774 and 2016 from www.measuringworth.com and re-indexed it to 1919. That gave us a nominal wage rate of unskilled laborers amounting to $0.25 per hour in 1919. The nominal prices of food relative to nominal wages in 1919 can be seen in column 3.
Our third step was to find the nominal prices of the same goods (including, of course, the same quantity of those goods) on www.walmart.com, which is where most unskilled laborers shop in 2019. Those findings can be seen in column 4. According to our calculations, the nominal wage rate of unskilled laborers amounts to about $12.70 per hour today. As such, the nominal prices of food relative to nominal wages in 2019 can be seen in column 5.
What did we find?
The time price (i.e. nominal price divided by nominal hourly wage) of our basket of commodities fell from 47 hours of work to ten (see the Totals line in column five).
The unweighted average time price fell by 79 percent (see the Totals line in column six).
Put differently, for the same amount of work that allowed an unskilled laborer to purchase one basket of the 42 commodities in 1919, he or she could buy 7.6 baskets in 2019 (see the Totals line in column seven).
The compounded rate of “affordability” of our basket of commodities rose at 2.05 percent per year (see the Totals line in column eight).
Put differently, an unskilled laborer saw his or her purchasing power double every 34 years (see the Totals line in column nine).
Pay particular attention to column six and note that declining prices result in exponential, not linear, gains. Thus, a 75 percent decline in price allows a person to purchase four items; a 90 percent decline results in ten items; a 95 percent decline in 20 items; and a 96 percent decline in 25 items. A 1 percentage point change from 95 percent to 96 percent, in other words, enhances the gain by 25 percent.
Thus eggs, which declined by 96 percent in terms of time price between 1919 and 2019, allow the unskilled laborer today to purchase 24 times as many eggs as an unskilled laborer was able to purchase for the same amount of work a century ago. That’s a massive improvement – even if we ignore the likelihood that an unskilled laborer today performs work that is less physically strenuous and less dangerous than it was in 1919.
Far from being irredeemable, therefore, a market that’s allowed to function relatively freely and competitively has delivered and can continue to deliver enormous benefits to all people, especially those at the bottom of the income ladder.
Joseph Schumpeter, the famous economist who served as Austrian minister of finance in 1919, observed that the “capitalist engine is first and last an engine of mass production which unavoidably also means production for the masses … It is the cheap cloth, the cheap cotton and rayon fabric, boots, motorcars and so on that are the typical achievements of capitalist production, and not as a rule improvements that would mean much to the rich man. Queen Elizabeth owned silk stockings. The capitalist achievement does not typically consist in providing more silk stockings for queens but in bringing them within reach of factory girls.”
To those silk stockings we can now add food.
For Blue-Collar Workers and Food Prices in America (1919-2019) go here.
Listen to our editor, Marian L. Tupy, discuss HumanProgress.org and the Simon Abundance Index
Alexander C. R. Hammond —
Resources in general have become cheaper in inflation-adjusted terms — as well as relative to the cost of labor — over the last four decades. That’s all the more remarkable considering that the world’s population has massively expanded over the same time period.
Resource depletion has been a hotly debated topic since the publication of Paul Ehrlich’s The Population Bomb in 1968. The Stanford University biologist warned that population growth would result in the exhaustion of resources and a global catastrophe. “Since natural resources are finite,” he noted some years later, “consumption obviously must ‘inevitably lead to depletion and scarcity’ … Petroleum is a textbook example of such a resource.” The late University of Maryland economist Julian Simon disagreed. In his 1981 book The Ultimate Resource, Simon argued that humans were intelligent beings, capable of innovating their way out of shortages. And so we have. Fracking, to give just one example, has enabled us to tap previously inaccessible oil reserves, thus turning the United States into a fossil-fuel super-power.
Marian Tupy and Gale Pooley’s findings in a recently published paper, titled The Simon Abundance Index, confirms Simon’s thesis. They revisited the debate by looking at 50 foundational commodities covering energy, food, materials, and metals. Between 1980 and 2017, the real price of commodities fell by 36 percent on average. Also, due to productivity gains, the price of labor increases faster than inflation. Commodities that took 60 minutes of work to buy in 1980 took only 21 minutes of work to buy in 2017. Put differently, the time-price of commodities fell by 64.7 percent.
Listen to our editor, Marian L. Tupy, discussing his new study on the new Institute for Energy Research podcast here.
Hourly wages do not reflect the massive expansion in non-wage benefits since the 1950's.
Marian L. Tupy —
In recent years, many US politicians and journalists have warned that the millennials are at the risk of ending up “poorer than their parents.” The evidence certainly suggests that the Great Recession has led to wage stagnation and high unemployment among young Americans, who have soured on the idea of achieving the American Dream.
The just-released Victims of Communism Memorial Foundation’s Annual Report on Generational Attitudes toward Socialism in America, for example, has found that 52 per cent of millennials would prefer to live in a socialist (46 per cent) or a communist (6 per cent) country. Conversely, only 40 per cent want to live in a capitalist one. Mercifully, Americans tend to associate socialism with the high-tax and high-redistribution welfare states of Scandinavia rather than the Marxist dictatorships of the days of yore.
Before they reject American-style capitalism, however, millennials should consider how prosperous ordinary Americans really are.
Economic prosperity is often measured in terms of personal income or wealth. Neither of those two measures, however, provides a full picture of people’s material wellbeing, for standards of living can increase due to either income growth or falling prices. People with stagnating incomes, for example, can experience material improvements if prices decline. Even people with falling incomes can be better off – as long as the cost of living decreases at a faster pace than incomes shrink.
As Ball State University economist Steven Horwitz wrote in his 2015 article Inequality, Mobility and Being Poor in America, “If the reason we care about incomes and wealth is because of what they enable people to consume, and thereby acquire goods that add to some broad notion of well-being, then it might also be worthwhile to look at some of the data on consumption to see what it suggests about … the real condition of the poor.”
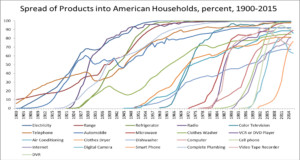
Consider the cost and adoption of home appliances. As late as 1971, only 43.3 per cent of all US households had a colour TV. By 2005, 97.4 per cent of poor American households owned one. Similar stories can be told of washing machines, dishwashers, clothes dryers, refrigerators, freezers, stoves and vacuum cleaners.
As Horwitz noted, “Poor US households are more likely to have basic appliances than the average household of the 1970s, and those appliances are of much higher quality.” Not only do more people across the income spectrum enjoy access to previously unaffordable goods, but the speed of adoption of new products is increasing.
As W Michael Cox and Richard Alm from the Southern Methodist University showed in their 2015 paper Onward and Upward: Bet on Capitalism—It Works, it took about 50 years between the time that the telephone was invented and the time that 50 per cent of US households owned one. In contrast, it took just 12 years from the emerge of the smartphone for 50 per cent of individual Americans to own one.
Note that all this material progress took place even though the hourly wages of many American workers stagnated. Between January 1968 and January 2018, the inflation-adjusted average hourly wage in the manufacturing sector rose from $20.43 to $21.27. Manufacturing accounts for 19 percent of all US employment and wage stagnation among factory workers may be seen as analogous to the flat-lining incomes among millennials.
Source: W Michael Cox and Richard Alm, Onward and Upward: Bet on Capitalism—It Works
Bearing the above wage numbers in mind, how come most Americans can now enjoy goods that were previously owned only by the rich?
First, it is important to note that hourly wages do not reflect the massive expansion in non-wage benefits, which rose from 19 per cent of wages in 1951 to 44 per cent in 2015. Today non-wage benefits include relocation assistance, medical and prescription coverage, vision and dental coverage, health and dependent care, flexible spending accounts, retirement benefit plans, group-term life and long-term care insurance plans, legal and adoption assistance plans, child care and transportation benefits, vacation and sick paid time-off, and employee discount programs from a variety of vendors, etc.
Also, many commonly owned goods have declined in price. In 1968, for example, a 23” Admiral colour TV cost $2,544 or 125 hours of labour in the manufacturing sector. In 2018, a 24” Sceptre HD LED TV cost $99.99 or 4.7 hours of labour in the same sector (all prices are in 2018 US dollars). That’s a reduction of 96 per cent in terms of human effort.
The upshot is that growth in nominal wages, or lack thereof, does not reflect the real changes in the standard of living experienced by vast majority of Americans. That’s something to keep in mind when young Americans contemplate the choice between capitalism and socialism.