Nineteenth Century Inequality Not As Bad As We Think
A proper interpretation of consumption data shows that the 1800s fostered an egalitarian shift in wealth distribution.
Joakim Book —
When prices change, how that impacts people depends crucially on which prices increase and what goods and services people are consuming. Across the western world, price inflation–the rate at which prices increase–has been relatively slow for over a decade. Central bankers have consistently undershot their inflation targets despite their careful implentation of complex monetary policy.
The supposed dearth of inflation might seem like small comfort–or a cruel joke–to the Californian hipster paying $15 for a smoothie bowl, the German renter whose rents are increasing at a stunning rate or the London young professional shoveling out £5 for an unimpressive lunch sandwich. The larger the diversity in consumption patterns, the less appropriate it is to aggregate price changes into a general price index such as CPI or PCE statistics.
One reason for the dissonance between official figures and real-world experience is the weight that statisticians place on various items when constructing a consumer price index (e.g. the Bank of England’s CPI; the ECB’s HICP; the Fed’s PCE). For instance, in the price index used by the European Central Bank, housing costs make up only 17% of the index, whereas the Federal Reserve places a 24% weight on housing expenses. That divergence turns a 25% increase in housing costs–with all other prices and consumption patterns held constant–into a 4.25% overall inflation in the Eurozone but a 6% inflation in the U.S.
While policymakers are aware of those data limitations and we have standardized statistical ways to adjust for quality improvements, these problems can still cause headaches. One illustrative example is the impact of iPhone prices on Sweden’s price index; Martin Enlund, FX strategist at Nordea, estimates that the quality adjustment of iPhones alone reduced the reported price increase by 0.1 percentage points every year for the last 5 years.
That minor detail has some implication for our modern world, considering that the Riksbank’s interest rate decisions have turned on such small margins before. Looking at these differences in consumption bundles and quality adjustments over longer historical periods, they quickly become astronomical. In a famous paper, Nobel Laureate William Nordhaus surveyed “lumens”–a unit for light–emitted by various sources throughout the centuries. Nordhaus estimated the price of light, the essential service its originators provide us with, to have fallen by 99.97% between 1800 and 1992.
Over decades or centuries, even small differences can result in very large adjustments when we evaluate past incomes. For instance, how much better is a computer as a calculating tool than an abacus? Is a keyboard and word processor ten, fifty or a hundred times better than quills, ink, and bulky, slowly decaying paper?
A recent study by Vincent Geloso and Peter Lindert makes a big deal out of consumption bundles. By disaggregating purchases by working classes and upper classes, they make a revolutionary discovery: beginning earlier than we used to believe, the poor’s standards of living improved faster than those of the rich. Contrary to the tired claim that capitalism involves the rich getting richer while the poor get poorer, it seems that during the 19th century the opposite was true.
The authors reach this conclusion by using different consumption bundles for two different income segments. People’s standards of living depend on what they themselves consume, not on what they could buy if they had the rich’s consumption patterns:
“[T]he contrasts that matter are contrasts in individuals’ abilities to buy what they care to buy, or need to buy, and not the (nominal) inequality in their ability to buy the same common bundle as some other class could buy.”
The components that drove this extraordinary reduction in cost of living, argue Geloso and Lindert, were falling prices of grain-based foods and a rise in the relative price of services that the poorer classes supplied (mostly wage rates for common labor).
The American rise in inequality over the nineteenth century, using both top-1% / bottom-99% and top-10% / bottom-40% metrics, is much less pronounced than previously believed. The authors conclude:
“[T]he ‘nineteenth-century’ period 1815–1914 brought a clearly egalitarian shift in the price structure for all four countries—England, Canada, the USA, and post-1850 Australia. The net change over these 100 years is unmistakable.”
A century before Paul Ehrlich would predict imminent starvation in the entire world (specifically in what he thought was a remarkably backwards India), the world surplus of grains had enriched the poor–even in the “dark Satanic mills” of Britain. The lower relative price of grains mitigated and partly reversed the economic inequality we tend to associate with the nineteenth century.
The exact bundles used to measure consumption matter greatly for understanding prosperity, today as well as in the past.
“The trend of increasing service costs defined many of our economic debates for a decade. There was just one small problem — by the time we started talking about how to address this trend, the trend had changed…
Until around 1990, health spending rapidly ate up a bigger and bigger portion of our national income. Then the increase slowed down, but it did go up some more until around 2009. But after that, it leveled off; in 2024, Americans didn’t spend a greater percent of their income on health care than they did in 2009…
Higher education has been getting more affordable for years, and the decrease in affordability in the late 2000s and 2010s was significantly overstated. The popular narrative that college is getting less and less affordable is wrong…
These changing trends don’t mean that services are cheap and we can stop thinking about service costs. First of all, there are still some services that are getting less affordable over time — most notably, child care. Second, the recent mild increases in affordability for health care and higher education haven’t erased the big cost increases that happened in the 1980s, 1990s, and early 2000s; Americans still pay a lot more for these things than Europeans or Asians do, relative to their incomes. So there’s still probably scope to bring down the costs of health care and college.
But with all that said, the change in the trends in service costs and service productivity mean that our debates about these topics need to change.”
Time Pricing Mark Perry’s Latest “Chart of the Century”
Always compare prices to hourly wages to understand the true change in living standards.
Gale L. Pooley —
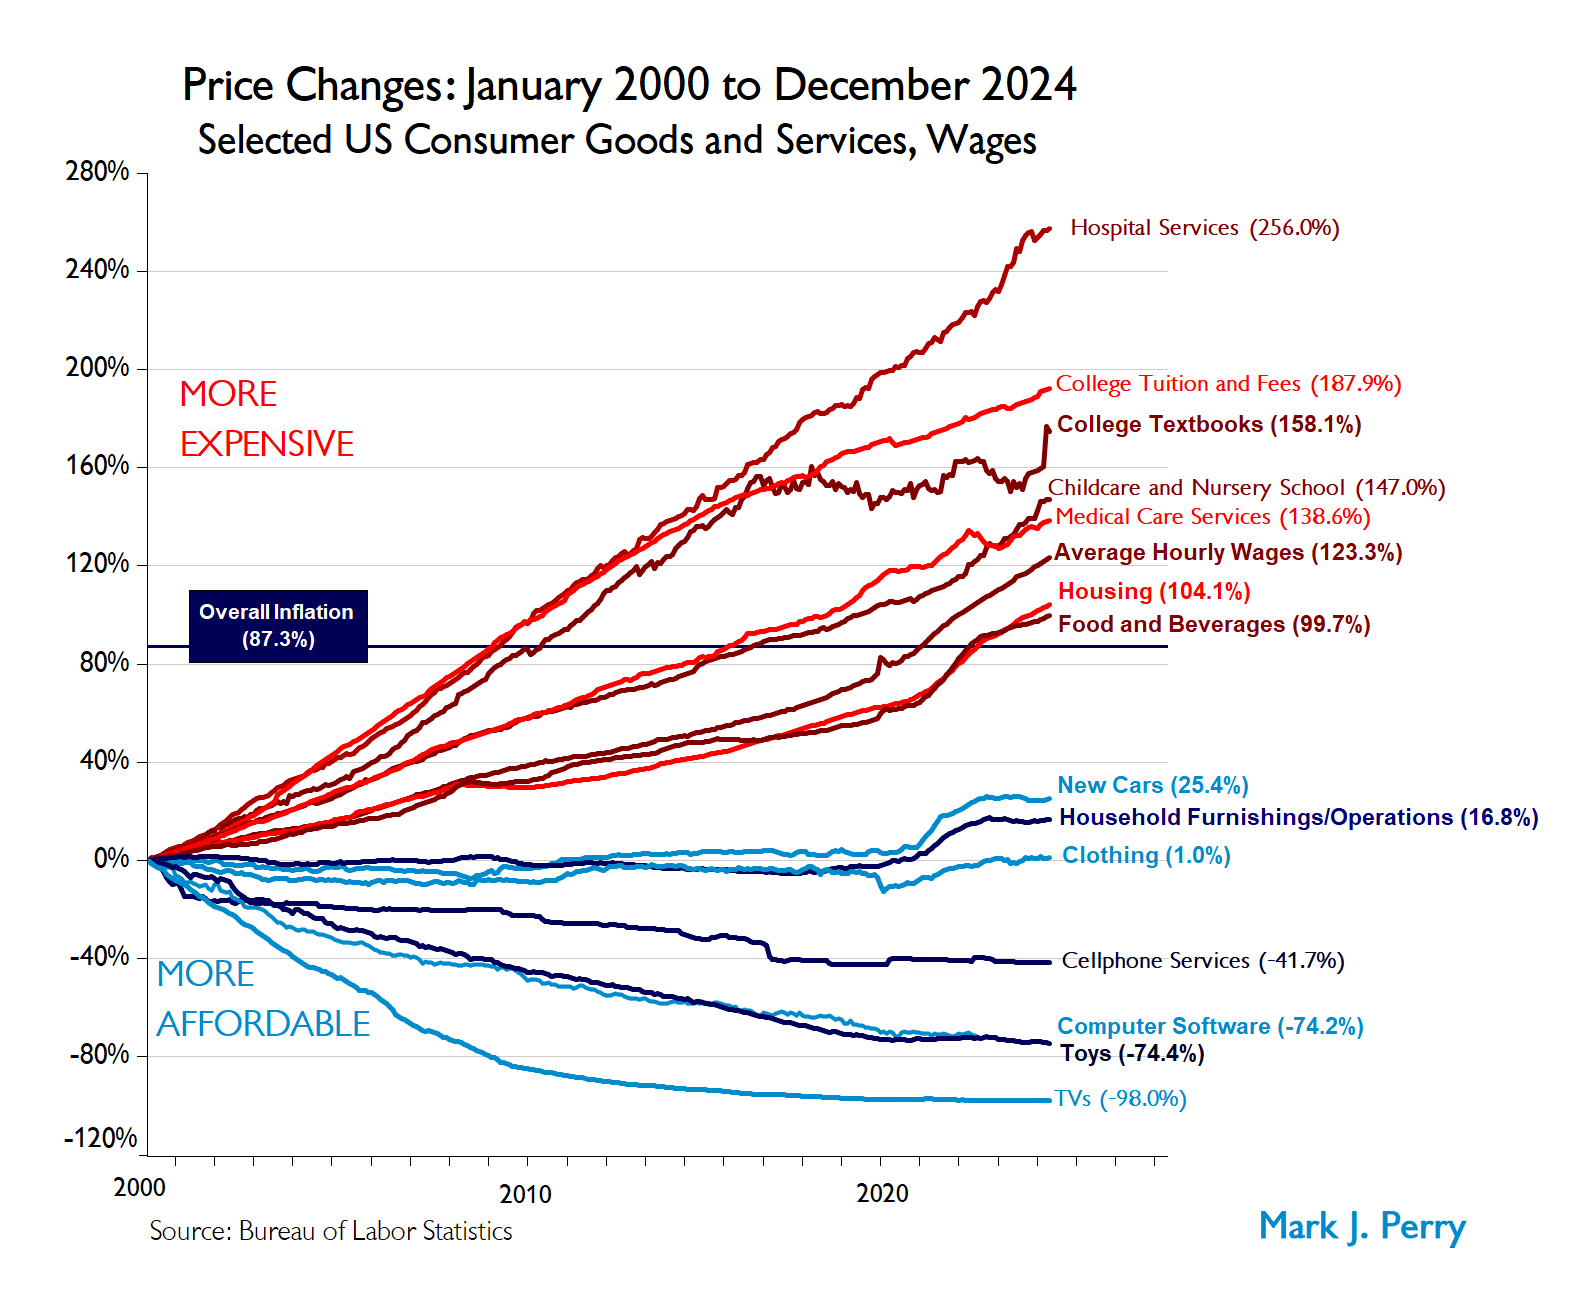
Professor Mark Perry recently posted his updated “Chart of the Century,” featuring price and wage data from the Bureau of Labor Statistics (BLS). The chart tracks 14 items over the 24 years from January 2000 to December 2024 and includes both the overall inflation rate and changes in average hourly wages.
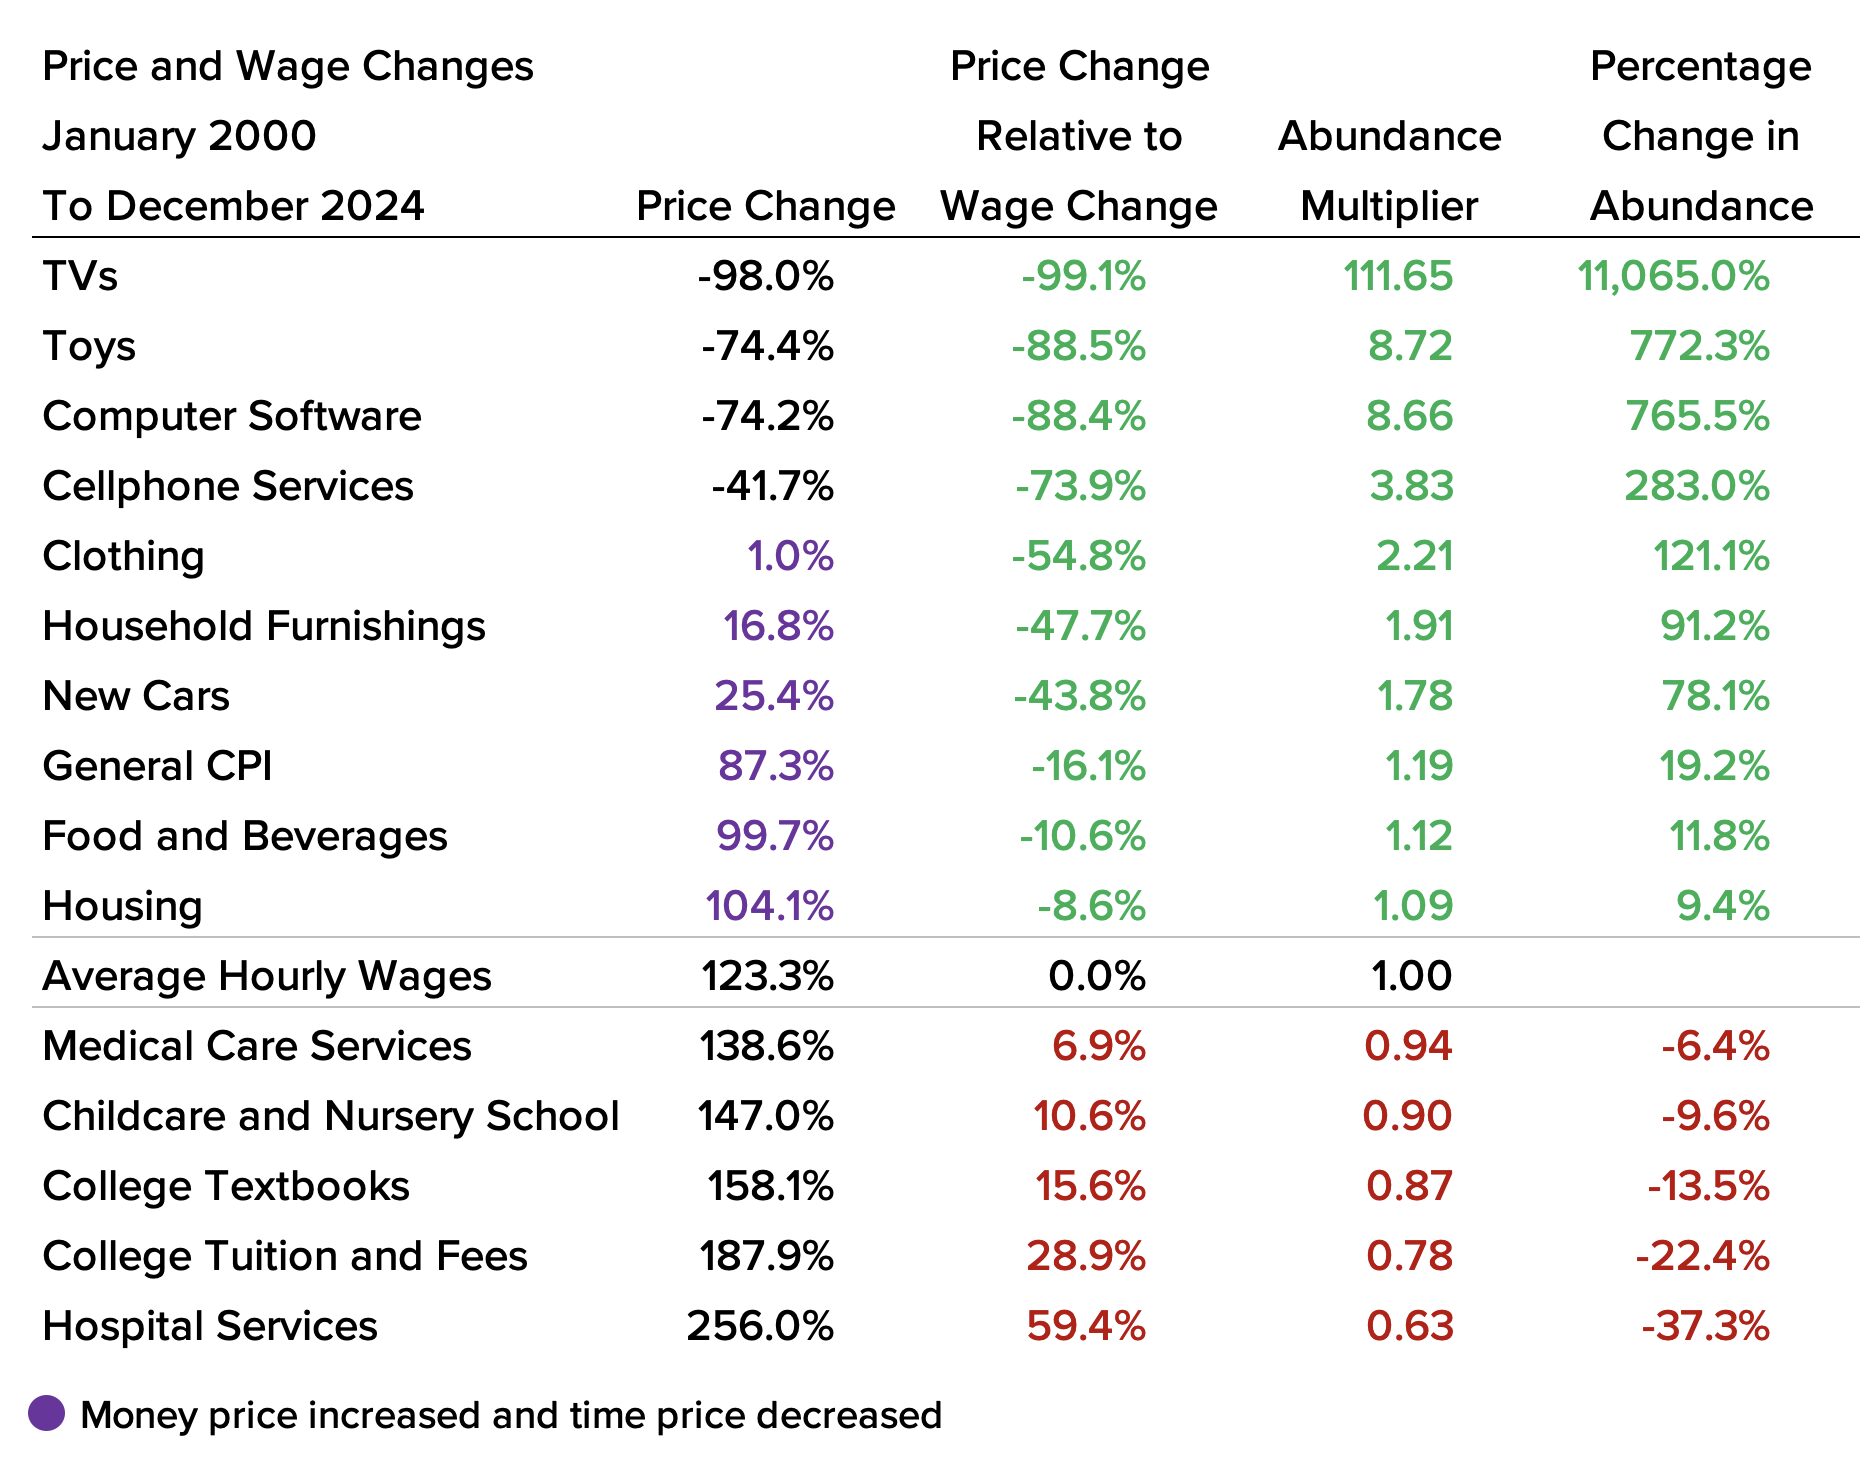
To examine the data from a different perspective, we calculated the change in time prices of these 14 items relative to the change in the average hourly wage. We then determined the abundance multiplier—a value that indicates how many units of an item you could buy in 2024 for the amount of work time it took to buy one unit in 2000. If there were no change, the abundance multiplier would equal one. A value below one indicates decreasing abundance, while a value above one reflects increasing abundance. We also calculated the percentage change in abundance for each item.
This analysis illustrates that things can become more expensive in dollar terms while simultaneously becoming more affordable in time prices. For instance, while the general Consumer Price Index (CPI) rose by 87.3 percent, average hourly wages increased by 123.3 percent. As a result, time prices fell by 16.1 percent. For the time it took to purchase one CPI basket in January 2000, a consumer could buy 1.192 baskets in December 2024—an abundance increase of 19.2 percent.
Notably, categories such as housing, food and beverages, new cars, household furnishings, and clothing all increased in money prices. However, after adjusting for rising wages, they became more affordable in time-price terms. Although 10 of the 14 items rose in nominal prices over the 24 years, only five had a higher time price when accounting for the 123.3 percent increase in hourly wages.
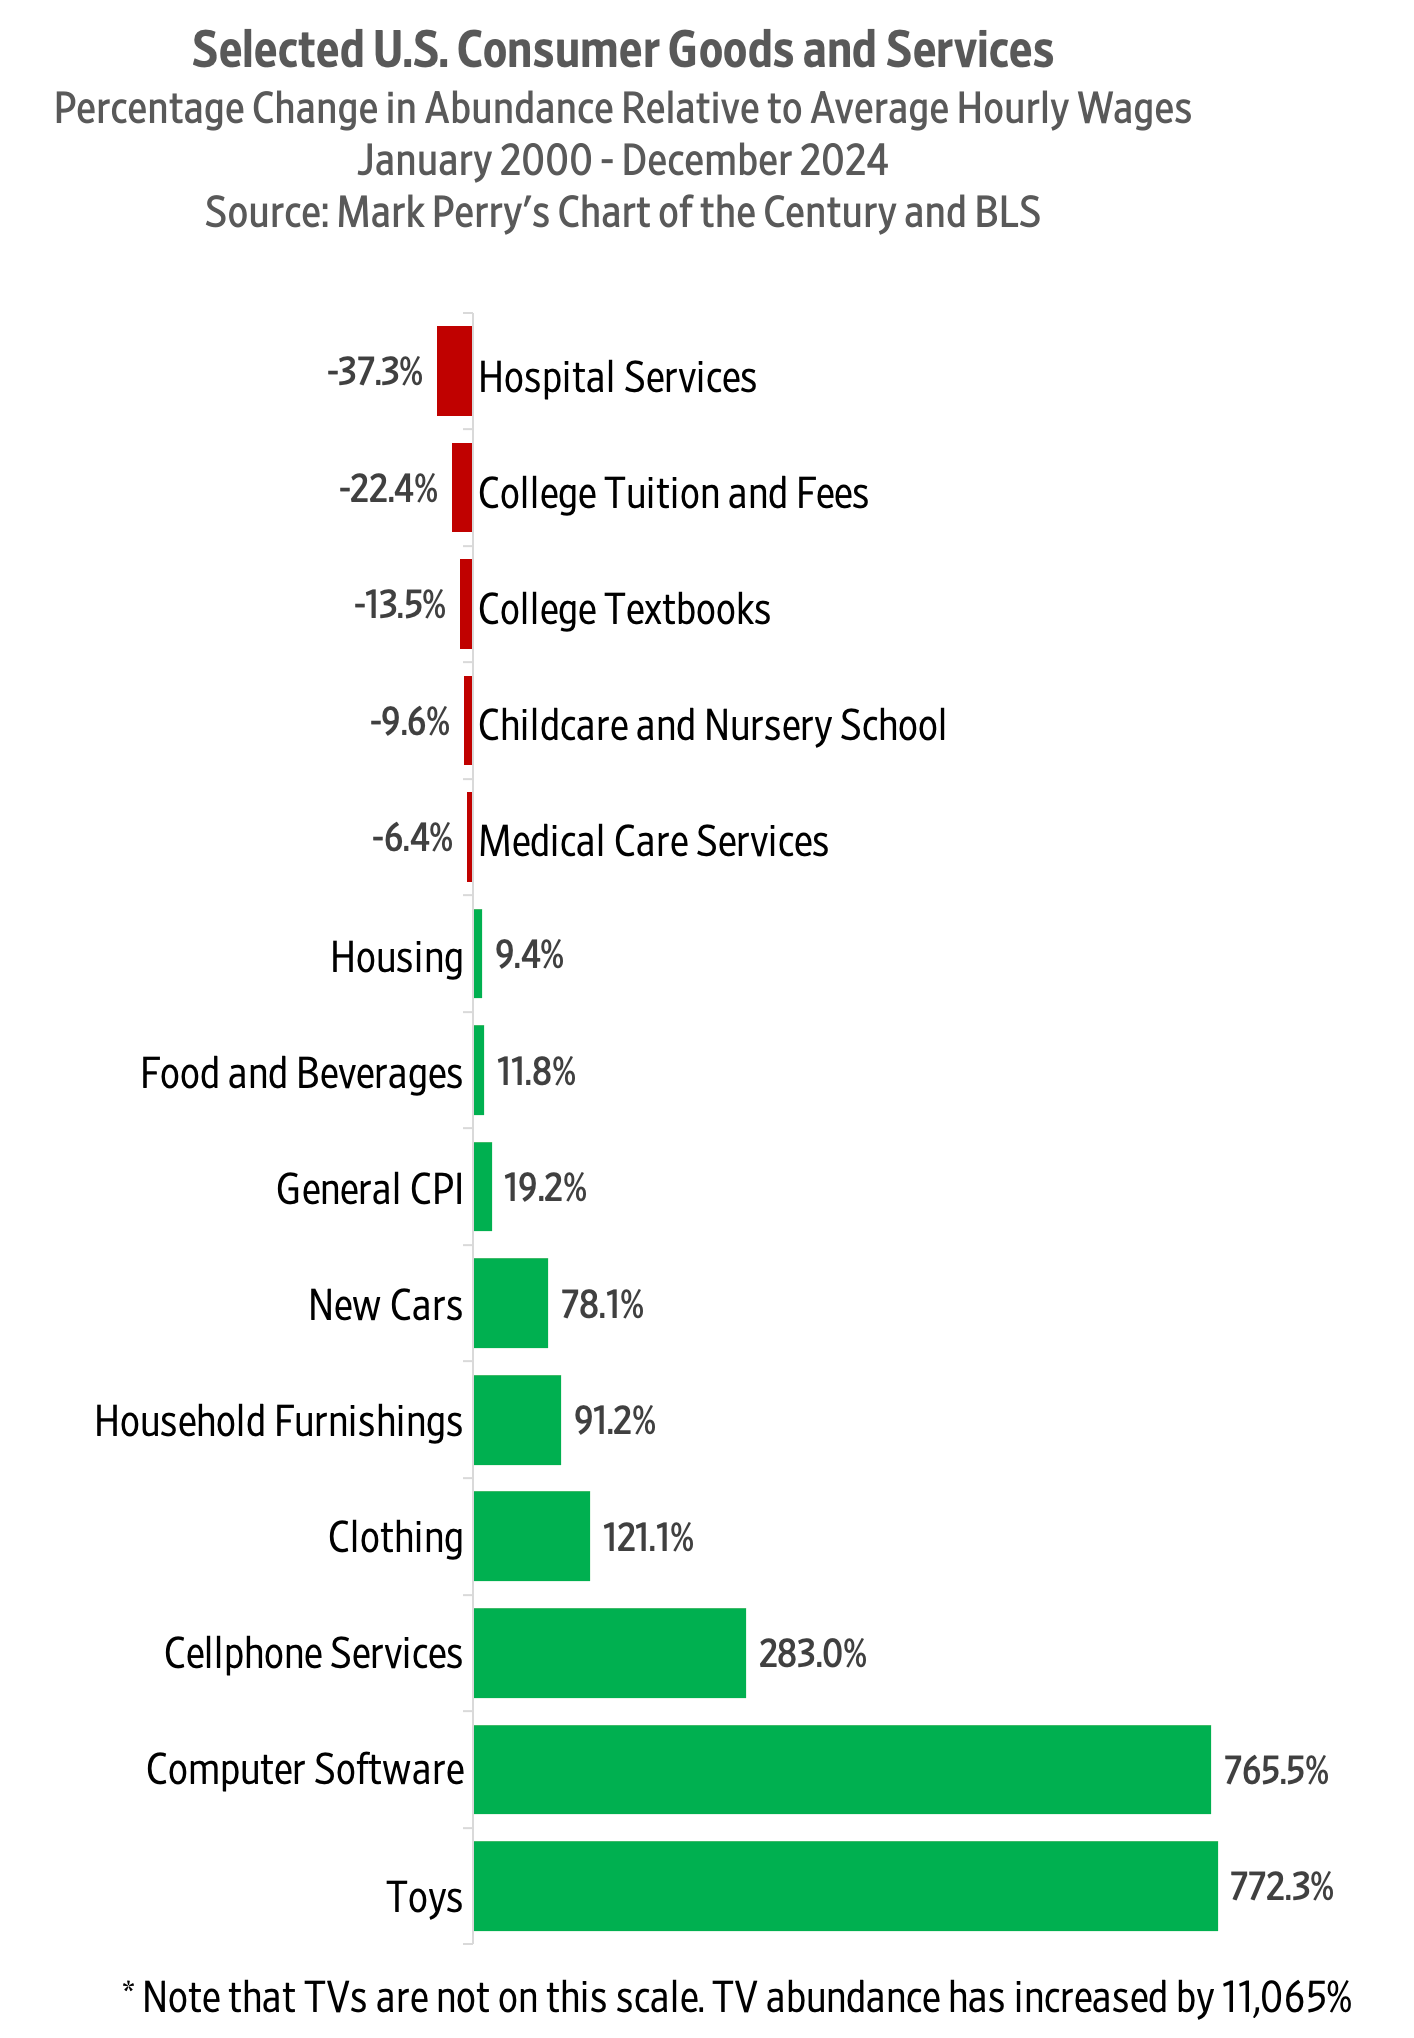
We also created a chart showing the percentage change in abundance for the general CPI and each of the 14 tracked items:
Find more of Gale’s work at his Substack, Gale Winds.
We’re All Billionaires Now (Thanks to New Knowledge)
We may not have a billion dollars in the bank, but we enjoy the benefits of many billions of dollars invested on our behalf.
Gale L. Pooley —
Summary: Modern society enjoys immense wealth through access to products created with high fixed costs but low marginal costs, thanks to mass markets. By leveraging technology and innovation, products from smartphones to streaming music and affordable medicine provide people with benefits once unimaginable. This abundance illustrates capitalism’s ability to generate shared prosperity, contrary to the views of critics who focus solely on the relative distribution of wealth.
Sen. Bernie Sanders (I-VT) has tweeted “There should be no billionaires.” Compared to 100 years ago, the United States is a country where everyone is a billionaire. We may not have a billion dollars in the bank, but we enjoy the benefits of many billions of dollars invested on our behalf in the products and services we use every day. Let me explain.
Fixed costs and marginal costs. In economics, we consider the cost to create a new product and then the cost to manufacture each additional unit. Many products have high fixed costs but low per unit costs when manufactured at scale. This per unit cost is also called marginal cost. The marginal costs on some products can reach zero.
More people mean we are all richer. We can enjoy products with such high fixed costs and low marginal costs because there are so many of us. Creators of these high fixed costs products can recoup these costs from millions, if not billions, of customers. The Scottish economist Adam Smith understood that in 1776. If you want to get rich, have lots of potential customers. Large markets also allow people to develop their skills and specialize in such things as drug and software development. The bigger the population and the more we specialize, the more variety and lower costs we enjoy in the marketplace.
Here are five examples:
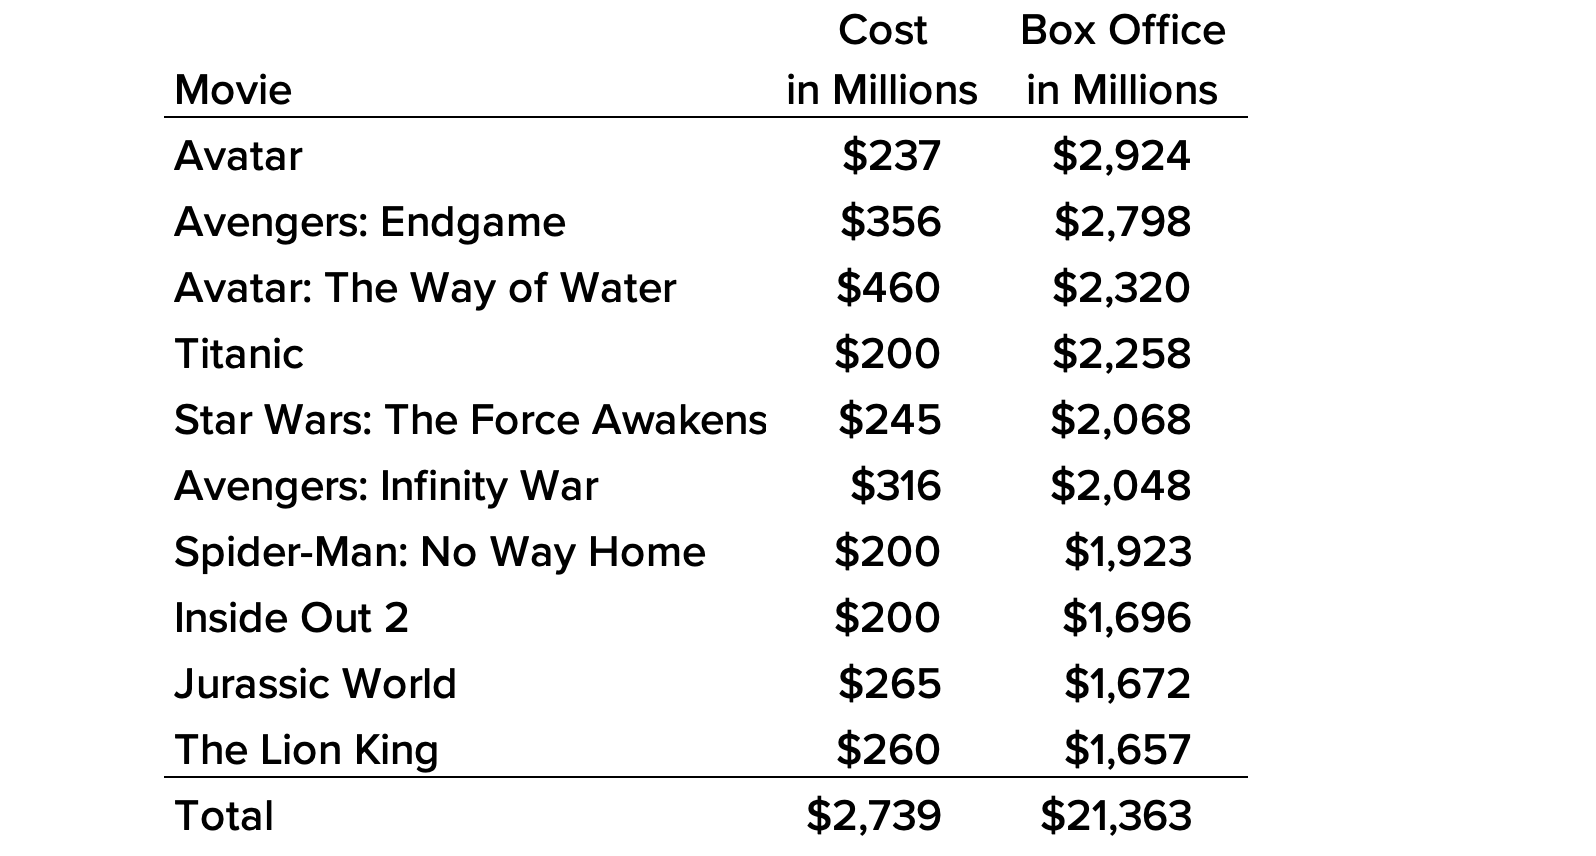
Movie billionaires. The top 10 highest-grossing films cost a total of $2.8 billion to create. You can now stream those movies at home on your $250, 55-inch large-screen high-definition TV along with 1,900 other movies for around $9.99 a month on Disney+. Unskilled workers earn around $17.17 an hour today, so it takes around 14.5 hours to buy the TV and 35 minutes of work each month to enjoy this multibillion-dollar benefit.
iPhone billionaires. It’s estimated that Apple spent $150 million over three years to develop the first iPhone, which was released in 2007. It sold for $499. How could it be sold so cheap if it cost so much? According to CNBC, Apple has sold over 2.3 billion iPhones and has over 1.5 billion active users. That’s how.
In 2009, Apple spent $1.33 billion on research and development. This year, it will have risen to $32 billion. The company has spent $208 billion on developing new products over the past 16 years. About half of Apple’s revenue comes from iPhone sales. Assuming half of its research and development investment has gone into the iPhone, we are enjoying a product that costs over $100 billion for about $30 a month, or around an hour and 45 minutes of work for a typical unskilled worker.
Note: In 2009, Amazon spent $1.24 billion on research and development, similar to Apple. This year, it expects to spend over $85 billion. In the past 16 years, Amazon has spent $485 billion.
Medicine billionaires. The cost to develop a new drug is estimated to range from less than $1 billion to more than $2 billion. The U.S. Congressional Budget Office notes, “Those estimates include the costs of both laboratory research and clinical trials of successful new drugs as well as expenditures on drugs that do not make it past the laboratory-development stage, that enter clinical trials but fail in those trials or are withdrawn by the drugmaker for business reasons, or that are not approved by the FDA.” Once a drug is approved, the marginal cost can be very low, maybe under a dollar.
If it costs $1 billion to develop a new drug, but each new unit of the pill only costs a dollar, how much should you charge the customer for it? The answer depends on the size of the market. If the market is 1,000 people, your costs will be $1 billion plus $1,000. You would have to sell each pill for $1 million plus $1 to break even. If your market was a million people, the breakeven price would drop to $1,001. If your market was a billion potential customers, the price per pill drops to $2.00. This is why new drugs are typically developed for widespread medical conditions. The fixed costs must be spread across a sufficiently extensive market. This is amazing when you think about it. You get a pill that required $1 billion to develop for $2.00 if a billion other people have the same medical problem.
Book billionaires. The Harry Ransom Center estimates that before the invention of the printing press, the total number of books in Europe was around 30,000. The United Nations Educational, Scientific and Cultural Organization estimates there are roughly 158,464,880 unique books in the world as of 2023.
When Gutenberg innovated printing in 1440, an average book cost around 135 days of labor, ranging from 15 days for a short book to 256 days for a major work. If workers put in eight hours a day, they’d have to work 1,080 hours to afford an average book. Today, blue-collar compensation (wages and benefits) is around $37 an hour. If there had been no printing innovation, it would cost about $40,000 to buy a book today.
Google has become the new Gutenberg. It has a library of more than 10 million free books available for users to read and download. Assuming the average book is around 250 pages and a half inch thick, you would need a bookshelf around 80 miles long to hold this library.
Before Gutenberg and his press, Google and the internet, Amazon and its digital tablet, and the manufacture of computer memory chips, it would have cost $400 billion to have a library of 10 million volumes. It would have taken 5.4 million people working full time for a year to create this library in 1439.
Today, you can have this library for around $43. That’s $35 for the tablet and $8 for the 2 TB memory stick. Another valuable feature we enjoy today is being able to search for a word or phrase in any of these books.
Music billionaires. Thomas Edison developed the original phonograph record in 1877. Suddenly people did not have to be present at a live performance to hear music. In 1949, RCA Victor became the first label to roll out 45 RPM vinyl records, and by the 1950s, the price was around 65 cents each. Unskilled workers at the time were earning around 97 cents an hour. This put the time price of a song at 40 minutes.
Steve Jobs introduced the iTunes Store on April 28, 2003, and sold songs for 99 cents. By this time, unskilled wages had increased to $9.25 an hour. The time price of a song had dropped 84 percent to 6.42 minutes. Listeners in 2003 got six songs for the price of one in 1955.
Apple Music was launched on June 30, 2015. Today, a student can access 90 million songs for $5.99 a month. Soundcloud is another popular music streaming service with over 320 million songs priced at $4.99 a month, or 18 minutes of time for an unskilled worker.
In 1955, the time to earn the money for an unskilled worker to buy the Soundcloud catalog of 320 million songs on 45 RPM records would have taken 106,666,667 hours. At today’s rate of $17.17 an hour, it would have cost $1,831,466,666.
Capitalist billionaires. Under capitalism, the only way wealth can grow is if entrepreneurs create it in the form of new products and services. Becoming a billionaire is a by-product of how successful a person is at creating and producing. When someone creates a product based on knowledge, it is non-rivalrous. (Paul Romer won a Nobel prize economics in part for explaining this truth.) Non-rivalry means we can all use a product at the same time. It’s as if we all own the product. Knowledge products make us all billionaires.
Bernie Sanders’s does not seem to understand or appreciate these economic truths. He wants to expropriate capital from Elon Musk and other innovators and give the money to his fellow politicians and bureaucrats to enrich their friends and supporters. Once this capital is seized, however, entrepreneurs will be much less motivated to create more. Ask all the entrepreneurs who lived in the former Soviet Union, and those in China under Mao Zedong, how 100 percent taxation disincentivized them from creating and taking risks.
This article was published at Gale Winds on 11/7/2024.
Drone Deliveries, Slow to Take Flight, Come to Silicon Valley
“The hype around drones may finally be starting to deliver.
Drone deliveries, first touted by Amazon more than a decade ago, are slowly taking off in some parts of the U.S. On Thursday, Matternet, a drone delivery startup, launched its service to Silicon Valley…
The announcement adds to signs of growth for drone delivery. In Fort Worth, Texas, which recently became the first major city in the United States to offer commercial drone deliveries, they’re being used to deliver groceries from WalMart.
In College Station, Texas, Amazon’s drone delivery service has become common enough for residents to see the service as a noisy nuisance. And, with recent FAA approval, the company seems set to expand drone delivery operations across the city and beyond.
Experts say many of the obstacles to drone delivery, most notably the technology and regulations, have been hurdled.”