fbpx
01 / 05
Malthus Had It Backwards

Blog Post | Health & Demographics

Malthus Had It Backwards

Resources grow much faster than population if people are free to innovate.

Summary: Thomas Malthus predicted in 1798 that population growth would outstrip food production and lead to collapse. However, he did not check his model against reality. Using data from England, this article shows that food abundance actually grew faster than the population during the 18th century.


A version of this article originally appeared in Gale Pooley’s Gale Winds Substack.

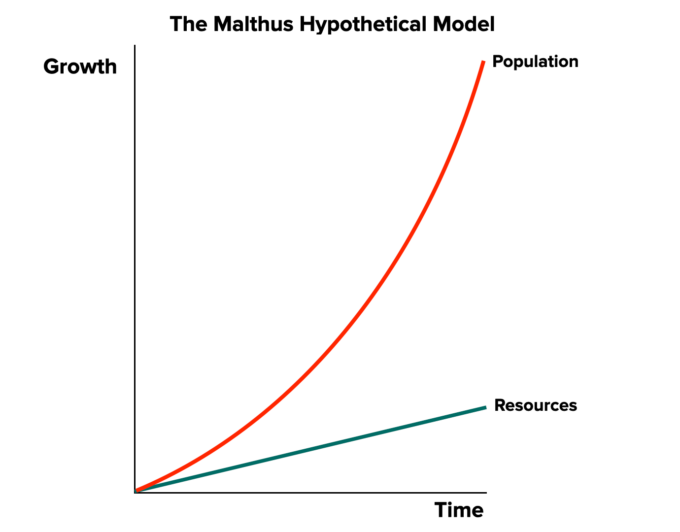
Using an untested hypothetical model, Thomas Malthus told the world in his 1798 An Essay on the Principle of Population to expect collapse. He cloaked his model in mathematics instead of empirical evidence. He noted, “Population, when unchecked, increases in a geometrical ratio. Subsistence increases only in an arithmetical ratio.” See Figure 1. To ensure that he had the illusion of math on his side, he condescendingly added, “A slight acquaintance with numbers will show the immensity of the first power in comparison of the second.” If Malthus had checked the price of bread over the previous century, he would have realized that his model was flawed.

The figure illustrates the Malthusian model, where population grows exponentially while resources increase at a linear rate.

Between 1700 and 1798, the population of England increased from 5.2 million to 8.44 million, or 62.3 percent. Over the same period, nominal gross domestic product (GDP) per person per year increased from £12.37 to £23.97, or 93.8 percent, according to Appendix A in The Story of Bread by Ronald Sheppard and Edward Newton. The nominal price of a four-pound loaf of bread increased from 5.2p to 7.4p, or 42.3 percent. The ratio of bread to GDP per capita declined from 0.42 in 1700 to 0.31 in 1798 or 26.6 percent. See the Table below.

The figure shows the growing abundance of bread in England between 1700 and 1798.

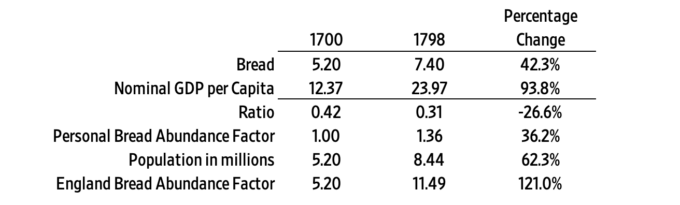
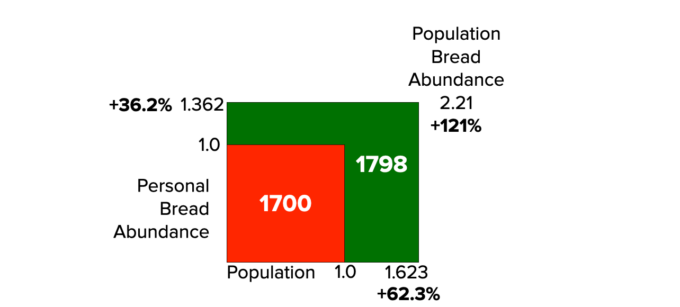
This suggests that for the time required to earn one loaf of bread in 1700, an Englishman would get 1.36 loaves in 1798. Bread had become 36.2 percent more abundant at the personal level (relevant equation is [(0.4204 ÷ 0.3087) – 1] = 0.362 = 36.2%).

Bread abundance for the whole country is equal to personal bread abundance multiplied by population. As the population of England increased by 62.3 percent, bread became 36.2 percent more abundant, suggesting bread had become 121 percent more abundant for the country (relevant equation is [(1.362 x 1.623) – 1] = 1.21 = 121%). For every 1 percent increase in population, bread abundance was increasing 1.94 percent. See Figure 2.

The figure shows that the abundance of bread grew faster than the population between 1700 and 1798.

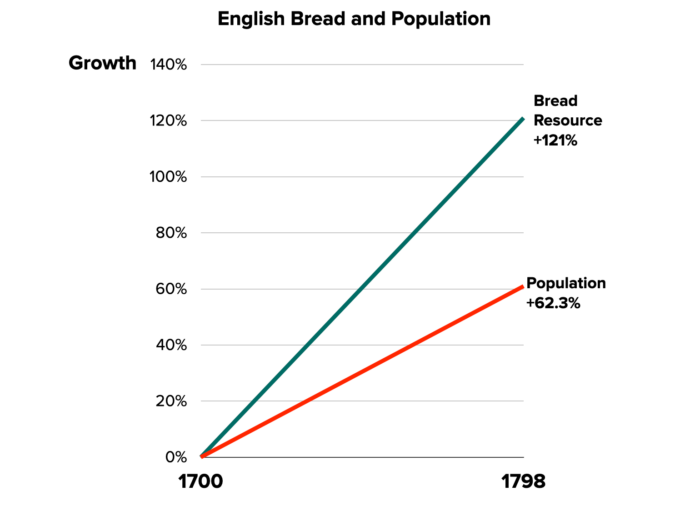
As shown in Figure 3, the size of the English bread resource in 1798 was much higher than in 1700.

The figure shows that personal bread abundance in England was greater 1798 than 1700.

England began to enjoy more and more freedom to innovate in the 1700s. This innovation shows up in bread abundance. Humans are supremely adaptable and clever. If they have freedom, they will always create more resources for themselves and everyone else.

Lesson learned: Test your hypothetical models against reality. Maybe you’ll be much less frightened of the future.

Cornell SC Johnson College of Business | Food Consumption

GLP-1 Adoption Is Changing Consumer Food Demand

“We examine how consumers modify their food demand after adopting appetite-suppressing GLP-1 receptor agonists, such as Ozempic and Wegovy. Using survey responses on medication adoption and timing linked to transaction data from a representative U.S. household panel, we document the prevalence, motivations, and demographic patterns of GLP-1 adoption. Households with at least one GLP-1 user reduce grocery spending by 5.5% within six months of adoption, with higher-income households reducing spending by 8.6%. These reductions are driven by large decreases in purchases of calorie-dense, processed items, including an 11% decline in savory snacks. While most food categories see spending declines, spending on nutrient-dense options, such as yogurt and fresh produce, shows directionally positive but statistically insignificant changes. We also find an 8.6% decline in spending at fast-food chains, coffee shops, and limited-service restaurants.”

From Cornell SC Johnson College of Business.

Axios | Nutrition

Fast Food Consumption Decreased, CDC Data Shows

“Kids ages 2 through 19 consumed an average of 11.4% of their daily calories from fast food on a given day between August 2021 and August 2023, according to data from the CDC’s National Health and Nutrition Examination Survey.

  • That’s down from an average of nearly 14% in 2013 and 2014, per CDC data.
  • For adults age 20 and up, average calories from fast food fell from about 14% in 2013 and 2014 to 11.7% during mid-2021 to mid-2023.
  • Food reported as “restaurant fast food/pizza” on survey responses was considered fast food for these analyses, CDC’s data brief said.

Zoom out: About 30% of youth ages 2 through 19 ate fast food on any given day between August 2021 and 2023. That figure exceeded 36% between 2015 and 2018, CDC found.”

From Axios.

Asia News Network | Malnutrition

Stunting Declines in Indonesia

“The Health Ministry has reported a decline in the national stunting rate among children, from 21.5 percent in 2023 to 19.8 percent last year…

Although the 19.8 percent prevalence is 0.3 percentage points lower than the 2024 target set by the National Development Planning Agency (Bappenas), it still represents an estimated 4.48 million newborns and infants affected by stunting, including around 925,000 new cases last year.”

From Asia News Network.

Our World in Data | Malnutrition

Famines Kill Far Fewer People Today than They Did in the Past

“Famines are still a major global problem. From 2020 to 2023 alone, they caused over a million deaths.

Yet the long-term trend shows significant progress. In the late 1800s and the first half of the 1900s, it was common for famines to kill over 10 million people per decade. This was true as recently as the 1960s, when China’s Great Leap Forward became the deadliest famine in history.

But as you can see in the chart, that number has dropped sharply, to about one to two million per decade.

This improvement is even more striking given that the world’s population has grown substantially.”

From Our World in Data.