Summary: Tom Standage’s book explores how history’s major events and periods are reflected in the history of food, from the agricultural revolution to the spice trade of globalization. The book reveals the harsh realities of pre-industrial food production and the deadly consequences of misguided beliefs about food. It recounts how past societies waged wars and committed atrocities in the name of different foods, and how food has had profound historical influence over major events.
Tom Standage’s An Edible History of Humanity traces how food impacted major world events in different eras, from the agricultural revolution to the spice trade’s role in early globalization. The book covers the industrial and post-industrial eras with harrowing descriptions of the horrific famines wrought by communism’s price controls and collectivization of agriculture. Its insights into the pre-industrial age are also noteworthy.
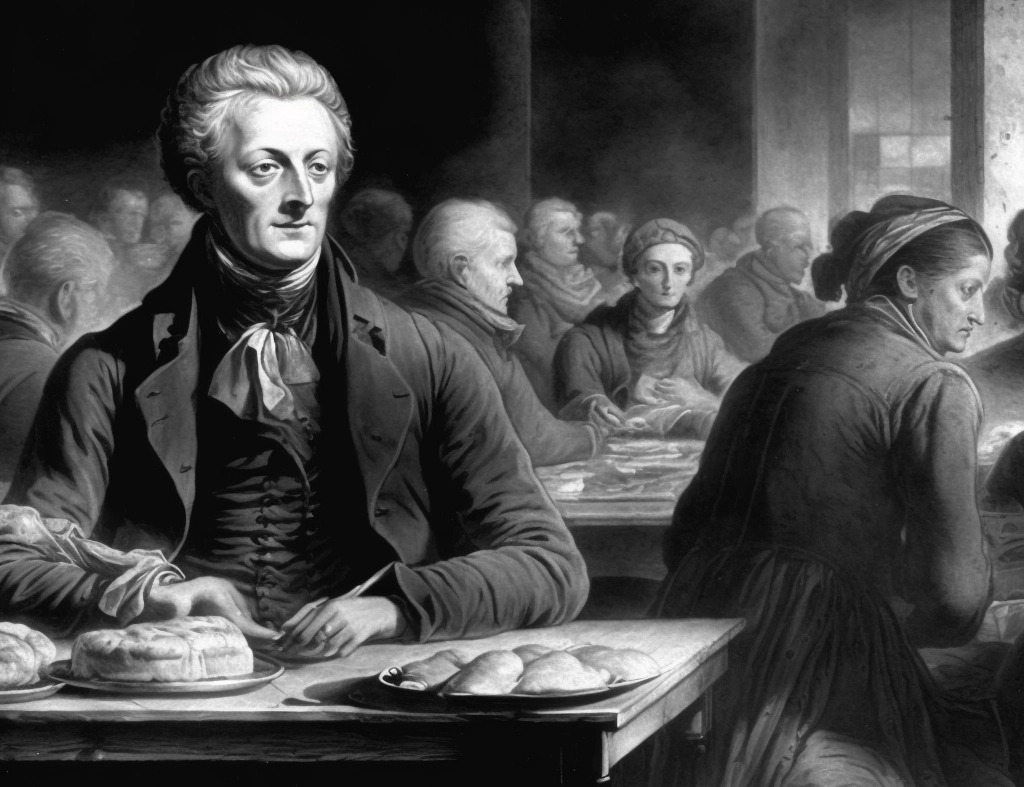
Standage reminds the reader that food is a product of innovation and progress, saying that “a cultivated field of maize, or any other crop, is as man-made as a microchip” and that the barely edible wild ancestors of today’s foods were nothing like their modern counterparts. The book also reveals that many foods of the past looked less appetizing and tasted worse. Consider the carrot. “Carrots were originally white and purple, and the sweeter orange variety was created by Dutch horticulturalists in the sixteenth century as a tribute to William I, Prince of Orange.” And that is not the only royal anecdote in the book. In the late 17th century, pineapples were known as “the fruit of kings” in Europe because they were so rare; King Charles II of England even posed for a painting with a pineapple and held a feast in which he “cut the fruit up himself and offered pieces of it from his own plate. This might sound like a gesture of humility, but was really a demonstration of his power: only a king could offer his guests pineapple.”
An Edible History also reminds the reader that poverty was the default throughout much of history, quoting a Mesopotamian proverb from around 2,000 BC that notes, “Wealth is hard to come by, but poverty is always at hand.” In ancient Uruk, according to Standage, “80 percent of the population were farmers.” In nonindustrialized corners of the modern world, not much has changed on that front. “In poor countries such as Rwanda, the proportion of the population involved in agriculture is still more than 80 percent—as it was in Uruk 5,500 years ago.”
The vast majority of people in pre-industrial societies the world over labored on farms, and the backbreaking work took a heavy toll on their bodies. Archeology reveals that historically in agricultural societies, “female skeletons often display evidence of arthritic joints and deformities of the toes, knees, and lower back, all of which are associated with the daily use of a saddle kern to grind grain.”
The book describes how difficult life was for agricultural workers, once the greater part of humanity. Many people viewed the ceaseless agricultural labor that defined their lives as a form of divine punishment: Standage quotes a verse in the biblical Book of Genesis that reads, “Cursed is the ground because of you; through painful toil you will eat of it all the days of your life.” In some cultures, the painful struggle to produce food from the earth was likened to fighting a war. “For the Incas, agriculture was closely linked to warfare: The earth was defeated, as if in battle, by the plow. So the harvest ceremony was carried out by young noblemen as part of their initiation as warriors, and they sang a haylli [a military victory chant] as they harvested the maize to celebrate their victory over the earth.”
Sometimes, local beliefs connected to food could prove lethal. The Aztecs thought the “Earth Mother was nourished by human blood . . . and the crops would only grow if she was given enough of it” in the form of innumerable human sacrifices. “Sacrificial victims were referred to as ‘tortillas for the gods.’” The Incas also practiced human sacrifice. “After subjugating a new region, the Incas sacrificed its most beautiful people.”
Other bizarre beliefs related to food are detailed in the book. “Herodotus, the Greek writer of the fifth century B.C. known as the ‘father of history,’ explained that gathering cassia, a form of cinnamon, involved donning a full-body suit made from the hides of oxen, covering everything but the eyes. Only then would the wearer be protected from the ‘winged creatures like bats [which] have to be kept from attacking the men’s eyes when they are cutting the cassia.’” Theophrastus, another ancient Greek philosopher, believed cinnamon “was guarded by deadly snakes” and that “the only safe way to collect it was . . . to leave a third of the harvest behind as a gift to the sun, which would cause the offering to burst into flames.’” The Roman writer Tacitus worried about “spendthrift table luxuries,” such as spices now considered unremarkable. The book examines how the acquisition of what are today ordinary spices that can be purchased for a few dollars at any grocery store once inspired wars, including wars of conquest and destructive battles over trading rights. “After the year 1500 there was no pepper to be had at Calicut that was not dyed red with blood,” the author quotes Voltaire as quipping in 1756.
The book describes how in the quest for spices, often “violence was used arbitrarily and unsparingly.” For example, when the Portuguese explorer Vasco Da Gama arrived in India, he “arbitrarily burned and bombarded towns on the coast in order to force key ports to [trade spices to Portugal rather than rival Muslim merchants] and his men also sank and looted Muslim and local vessels, on one occasion using prisoners for crossbow practice; the hands, noses, and ears of the remaining prisoners were cut off and sent ashore.” This violence was over pepper, something that is now inexpensive and thoroughly unremarkable. The quest to attain nutmeg, meanwhile, led the Dutch East India Company, or Vereenigde Oostindische Compagnie (VOC), to commit human rights abuses in the Banda Islands: “Villages were burned down and the inhabitants were killed, chased off, or sold into slavery. The village chiefs were tortured and then beheaded by the VOC’s samurai mercenaries, brought in from Japan.” Again, that was over nutmeg. As the book notes: “Today most people walk past the spices in the supermarket, arrayed on shelves in small glass bottles, without a second thought.” It can be hard to imagine, but people once killed and died to obtain the likes of pepper and nutmeg.
An Edible History’s discussion of the spice trade also makes vivid how poor the state of geographic knowledge was in the past. In the 1420s, Portugal’s Prince Henry the Navigator sought in vain to “make contact with Prestor John, the legendary Christin ruler of a kingdom thought to be somewhere in Africa or the Indies.” In the 1480s, when Christopher Columbus tried to convince the Portuguese crown to fund his voyage, he was turned down in part because his calculations relied on the writings of Marco Polo, and Polo’s “book describing his travels in the East was widely regarded at the time as a work of fiction.” In fact, it wasn’t until the 19th century that scholars began to accept Polo’s travelog as a genuine historical account. When Columbus finally did make his voyage in 1492, he spread further confusion, believing he had visited Asia rather than a continent unknown to Europeans. And that was not all. “He claimed to have found the footprints of griffins.” “In the 1540s [the] conquistador, Gonzalo Pizarro, scoured the Amazon jungle in a doomed search for the legendary city of El Dorado and the ‘país de la canela,’ or cinnamon country. It was not until the seventeenth century that the search for Old World spices in the Americas was finally abandoned.”
The book also details the strange dietary advice of the past, such as dietary guidelines meant to ward off the devastating bubonic plague: “There are accounts of people being sealed into their houses to prevent the plague from spreading, and of people abandoning their families to avoid infection. Medical men proposed all sorts of strange measures that would, they said, minimize the risk of infection, advising fat people not to sit in the sunshine, for example, and issuing a series of baffling dietary pronouncements. Doctors in Paris advised people to avoid vegetables, whether pickled or fresh; to avoid fruit, unless consumed with wine; and to refrain from eating poultry, duck, and meat from young pigs. ‘Olive oil,’ they warned, ‘is fatal.’” What, then, was a person properly worried about the plague to eat? “The French doctors recommended drinking broth seasoned with pepper, ginger, and cloves. The plague was thought to be caused by corrupted air, so people were advised to burn scented woods and sprinkle rosewater in their homes, and other aromatics when going out. . . . This helped to conceal the smell of the dead and dying, as well as supposedly purifying the air. John of Escenden, a fellow at Oxford University, was certain that a combination of powdered cinnamon, aloes, myrrh, saffron, mace, and cloves had enabled him to survive even as those around him succumbed to the plague.”
Superstitions initially prevented Europeans from eating potatoes when that vegetable arrived on their continent: “Potatoes resembled a leper’s gnarled hands, and the idea that they caused leprosy became widespread. According to the second edition of John Gerard’s Herball, published in 1633, ‘the Burgundians are forbidden to make use of these tubers, because they are assured that eating them caused leprosy.’ . . . Potatoes became associated with witchcraft and devil worship.” In fact, even in the 1770s, “potatoes were still widely believed to be poisonous and to cause disease.”