fbpx
01 / 05
How the Market Helped to Make Workplaces Safer

Blog Post | Labor & Employment

How the Market Helped to Make Workplaces Safer

It is in the interest of the employers not to expose their workers to unnecessary risks.

Global and United States work-related death rate declined

The free market, some people allege, is incompatible with workplace safety. Competition drives down profits, the German philosopher Karl Marx asserted, which forces business owners to cut corners and expose their workers to growing risks. Yet, by historical standards, work-related fatalities are at an all-time low. Labor activism and government regulations deserve part of the credit for that happy state of affairs. But, a general improvement in living standards and, consequently, higher expectations on the part of the laborers, also played a part in improving workplace safety. Plainly put, a safer workforce is a more contented workforce. It is in the interest of the employers not to expose their workers to unnecessary risks.

All economic activity involves some degree of physical risk. That has always been the case. Our hunter-gatherer ancestors had to contend with wild animals, poisonous snakes and other vagaries of nature that surely make the modern workplace a much safer alternative. Credible data on work injuries and fatalities during the agrarian era is difficult to come by, because most farm laborers were self-employed. Simply put, no entity, official or otherwise, had an incentive to collect occupational safety statistics. Yet agricultural work must have been quite unappealing, considering that most people preferred factory work over life on the farm.

Even today, notes the U.S. Department of Labor, agriculture “ranks among the most dangerous industries.” In 2011, the “fatality rate for agricultural workers was 7 times higher than the fatality rate for all workers in private industry; agricultural workers had a fatality rate of 24.9 deaths per 100,000, while the fatality rate for all workers was 3.5.” Likewise, the Workplace Safety and Health (WSH) Institute in Singapore found that global fatality rates per 100,000 employees in agriculture ranged from 7.8 deaths in high-income countries to 27.5 deaths in South-East Asia and Western Pacific regions in 2014. Manufacturing deaths ranged from 3.8 in high-income countries to 21.1 in Africa.

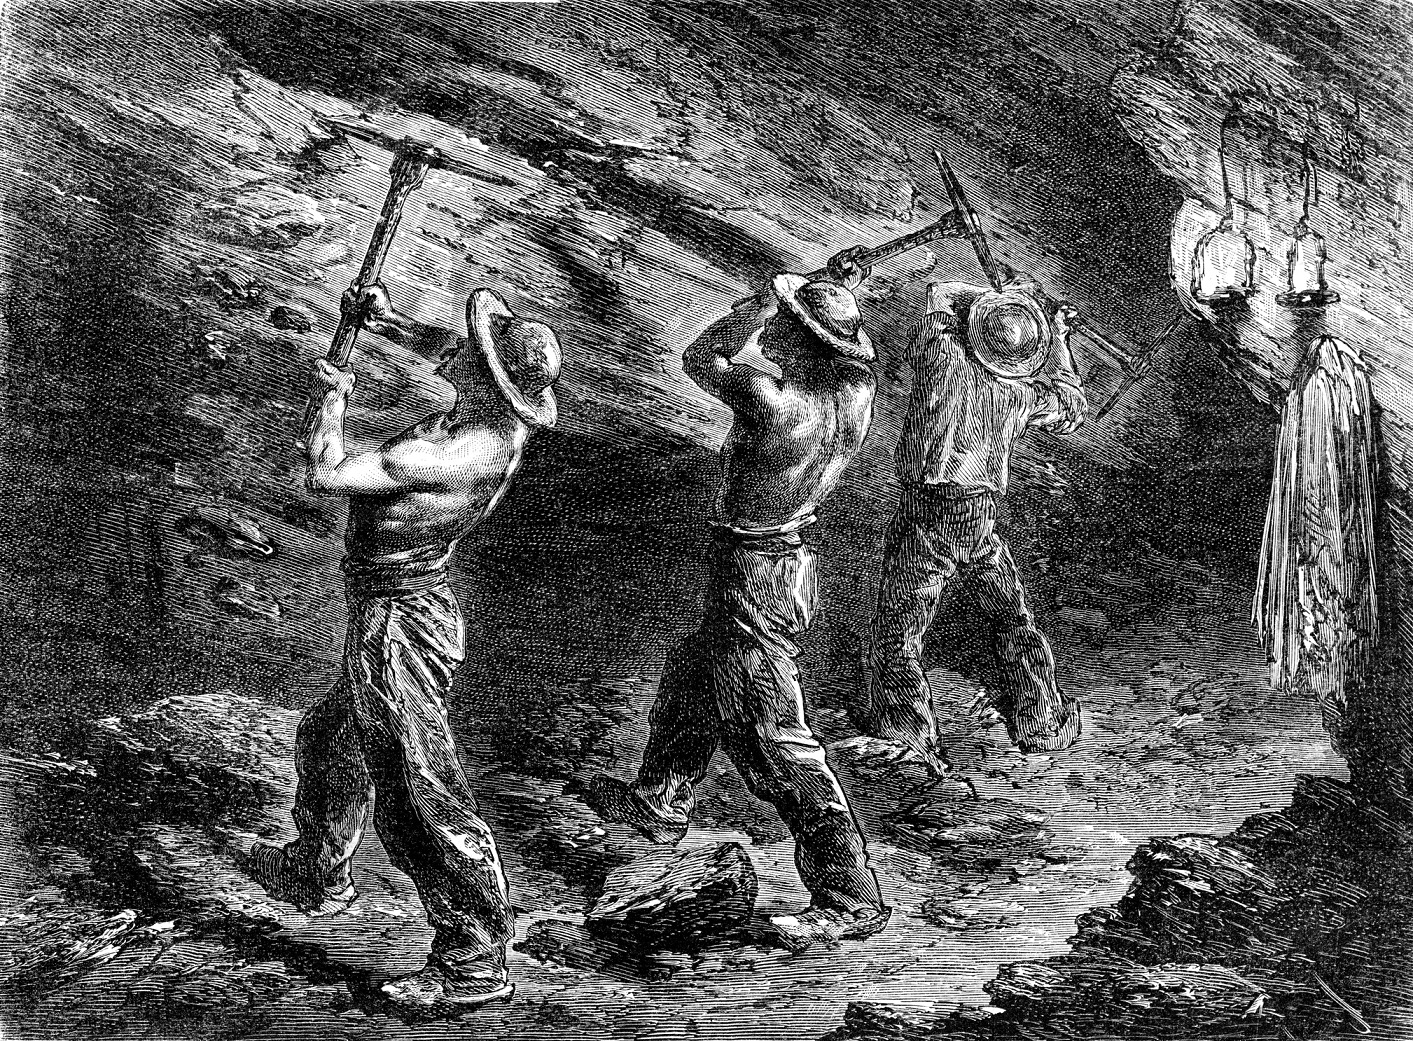
Collection of statistics came about as a result of industrialization and the birth of modern labor relations in the 19th century. Labor unions started to collect workplace safety statistics in order to achieve more advantageous working conditions for their members, while employers kept work safety data, because they were legally liable for injuries in the workplace. By modern standards, it is clear that working conditions in mines and factories during the first 100 years of the Industrial Revolution were appalling. As the then-U.S. President Benjamin Harrison put it in 1892, “American workmen are subjected to peril of life and limb as great as a soldier in time of war.”

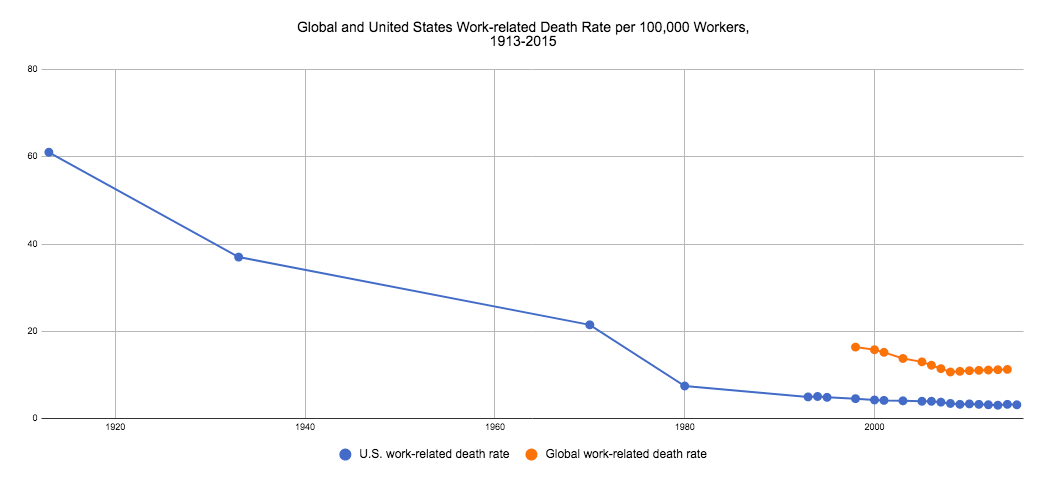
In the United States, estimates Harvard University psychologist Steven Pinker in his 2018 book Enlightenment Now: The Case for Reason, Science, Humanism, and Progress, 61 workers per 100,000 employees died in work-related accidents as late as 1913. That number fell to 3.2 in 2015. That’s a 95 percent reduction in work fatalities over a little more than 100 years. A similarly encouraging trend can be observed globally. According to the WSH Institute estimates, 16.4 workers per 100,000 employees died worldwide in 1998. By 2014 that number fell to 11.3. That’s a 31 percent reduction over a remarkably short period of 16 years. Considered in a slightly different way, workplace fatalities around the world seem to be falling by almost 2 percentage points each year.

What accounts for those improvements? Labor union activism, including strikes and protests, has been traditionally credited with making the workplace safer. But, improving working conditions cannot be divorced from the overall improvement in the standard of living. The massive economic expansion in the second half of the 19th century, in particular, tightened the labor market and workers started to gravitate toward more generous employers. It was only after a certain critical mass of workers achieved more tolerable working conditions that more general workplace regulations became imaginable and, more importantly, affordable.

Thus, at least in the American context, the reduction in workplace fatalities preceded the Wagner Act of 1935, which enabled private sector employees to organize into trade unions, engage in collective bargaining and take collective action. By the time that the U.S. Occupational Safety and Health Administration was created in 1971, worker fatalities were roughly two-thirds lower than what they have been prior to World War I. Thus, as with working hours, government regulations tend to affirm that which is already happening in the labor market place anyway.

Our World in Data | Workforce Hours

Working Hours in Wealthy Countries Declined by Half over Last 150 Years

“The average worker in wealthy countries now works only about half as many hours per year as in the late 19th century.

Based on data from economic historians Michael Huberman and Chris Minns, the average worker used to work between 2,700 and 3,500 hours per year, which is about 50 to 70 hours each week.

Recently, using data from the Penn World Table, workers worked about half that amount, between 1,300 and 1,800 hours a year, or about 25 to 35 hours a week.

This decrease has come from working fewer hours each day, fewer days each week, and fewer weeks each year.”

From Our World in Data.

Blog Post | Human Development

1,000 Bits of Good News You May Have Missed in 2023

A necessary balance to the torrent of negativity.

Reading the news can leave you depressed and misinformed. It’s partisan, shallow, and, above all, hopelessly negative. As Steven Pinker from Harvard University quipped, “The news is a nonrandom sample of the worst events happening on the planet on a given day.”

So, why does Human Progress feature so many news items? And why did I compile them in this giant list? Here are a few reasons:

  • Negative headlines get more clicks. Promoting positive stories provides a necessary balance to the torrent of negativity.
  • Statistics are vital to a proper understanding of the world, but many find anecdotes more compelling.
  • Many people acknowledge humanity’s progress compared to the past but remain unreasonably pessimistic about the present—not to mention the future. Positive news can help improve their state of mind.
  • We have agency to make the world better. It is appropriate to recognize and be grateful for those who do.

Below is a nonrandom sample (n = ~1000) of positive news we collected this year, separated by topic area. Please scroll, skim, and click. Or—to be even more enlightened—read this blog post and then look through our collection of long-term trends and datasets.

Agriculture

Aquaculture

Farming robots and drones

Food abundance

Genetic modification

Indoor farming

Lab-grown produce

Pollination

Other innovations

Conservation and Biodiversity

Big cats

Birds

Turtles

Whales

Other comebacks

Forests

Reefs

Rivers and lakes

Surveillance and discovery

Rewilding and conservation

De-extinction

Culture and tolerance

Gender equality

General wellbeing

LGBT

Treatment of animals

Energy and natural Resources

Fission

Fusion

Fossil fuels

Other energy

Recycling and resource efficiency

Resource abundance

Environment and pollution

Climate change

Disaster resilience

Air pollution

Water pollution

Growth and development

Education

Economic growth

Housing and urbanization

Labor and employment

Health

Cancer

Disability and assistive technology

Dementia and Alzheimer’s

Diabetes

Heart disease and stroke

Other non-communicable diseases

HIV/AIDS

Malaria

Other communicable diseases

Maternal care

Fertility and birth control

Mental health and addiction

Weight and nutrition

Longevity and mortality 

Surgery and emergency medicine

Measurement and imaging

Health systems

Other innovations

Freedom

    Technology 

    Artificial intelligence

    Communications

    Computing

    Construction and manufacturing

    Drones

    Robotics and automation

    Autonomous vehicles

    Transportation

    Other innovations

    Science

    AI in science

    Biology

    Chemistry and materials

      Physics

      Space

      Violence

      Crime

      War

      Blog Post | Workforce Hours

      The Long Thread of Lessening Labor

      We have more time to do as we wish and fewer needs that force us to do as we must.

      Summary: This article challenges the common perception that human progress has made us work harder and deprived us of leisure. It shows how both market and domestic labor have declined over time, thanks to technological innovations and economic changes. It traces the history of labor alleviation from the Viking era to the present day, and celebrates the benefits of having more time and freedom to pursue our interests.


      People often complain that we are all working too hard and that human progress is pointless if we have to labor and strain to achieve our current lifestyles. They say we would be better off curtailing our desires and returning to some Edenic life with more time for ourselves. The problem is that Edenic life never existed. In fact, over the past millennium, humanity has been working less and less. And a thousand years is probably long enough to make the claim that working less is a trend, not a blip.

      To understand working hours, it is important to recognize two points. First, households (some societies define households as containing only parents and children, while others extend the definition to cousins and nephews and so on) are the central economic units that should be discussed. Second, labor comes in two flavors: domestic work and market work. Domestic work includes food preparation, childcare, cleaning, or any other labor within the household. Market work generates money or goods to trade for any goods and services that the household does not produce. The “labor burden” on the household is the combined number of hours spent doing those two types of work.

      Market and domestic labor can substitute one another. Children can go to kindergarten, and food can be bought as take-out. Likewise, clothes can be purchased from a factory, or they can be stitched at home. People tend to use the option that gets them the desired good or service with the least amount of work. As I will show below, the net effect of changes in those two forms of labor determines the total household labor supply. Or, to put it less formally, it determines how long people have to work to gain what they want. Once those two kinds of labor are added up, a declining trend in the total number of hours worked becomes apparent. Consider this report from the Federal Reserve Bank of Boston:

      Specifically, we document that leisure for men increased by 6-8 hours per week (driven by a decline in market work hours) and for women by 4-8 hours per week (driven by a decline in home production work hours). 

      And that was just for the period between 1965 and 2003. A closer look at the 20th century suggests that market working hours fell for men and rose for women. The rise in female market working hours was precipitated by technological innovation and a concomitant decline in the number of domestic working hours. Domestic working hours fell greatly for women and, less dramatically, for men. The net effect of the four processes was that leisure hours rose, and total working hours fell, for both men and women.

      In his 1930 essay Economic Possibilities for our Grandchildren, the British economist John Maynard Keynes predicted that the next century would usher in an age of prosperity. He also forecasted that people would work less and spend more time at leisure. Keynes turned out to be right. But many modern readers, who come across Keynes’ prediction of a 15-hour workweek, wonder why they are still putting in 40 at the office. The answer is that the work we killed was the domestic labor done largely by women. 

      One author estimates that it took 60 hours a week of physical labor to keep a 1930 household working. Today, it takes perhaps 15 hours. Those numbers are not exact, but when you consider the washing machine, the gas oven, the vacuum cleaner, prepared food, and steam irons, the amount of household work eliminated is immense. One of Hans Rosling’s TED talks recounts how the washing machine brought him books. According to the Swedish physician, once the washing machine liberated his mother from laundry, she had more time to read to him. The South Korean economist Ha Joon Chang claims that the washing machine – by which he really means all domestic labor-saving technologies – changed the world more than the internet.

      But labor alleviation did not begin in the 20th century. In her new book (The Fabric Of Civilisation came out in November 2020), the American writer Virginia Postrel estimates that it took 365 full days of work to spin enough thread to make a Viking sail. Days and days of work to create enough thread to weave a bandana and weeks to make a pair of jeans. The Vikings used the drop spindle to make thread – a basic technology that humans used for millennia. The spinning wheel, which partly mechanized the process, arrived in Europe sometime in the 11th or the 12th century A.D. 

      Then came the Industrial Revolution, first with the Spinning Jenny, which was followed by Crompton’s Mule and endless other derivatives. These machines progressively automated what was a horrendously time-consuming and nearly exclusively female domestic task for centuries. The economic historian Brad Delong has remarked that when women of any class are depicted in older literature, there is always reference to their spinning. By the time of Jane Austen’s novels in the late 18th and early 19th century A.D., spinning is never mentioned – it was all done in the factories by then.

      We all have more leisure now than our forebears did. We have more time to do as we wish and fewer needs that force us to do as we must. But this wonderful outcome of human progress is obscured by the fact that, in large part, it is the household labor that has been automated away. Sure, the Roomba might not be a great leap forward, but it is just the latest iteration of a process that began a thousand years ago. And there is no sign of it ending.

      Blog Post | Adoption of Technology

      Don't Count on a “Tech-Driven” Employment Apocalypse

      New technology creates more, better jobs than it costs. If anything, automation may lead to labor shortages.

      Media reports often paint a dire picture of technological change and automation which they fear will spawn a future rife with massive job loss and less employment. And yet, a labour shortage— not a glut due to mass unemployment— looms in Canada thanks to retiring baby boomers and our aging population.

      Furthermore, history suggests that when technological change alters the employment mix, the economy grows, creating new jobs and more opportunity. For example, a Deloitte study of census results for the United Kingdom since 1871 notes that, despite fears of job destruction, technological change spurs job creation. Over the long run, the UK has experienced increases in both employment and the labour force. While there were declines in some occupations such as agricultural labourers, washers, launderers, telephonists, and telegraph operators, other occupations such as accountants, bar staff, hairdressers, service workers, etc. experienced employment growth.

      The situation is the same in Canada. Between 1851 and 2017—an era marked by rapid technological change— our population grew from 2.4 million to 35.2 million, a 15-fold increase, while the Canadian labour force grew from an estimated 762,000 people to 19.7 million people, a 26-fold increase. And according to employment data, from 1891 to 2017, the number of employed people in Canada grew from 1.6 million to 18.4 million, a 12-fold increase, while the labour force (which includes employed people, unemployed people seeking work, and employers) grew—from 1.7 million people to 19.7 million people, also a 12-fold increase.

      While employment and the labour force grew alongside technological progress and development, the composition of employment also changed. For example, in 1921 agriculture still accounted for nearly one-third of all employment in Canada (down from 50 percent in 1871) compared to two percent by the early 21st century. Overall, the last 150 years in Canada has seen a shift from goods production (manufacturing, for example) to services (health, for example) as the dominant source of employment. Even as demand for many traditional jobs has declined, entirely new occupations have arisen that did not exist mere decades ago—think of today’s social media strategists, solar panel installers, and genetic counsellors.

      Forecasts suggest that in coming years, employment and the labour force in Canada will continue growing, but at a diminished rate with employment growing slightly faster than the labour force. The result? Low unemployment rates. Again, this is due largely to our aging population and the expected decline in labour force participation rates. Overall labour force participation in Canada has declined over the last decade but interestingly has grown among people aged 55 and over, reflecting the progress of the demographic bulge known as the Baby Boom.

      In 2016, people aged 55 and over accounted for 36 percent of Canada’s working-age population—the highest percentage since 1976, the first year of comparable data—with this proportion expected to reach 40 percent by 2026. Yet this demographic will eventually retire, opening up large areas of employment to the smaller age cohorts behind. Demand for workers is expected to be high in health care, computer system design and related services, support services for mining, oil, and gas extraction, social assistance, legal, accounting, and other professional services, arts and entertainment, and food services, such as chefs and servers.

      Clearly, contrary to popular belief, history teaches that technological change has been marked by increases in total long-term employment, notwithstanding shortterm job loss for individuals. That’s good news. Canada’s labour market will likely experience continued employment growth (though at lower rates than in the previous half-century) due to demographic changes and changes in labour force participation rates. Our aging labour force, the retirement of baby boomers, and the creation of new jobs spurred by technology, will combine to create a period of chronic labour scarcity, which means the demand for workers will be high.

      This originally appeared in The Fraser Institute’s Fall 2019 Quarterly publication.