Summary: Over the past 50 years, Americans have seen a dramatic increase in housing quality and space. While housing costs appear to have risen, today’s homes offer more value per dollar. We can see this by adjusting for household size and improvements like air conditioning, garages, and extra bathrooms. We now get more housing for the same share of income.
The Bureau of Labor Statistics (BLS) conducts consumer expenditure surveys, collecting data on a wide variety of products and services.
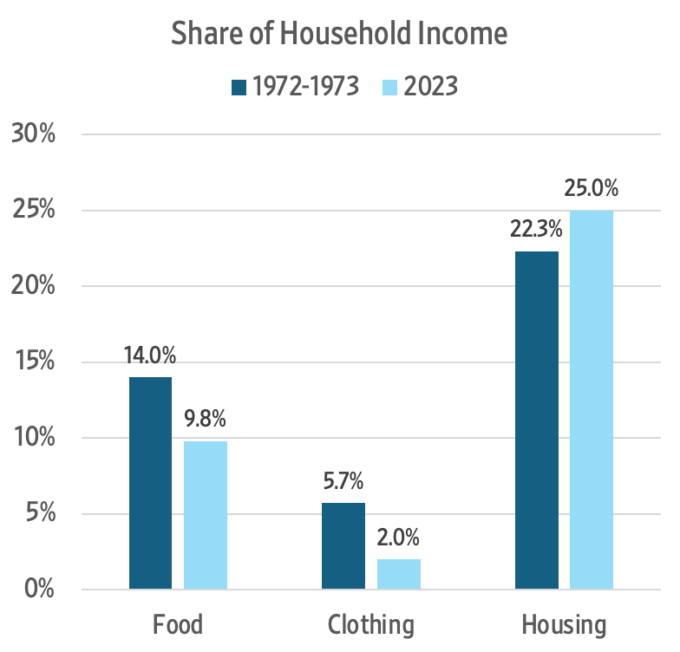
Over the past 50 years, the percentage of household income spent on food fell 30 percent, and spending on clothing has dropped by 64.9 percent, yet housing costs have increased by 12.1 percent. What explains this rise? At least six key differences between homes in the early 1970s and in 2023 help account for the change:
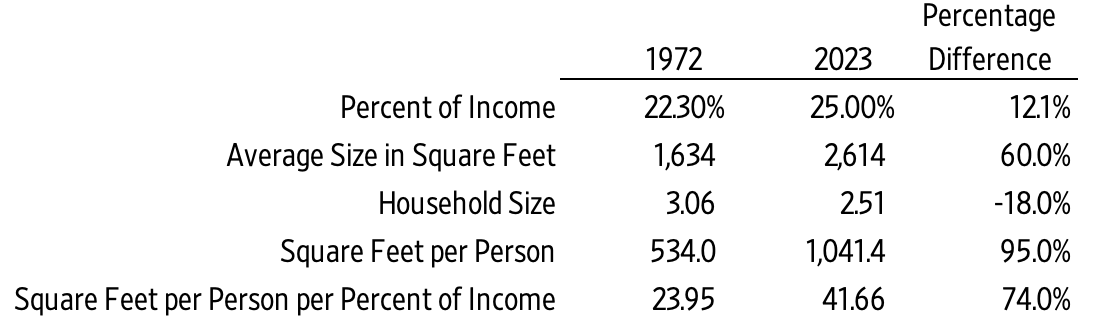
- Size: The average home in 1972 measured 1,634 square feet, compared to 2,614 square feet in 2023—a 60 percent increase (980 additional square feet).
- Household Size: Average household size declined from 3.06 persons in 1972 to 2.51 in 2023, an 18 percent decrease. We’re buying more house per person.
In 1972, the average living space per person was 534 square feet; by 2023, it had nearly doubled to 1,041.4 square feet. In terms of affordability, one percent of household income bought 23.95 square feet of housing in 1972, compared to 41.66 square feet in 2023. We’re getting 74 percent more housing per person for the same share of income.
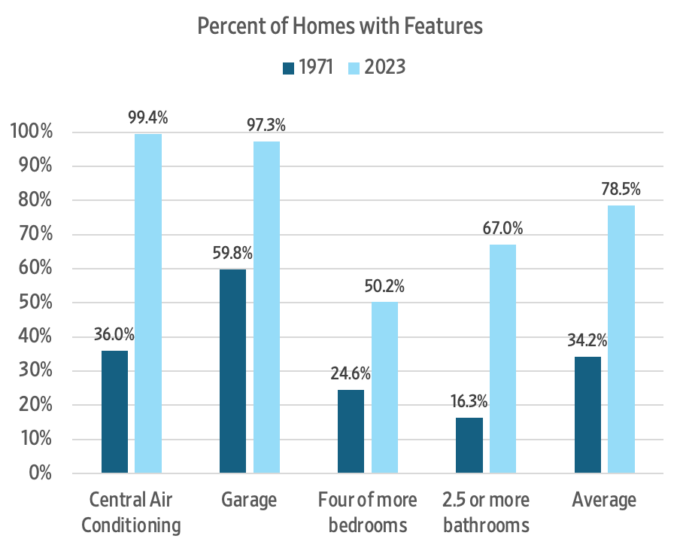
Four other factors also help explain the difference:
- Air Conditioning: In 1971, only 36 percent of homes had central air; by 2023, that number had reached 99.4 percent.
- Garages: The share of homes with garages rose from 59.8 percent in 1971 to 97.3 percent in 2023.
- Bedrooms: In 1971, only 24.6 percent of homes had four or more bedrooms; in 2023, 50.2 percent did.
- Bathrooms: The percentage of homes with 2.5 or more bathrooms increased from 16.3 percent in 1971 to 67 percent in 2023.
After adjusting for increased square footage and smaller household size, the share of household income spent on housing falls to 14.3 percent. If we further account for improvements—such as the addition of air conditioning, garages, extra bedrooms, and bathrooms—a modest 25 percent quality adjustment brings the rate closer to 10.7 percent. In effect, we’re now spending less than half as much of our household income on basic housing compared to the early 1970s.

We also see this phenomenon clearly when comparing automobiles from the early 1970s to those of today. While both have four wheels, modern cars deliver vastly superior fuel efficiency, comfort, safety, reliability, and performance.
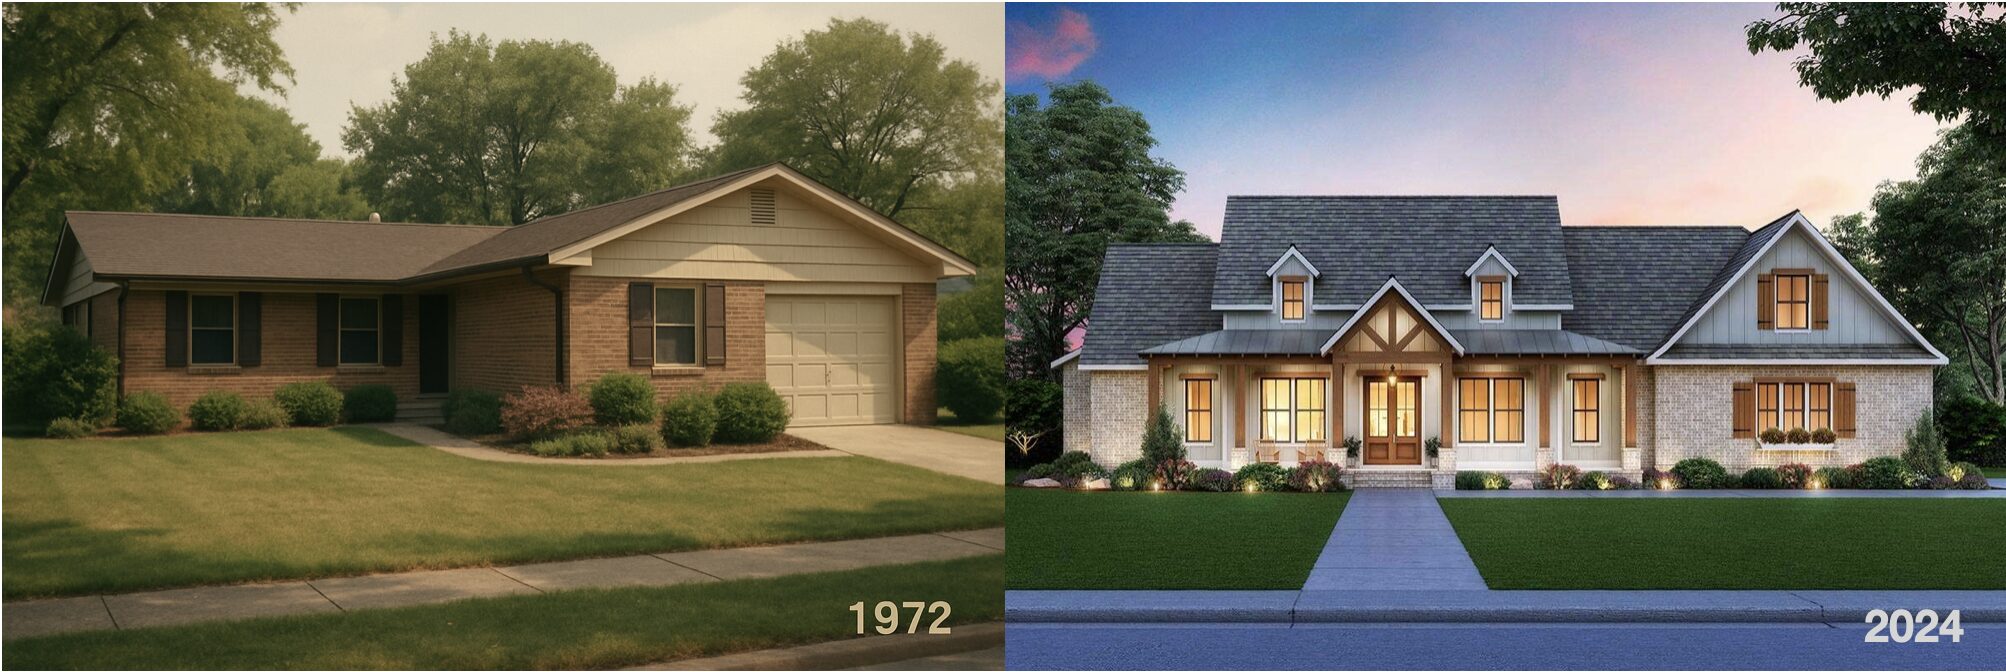
The real question is: how much would someone have to pay you to trade your 2023 home and 2023 car for their 1972 counterparts?
Tip of the Hat: Jeremy Horpendahl
Find more of Gale’s work at his Substack, Gale Winds.