“Home Alone” Grocery Shopping, but with Time Prices
Things can become more expensive and more affordable at the same time.
Gale L. Pooley —
In the 1990 movie Home Alone, eight-year-old Kevin McCallister went grocery shopping. He bought a half gallon of milk, a half-gallon of orange juice, a TV dinner, bread, frozen mac and cheese, laundry detergent, cling wrap, toilet paper, a pack of toy soldiers, and dryer sheets. His bill came to $19.83.
Professor Christopher Clarke at Washington State University did an analysis of the items and estimated that today’s price would be about $40.60, or 104.7 percent higher. But we know that things can become more expensive and more affordable at the same time. How is this possible?
Because wages typically increase faster than prices. In the past 33 years, unskilled hourly wages have increased by 178.3 percent from $6.03 per hour to around $16.50. This means the time price of Kevin’s basket has fallen by 25.2 percent. For the time it took to earn the money to buy the basket in 1990, you get 1.337 baskets today. Grocery abundance has increased by 33.7 percent.
If you had been upskilling from an unskilled labor job in 1990 to a blue-collar job today, your wages increased 505.8 percent from $6.03 to $36.50 an hour. Your time price fell by 66.2 percent, giving you almost three times more (195.6 percent) for your hour of work.
Don’t forget to count the kids before taking off on Christmas vacation this year, and remember, life can become more abundant every day if people are free to innovate.
This article was originally published at Gale Winds on 12/9/2023.
Poverty Declines in Georgia as Income Inequality Decreases in 2024
“The National Statistics Office recently published data revealing that Georgia saw a significant decline in poverty in 2024, with the national absolute poverty rate dropping to 9.4%, down 2.4 percentage points from the previous year.”
Wage Inequality Declined in Most Countries Since Start of 21st Century
“The Global Wage Report 2024-25 finds that since the early 2000’s, on average, wage inequality, which compares the wages of high and low wage earners, decreased in many countries at an average rate that ranged from 0.5 to 1.7 per cent annually, depending on the measure used. The most significant decreases occurred among low-income countries where the average annual decrease ranged from 3.2 to 9.6 per cent in the past two decades.
Wage inequality is declining at a slower pace in wealthier countries, shrinking annually between 0.3 and 1.3 per cent in upper-middle-income-countries, and between 0.3 to 0.7 per cent in high-income countries”
Remittances to Poor Countries Reached $685 Billion in 2024
“Officially recorded remittances to low- and middle-income countries (LMICs) are expected to reach $685 billion in 2024. The true size of remittances, including flows through informal channels, is also believed to be even larger. The growth rate of remittances in 2024 is estimated to be 5.8 percent, significantly higher than 1.2 percent registered in 2023…
It is notable that remittances have continued to outpace other types of external financial flows to low- and middle-income countries. Remittances have even surpassed FDI significantly (figure 5). The gap between remittances and FDI is expected to widen further in 2024.”
Thanksgiving Dinner Will Be 8.8 Percent Cheaper This Year
Be thankful for the increase in human knowledge that transforms atoms into valuable resources.
Gale L. Pooley —
Summary: There has been a remarkable decrease in the “time price” of a Thanksgiving dinner over the past 38 years, despite nominal cost increases. Thanks to rising wages and innovation, the time required for a blue-collar worker to afford the meal dropped significantly, making food much more abundant. Population growth and human knowledge drive resource abundance, allowing for greater prosperity and efficiency in providing for more people.
Since 1986, the American Farm Bureau Federation (AFBF) has conducted an annual price survey of food items that make up in a typical Thanksgiving Day dinner. The items on this shopping list are intended to feed a group of 10 people, with plenty of leftovers remaining. The list includes a turkey, a pumpkin pie mix, milk, a vegetable tray, bread rolls, pie shells, green peas, fresh cranberries, whipping cream, cubed stuffing, sweet potatoes, and several miscellaneous ingredients.
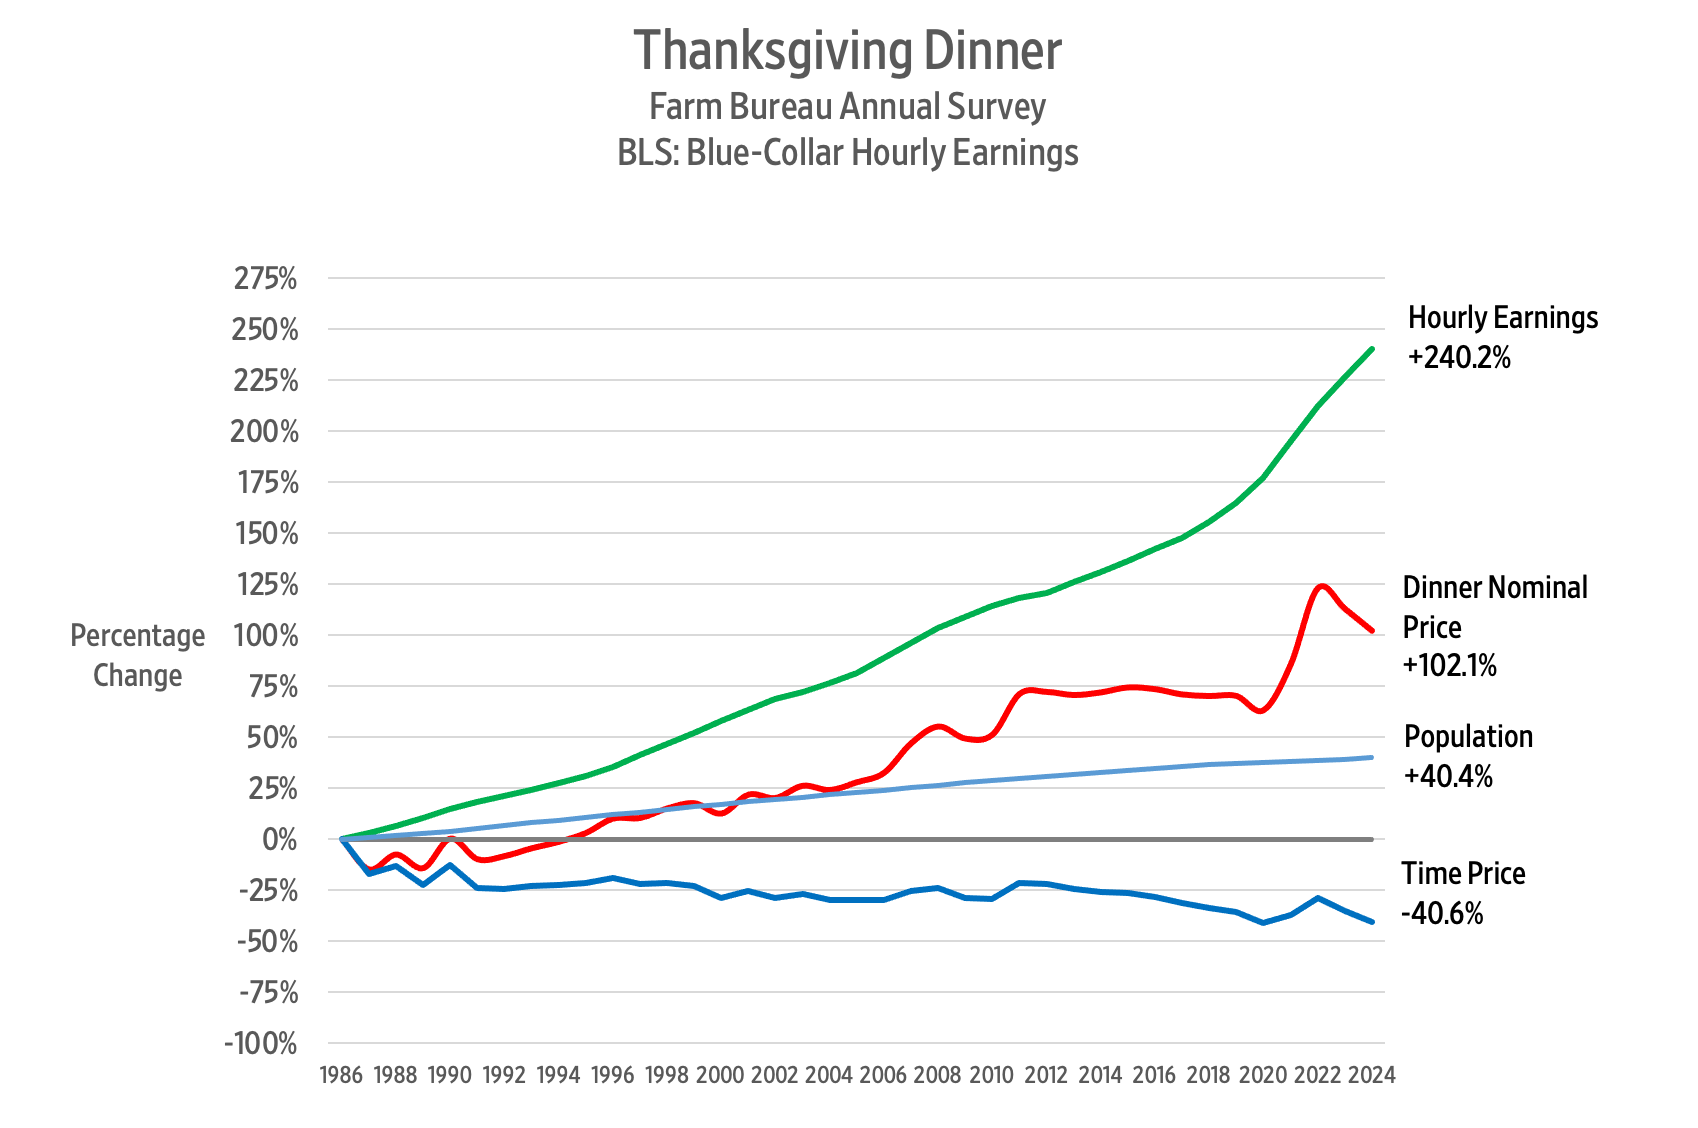
So, what has happened to the price of a Thanksgiving Day dinner over the past 38 years? The AFBF reports that in nominal terms, the cost rose from $28.74 in 1986 to $58.08 in 2024. That’s an increase of 102.1 percent.
Since we buy things with money but pay for them with time, we should analyze the cost of a Thanksgiving Day dinner using time prices. To calculate the time price, we divide the nominal price of the meal by the nominal wage rate. That gives us the number of work hours required to earn enough money to feed those 10 guests.
According to the Bureau of Labor Statistics, the blue-collar hourly wage rate increased by 240.2 percent – from $8.96 per hour in October 1986 to $30.48 in October 2024.
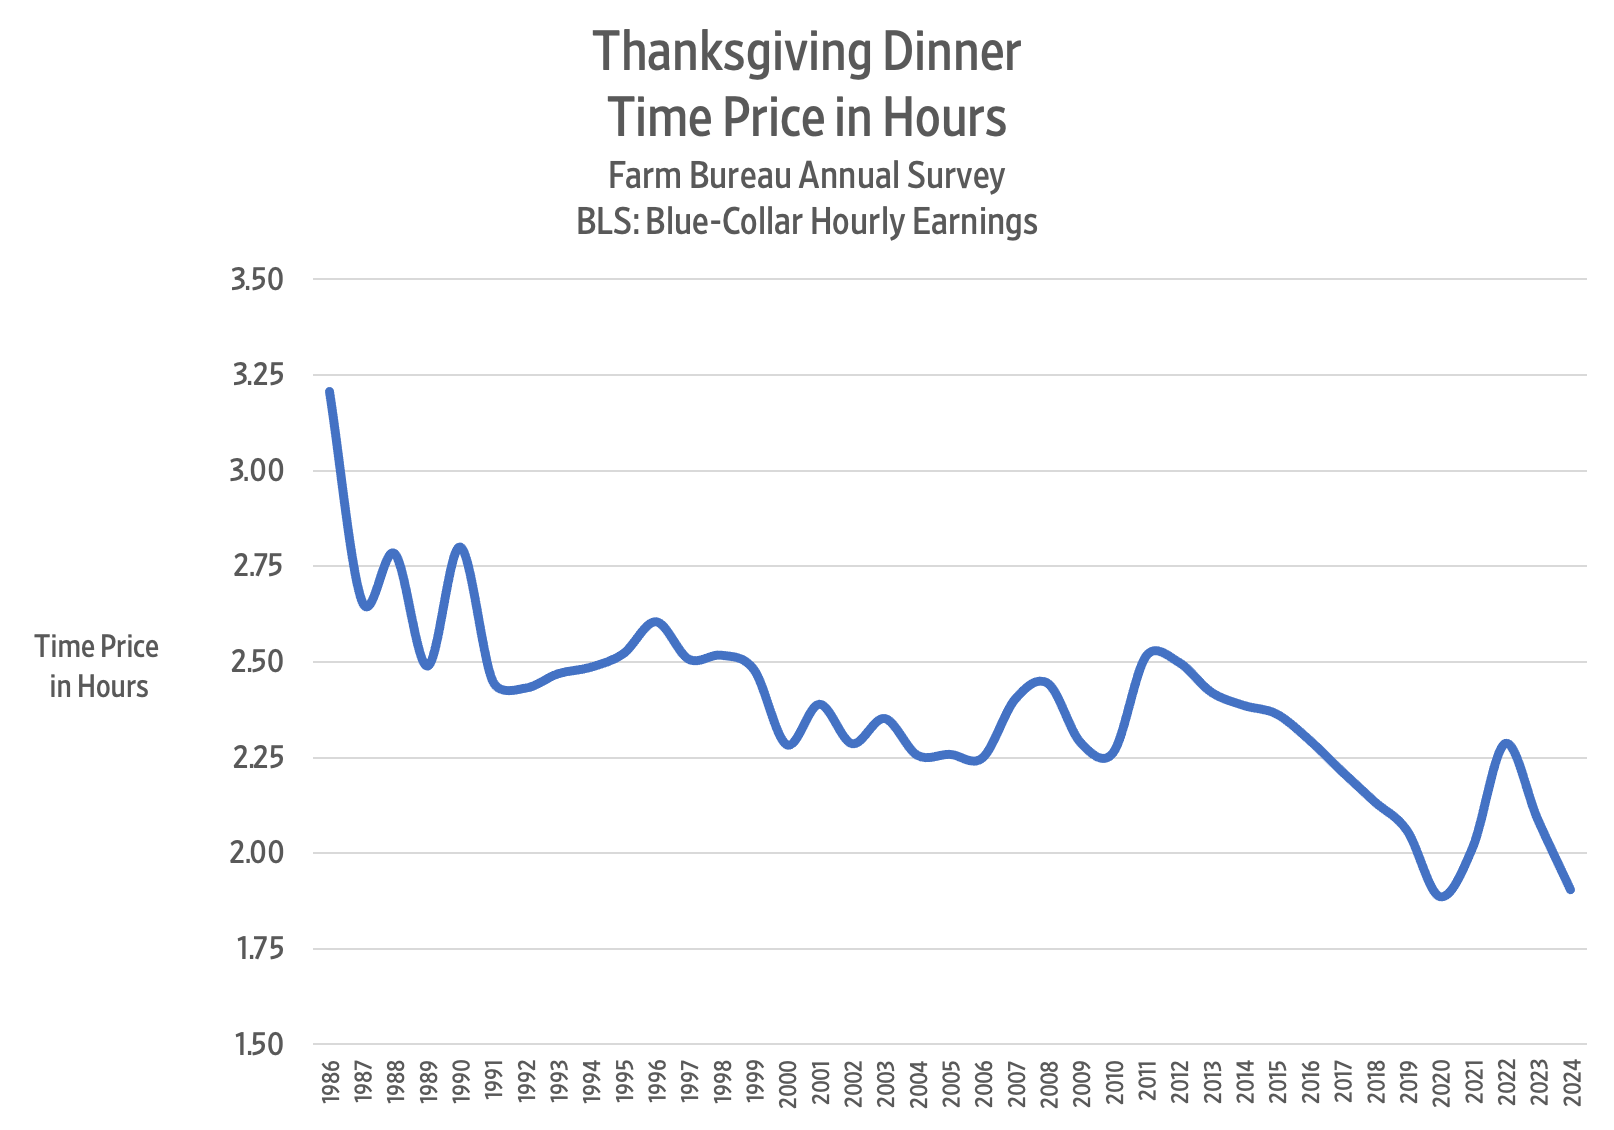
Remember that when wages increase faster than prices, time prices decrease. Consequently, we can say that between 1986 and 2024 the time price of the Thanksgiving dinner for a blue-collar worker declined from 3.2 hours to 1.9 hours, or 40.6 percent.
That means that blue-collar workers can buy 1.68 Thanksgiving Day dinners in 2024 for the same number of hours it took to buy one dinner in 1986. We can also say that Thanksgiving dinner became 68 percent more abundant.
Here is a chart showing the time price trend for the Thanksgiving dinner over the past 38 years:
The lowest time price for the Thanksgiving dinner was 1.87 hours in 2020, but then COVID-19 policies struck, and the time price jumped to 2.29 hours in 2022.
In 2023, the time price of the Thanksgiving dinner came to 2.09 hours. This year, it came to 1.91 hours – a decline of 8.8 percent. For the time it took to buy Thanksgiving dinner last year, we get 9.6 percent more food this year.
Between 1986 and 2024, the US population rose from 240 million to 337 million – a 40.4 percent increase. Over the same period, the Thanksgiving dinner time price decreased by 40.6 percent. Each one percentage point increase in population corresponded to a one percentage point decrease in the time price.
To get a sense of the relationship between food prices and population growth, imagine providing a Thanksgiving Day dinner for everyone in the United States. If the whole of the United States had consisted of blue-collar workers in 1986, the total Thanksgiving dinner time price would have been 77 million hours. By 2024, the time price fell to 64.2 million hours – a decline of 12.8 million hours or 16.6 percent.
Given that the population of the United States increased by 40.4 percent between 1986 and 2024, we can confidently say that more people truly make resources much more abundant.
An earlier version of this article was published at Gale Winds on 11/21/2024.