fbpx
01 / 05
Even with Gas Prices at Historic High, Your Time Takes You Farther

Blog Post | Cost of Living

Even with Gas Prices at Historic High, Your Time Takes You Farther

You can drive 62 percent farther for your time today than in 1980.

Summary: Although nominal gas prices recently reached historic highs, your time can get you further than ever before. As this article explains, the time price of gasoline has decreased by 4 percent since 1980, and the time price per mile driven has fallen by 38 percent.


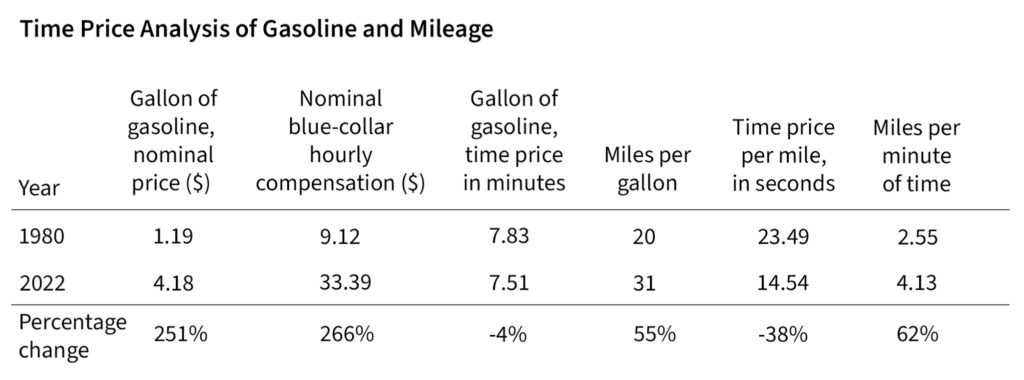
The top-selling car in 1980 was the Oldsmobile Cutlass. Gas mileage on this vehicle averaged 20 miles per gallon (17 city/23 highway). By 2022, the Honda CR-V claimed that title. The CR-V reported mileage at 31 miles per gallon (28 city/34 highway). This represents an increase of 55 percent over this 41-year period. Mileage has been increasing at a compound rate of around 1 percent a year.

Back in 1980, gasoline was selling for $1.19 per gallon and blue-collar hourly compensation (wages and benefits) averaged $9.12 per hour. This indicates a time price rate of 7.83 minutes per gallon. Today, gasoline is selling for around $4.18 per gallon and blue-collar hourly compensation is up to $33.39 per hour, indicating a rate of around 7.51 minutes per gallon. While the nominal price of a gallon of gasoline has increased by 251 percent, the time price has actually dropped by 4 percent.

But how much does it cost to travel one mile? That depends on the time price of gasoline and the car’s mileage. In 1980, at 20 miles per gallon, the time price per mile on the Cutlass would have been 23.5 seconds. By 2022, with the CR-V getting 31 miles per gallon, the time price per mile would be around 14.5 seconds. The time price per mile has decreased by 38 percent.

You can look at mileage from the perspective of how many miles you earn per minute of work time. The 1980 Cutlass would have given you 2.55 miles per minute of your time, while the 2022 CR-V gives you 4.13 miles. Gas mileage abundance, from your time perspective, has increased by 62 percent.
There are other differences to consider. NADAguides, a website that values automobiles and other transportation equipment, reports that the price of a new Cutlass in 1980 was $6,735. At $9.12 per hour, it would have taken a blue-collar worker 738 hours to own this new car. Today the CR-V is retailing for around $28,334. At $33.39 per hour, it would take the worker 849 hours to buy one. So, while the time price of the top-selling car has increased by 15 percent, the mileage, safety, reliability, and comfort have all increased by much more.

Yes, nominal gas prices are at historic highs, but it’s not the money that counts, it’s your time. Time prices are the true prices.

Demography | Personal Income

Generational Progress on Income Growth Continues in US

“Whether each generation of Americans continues to economically surpass the previous one has recently been called into question. We construct a posttax, posttransfer income measure from 1963 to 2023 based on the Current Population Survey Annual Social and Economic Supplement that allows us to consistently compare the economic well-being of five generations of Americans at ages 36–40. We find that Millennials had a real median household income that was 20% higher than that of the previous generation, a slowdown from the growth rate of the Silent Generation (36%) and Baby Boomers (26%), but similar to that of Generation X (16%). The slowdown for younger generations largely resulted from stalled growth in work hours among women. Progress for Millennials younger than 30 has also remained robust, though largely due to greater reliance on their parents. Additionally, lifetime income gains for younger generations far outweigh their higher educational costs.”

From Demography.

Blog Post | Cost of Living

Are Americans Getting Richer? New Data Might Surprise You

Workers have proven resilient over the past decade, despite inflation and valid affordability fears.

Summary: We introduce the American Abundance Index, which measures living standards by how many hours Americans must work to afford a standard basket of goods, rather than by prices or wages alone. The index uses time prices to show that for most US workers, purchasing power has generally risen over the last two decades, even amid inflation and public pessimism.


The resilience of the American worker is one of the most underreported stories of the 2020s. From red tape to import taxes, successive governments have erected barriers to success. Yet America’s workers have persevered and figured out ways to prosper.

A new American Abundance Index illustrates this. The project from Human Progress, an arm of the Cato Institute, reveals the steady rise of the average worker’s purchasing power. The premise of the index is simple: how many hours do you need to work, compared to the month or year before, to be able to afford the “basket of goods,” which is a standard set of household items and services that comprise the Consumer Price Index used to calculate inflation.

The “time price” is how many hours of work it takes to purchase the basket of goods. The “abundance” is how much of the basket one hour of work can buy. The story told by the index is a very good one: since recordkeeping began, “abundance” for average private sector workers comes out to a net increase of 13.8 percent.

It increased the past year, too. The index shows the average private sector worker saw prices rise by 2.7 percent from December 2024 to December 2025, while their hourly wages grew by 3.8 percent. This means workers could work 1 percent less to buy the same basket of goods. Put differently, workers could afford 1 percent more stuff.

The reason for this is that earnings have continued to outpace inflation. So long as wages increase faster than inflation, the worker gets ahead. And it’s not just desk jobs that have enabled workers to purchase the same amount of goods and services for fewer hours worked. The gain for traditional “blue collar workers” is even higher: a historical net increase of 18.4 percent since 2006.

Despite workers significantly increasing their purchasing power over the past two decades, the past five years have taken a toll. The self-inflicted pain of printing vast sums of money during the pandemic sent the annualized inflation rate to over 9 percent in 2022, far outstripping raises. While inflation is now mostly under control, it has taken time for the gap between wages and inflation to settle, and workers are only now just catching up after their losses during those inflation-heavy years.

Americans continue to rank affordability as a top concern and do not believe the government is doing enough to address the cost of living. These frustrations are understandable. Prices are still rising while tariffs and uncertainty strangle businesses and push consumer confidence to a 12-year low. America’s growth and prosperity story has always been one of fits and starts, and workers are right to demand that government gets out of their way. But the new data make clear that 21st century Americans can still be content about how far they’ve come and optimistic about how far they’ve yet to go.

This article was originally published in the Washington Post on 2/6/2026.

Blog Post | Cost of Living

Introducing the American Abundance Index

American living standards are best measured in time.

We are excited to share a new tool we’ve been building at Human Progress: The American Abundance Index—an interactive dashboard that tracks US living standards while adjusting for both inflation and rising incomes.

The idea is straightforward: how many hours do you need to work to afford the same basket of goods and services? Using Bureau of Labor Statistics data, the American Abundance Index converts price and wage growth into “time prices”—the amount of work time required to buy the Consumer Price Index (CPI) basket of goods and services—and “abundance,” which is the inverse: how much of that basket one hour of work can buy. When time prices fall, abundance rises, and each hour of work goes further. That’s the measure of affordability that actually matters.

Conceptually, this work builds off of Superabundance, a book by our editor, Marian Tupy, and his coauthor and Human Progress board member, Gale Pooley. Their core argument—that abundance is best measured in time—forms the foundation of the project. The index itself was built by our Quantitative Research Associate, Jackson Vann.

Users can select multiple worker categories, compare short- and long-run trends, and even see wage growth modeled to reflect real career progression rather than freezing workers in place. All the calculations are transparent and replicable, with the full dataset and code available on GitHub.


So what does the index actually say about American standards of living?

Over the past 12 months, inflation rose 2.68 percent while hourly earnings for the average private-sector worker grew 3.76 percent. As a result, the CPI basket became 1.05 percent more abundant. Since 2006, it has become nearly 14 percent more abundant—roughly equivalent to adding an hour of purchasing power to the average workday.

Blog Post | Cost of Material Goods

Why Your Groceries Are Cheaper than Kevin McCallister’s

Since 1990, grocery abundance has increased by 43.2 percent and pizza abundance by 285 percent for blue-collar workers. If you were upskilling, it was 186 percent for groceries and 610 percent for pizzas.

Summary: A famous grocery run in Home Alone appears to illustrate how much nominal prices have risen since the film came out in 1990. But a look at sticker prices alone misses the bigger picture. When costs are measured against what people earn, everyday food looks far more affordable than it once did. Thanks to rising nominal wages and ongoing innovation, modern households enjoy far greater abundance, even when nominal prices appear higher at first glance.


In the 1990 movie Home Alone, eight-year-old Kevin McCallister went grocery shopping. He bought a half gallon of milk, a half gallon of orange juice, a TV dinner, bread, frozen mac and cheese, laundry detergent, cling wrap, toilet paper, a pack of army men, and dryer sheets. His bill came to $19.83.

Professor Christopher Clarke at Washington State University does an annual price analysis of Kevin McCallister’s shopping basket and estimates that today’s price for those items would be around 114.5 percent higher ($42.54) than was the case in 1990. But, as my readers know quite well, things can become more expensive and more affordable at the same time. How is that possible? It’s possible because wages typically increase faster than prices. In the past 35 years, blue-collar hourly wages have increased by 207.7 percent, from $10.32 per hour in 1990 to $31.76 today.

Kevin’s basket in 1990, in time prices, would have cost 1.92 hours compared to 1.34 hours today. The time price of Kevin’s basket has fallen by 30.2 percent. For the time it took to earn the money to buy the basket of goods in 1990, you get 1.432 baskets today. Grocery abundance has increased by 43.2 percent.

If you got your first job in 1990 as an entry-level worker and have been upskilling for the past 35 years and are now an average worker, your hourly wage rate increased 511.3 percent: from $6.03 an hour in 1990 to $36.86 an hour today. Your grocery basket time price fell by 65 percent, giving you 2.86 baskets today. Your grocery abundance has increased by 186 percent.

In the movie, the McCallister family also orders 10 pizzas, and the bill comes to $122.50 (plus tip). That would put the time price for 1990s blue-collar workers at 11.87 hours, or about one hour and 11 minutes per pizza.

Professor Clarke did a price check on how much 10 classic cheese and pepperoni pizzas cost at a Little Caesars pizzeria near the McCallister’s home today—it comes to only $98.09 (plus tip). The nominal price has actually shrunk! That would put today’s time price at 3.08 hours for the 10 pizzas, or about 18.5 minutes per pizza. The time price has fallen by 74 percent. That means that for the time it took to earn the money to buy one pizza in 1990 you get 3.85 pizzas today. Pizza abundance has increased by 285 percent. If you are an upskilled worker, your pizza time price fell by 85.9 percent, giving you 7.1 pizzas today for the time price of 1 in 1990, thus increasing your abundance by 610 percent.

Hopefully you didn’t forget to count the kids before taking off on Christmas vacation this year! And remember, life can become more abundant every day if people are free to innovate.

Find more of Gale’s work at his Substack, Gale Winds.