
“57% of [US] workers are making more money now — after adjusting for inflation — than they were a year ago. 41% of us have seen a real wage increase of more than 5%.”
From Axios.
“57% of [US] workers are making more money now — after adjusting for inflation — than they were a year ago. 41% of us have seen a real wage increase of more than 5%.”
From Axios.

Summary: There has been a remarkable decrease in the “time price” of a Thanksgiving dinner over the past 38 years, despite nominal cost increases. Thanks to rising wages and innovation, the time required for a blue-collar worker to afford the meal dropped significantly, making food much more abundant. Population growth and human knowledge drive resource abundance, allowing for greater prosperity and efficiency in providing for more people.
Since 1986, the American Farm Bureau Federation (AFBF) has conducted an annual price survey of food items that make up in a typical Thanksgiving Day dinner. The items on this shopping list are intended to feed a group of 10 people, with plenty of leftovers remaining. The list includes a turkey, a pumpkin pie mix, milk, a vegetable tray, bread rolls, pie shells, green peas, fresh cranberries, whipping cream, cubed stuffing, sweet potatoes, and several miscellaneous ingredients.
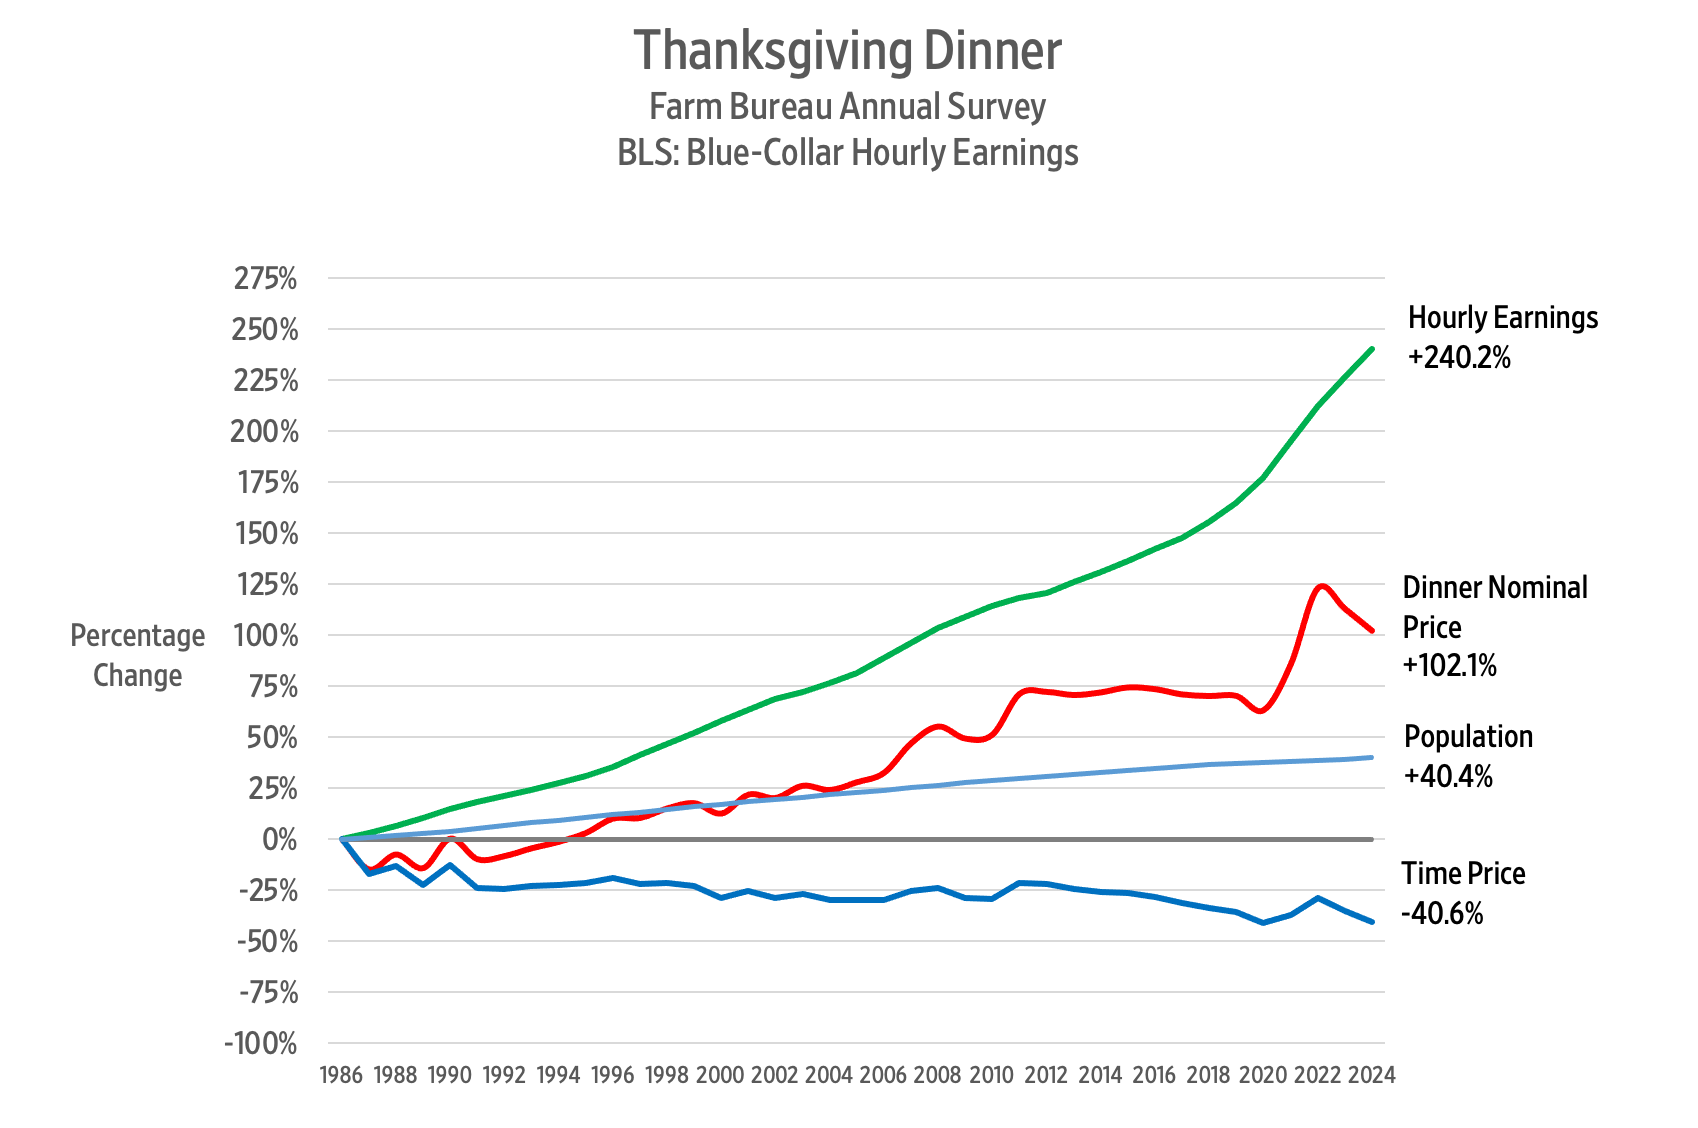
So, what has happened to the price of a Thanksgiving Day dinner over the past 38 years? The AFBF reports that in nominal terms, the cost rose from $28.74 in 1986 to $58.08 in 2024. That’s an increase of 102.1 percent.
Since we buy things with money but pay for them with time, we should analyze the cost of a Thanksgiving Day dinner using time prices. To calculate the time price, we divide the nominal price of the meal by the nominal wage rate. That gives us the number of work hours required to earn enough money to feed those 10 guests.
According to the Bureau of Labor Statistics, the blue-collar hourly wage rate increased by 240.2 percent – from $8.96 per hour in October 1986 to $30.48 in October 2024.
Remember that when wages increase faster than prices, time prices decrease. Consequently, we can say that between 1986 and 2024 the time price of the Thanksgiving dinner for a blue-collar worker declined from 3.2 hours to 1.9 hours, or 40.6 percent.
That means that blue-collar workers can buy 1.68 Thanksgiving Day dinners in 2024 for the same number of hours it took to buy one dinner in 1986. We can also say that Thanksgiving dinner became 68 percent more abundant.
Here is a chart showing the time price trend for the Thanksgiving dinner over the past 38 years:
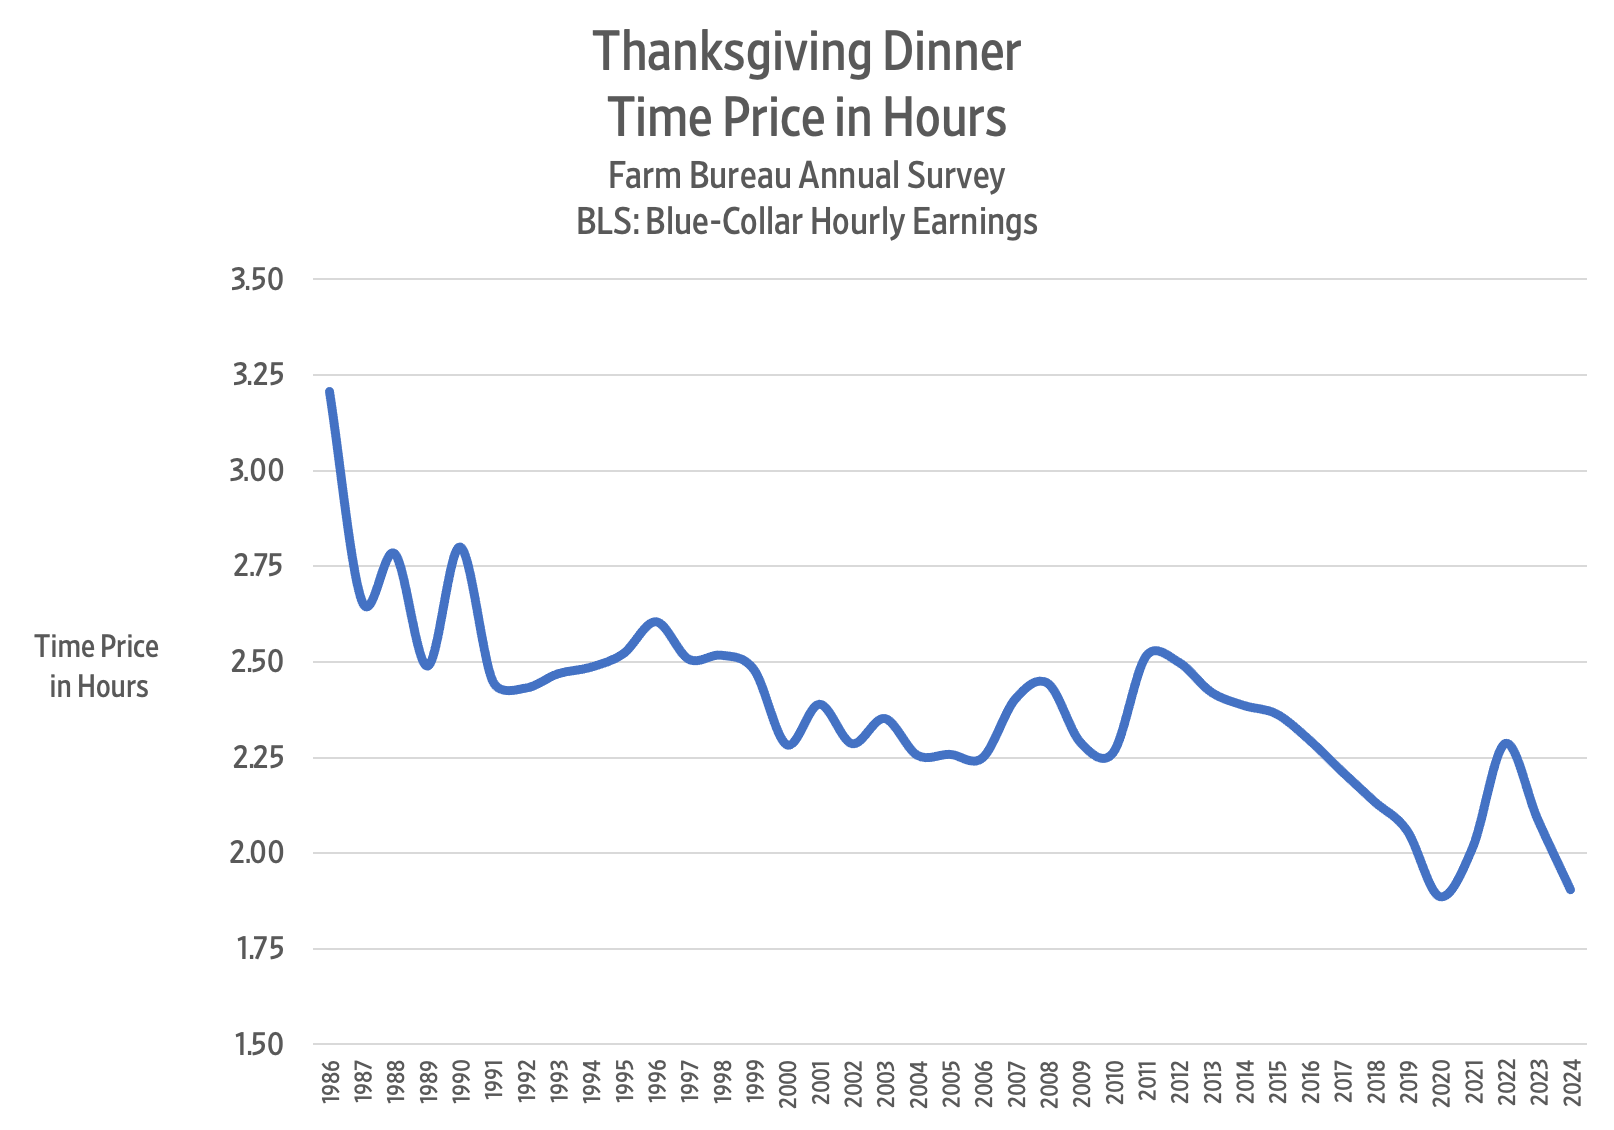
The lowest time price for the Thanksgiving dinner was 1.87 hours in 2020, but then COVID-19 policies struck, and the time price jumped to 2.29 hours in 2022.
In 2023, the time price of the Thanksgiving dinner came to 2.09 hours. This year, it came to 1.91 hours – a decline of 8.8 percent. For the time it took to buy Thanksgiving dinner last year, we get 9.6 percent more food this year.
Between 1986 and 2024, the US population rose from 240 million to 337 million – a 40.4 percent increase. Over the same period, the Thanksgiving dinner time price decreased by 40.6 percent. Each one percentage point increase in population corresponded to a one percentage point decrease in the time price.
To get a sense of the relationship between food prices and population growth, imagine providing a Thanksgiving Day dinner for everyone in the United States. If the whole of the United States had consisted of blue-collar workers in 1986, the total Thanksgiving dinner time price would have been 77 million hours. By 2024, the time price fell to 64.2 million hours – a decline of 12.8 million hours or 16.6 percent.
Given that the population of the United States increased by 40.4 percent between 1986 and 2024, we can confidently say that more people truly make resources much more abundant.
An earlier version of this article was published at Gale Winds on 11/21/2024.
“While higher costs for everything from milk to medicines have preoccupied U.S. consumers in the pandemic era, earnings have also risen enough, on average, to push up households’ purchasing power a bit. And blue-collar workers have been the biggest beneficiaries.
An analysis published in July by economists at the Treasury Department found that the median worker can afford the same representative basket of goods and services as they did in 2019 — plus have an additional $1,400 a year.”
From NBC News.
“The median household net worth of older millennials, born in the 1980s, rose to $130,000 in 2022 from $60,000 in 2019, according to inflation-adjusted data from the Federal Reserve Bank of St. Louis. Median wealth more than quadrupled to $41,000 for Americans born in the 1990s, which includes the generation’s youngest members, born in 1996.
The turnaround has been so dramatic that millennials—mocked at times for being perpetually behind in building wealth, buying homes, getting married and having children—now find themselves ahead.
In early 2024, millennials and older members of Gen Z had, on average and adjusting for inflation, about 25% more wealth than Gen Xers and baby boomers did at a similar age, according to a St. Louis Fed analysis.”
From Wall Street Journal.
“Just 13% of workers in the U.S. are now earning less than $15 an hour; two years ago, that number was 31.9%, per new data from Oxfam.
Why it matters: Even accounting for inflation — $15 an hour in 2024 has the same buying power as about $14 in 2022 — this is remarkable progress.”
From Axios.