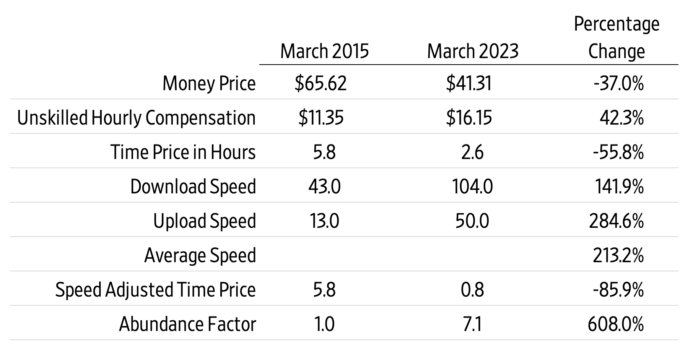
From 2015 to 2023, the average monthly bill for the most popular residential broadband service in the United States fell 37 percent from $65.62 to $41.43. During this same period, unskilled labor wages increased 42.3 percent from $11.35 to $16.15 per hour. Dividing these monthly prices by hourly wages gives us the time price of 5.8 hours in 2015 and 2.6 hours in 2023, indicating a 55.8 percent decrease over this eight-year period.
In addition, download speeds have increased by 141.9 percent from 43 megabits per second (Mbps) to 104 Mbps. Upload speeds increased 284.6 percent from 13 Mbps to 50 Mbps. The average speed increased by 213.4 percent.
Adjusting for the increase in speed puts the 2023 time price at around 0.8 hours, or 85.9 percent lower than 2015. For the time required to earn the money to buy one month of broadband services in 2015, you could get over seven months (608 percent more) in 2023. Broadband service abundance is increasing around 27.8 percent a year compounded annually, doubling in abundance every 30 months or so. At this rate, by 2030 your broadband speed should be over three times faster and your monthly bill less than half the cost of 2023’s monthly bill.
This article was published at Gale Winds on 1/18/2024.