
Summary: How much has breakfast changed in the last 100 years? This article shows how 12 breakfast staples have become much cheaper and more plentiful thanks to innovation and productivity. It uses the idea of time price, which tells us how long we have to work to afford something, to show how breakfast bounty has increased and how lower food prices give us more freedom and choices.
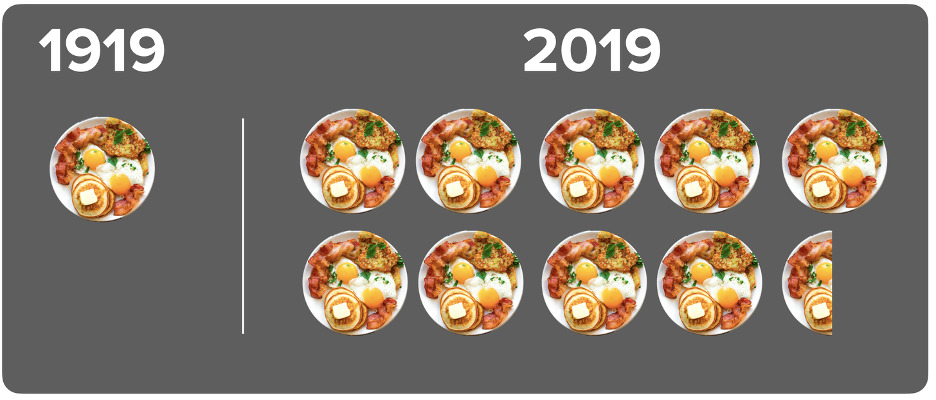
Between 1919 and 2019, the time price of breakfast fell by 93 percent. For the same length of time required to earn enough money to buy one breakfast in 1919, you could get 9.54 breakfasts in 2019 – an 854 percent increase in breakfast abundance. If you are interested in how we got those numbers, read on.
We started by comparing the nominal prices of 12 breakfast items in 1919 to the nominal prices of the same items in 2019. The items included bacon, bread, butter, coffee, corn flakes, cream of wheat, eggs, ham, milk, oranges, rolled oats, and sugar. We got the 1919 prices from the U.S. Bureau of Labor Statistics and the 2019 prices from Walmart.
We then divided the nominal prices of 12 breakfast items by the nominal hourly compensation rate earned by the average U.S. blue-collar worker. The ratio of a money price divided by the hourly compensation rate is called the time price, or the time required to earn enough money to buy an item.
We found that shoppers in 1919 spent $4.18 (in 1919 dollars) to buy all 12 items. At a compensation rate of 43 cents an hour, blue-collar workers had to work 9.72 hours to stock up their breakfast pantry. By 2019, the breakfast bill increased to $32.96. But the hourly compensation rate increased to $32.36. That means that it took just over one hour of work to earn the money needed to buy the same 12 breakfast items.
Compared to blue-collar workers in 1919, blue-collar workers in 2019 spent 90 percent less time earning enough money to buy breakfast. As such, they could enjoy more leisure, learn a new skill, earn money to buy something else, or take a nap. In that sense, innovation, which made all 12 breakfast items more affordable, gave all of us more freedom (i.e., more choices).
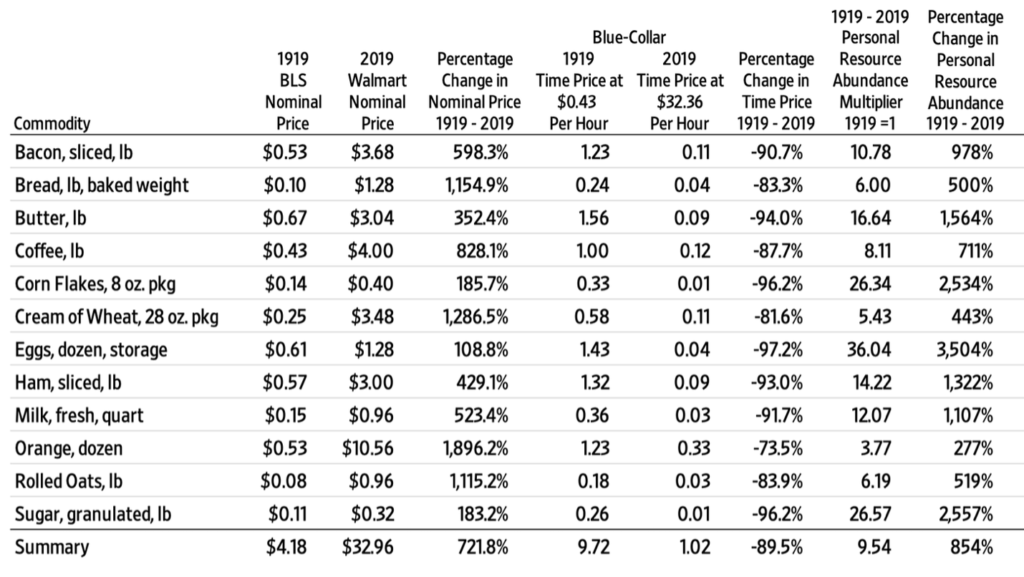
As the table above shows, all 12 breakfast items became more abundant, with the average time price decreasing by 93 percent. The time price of oranges fell the least (73.5 percent), and the time price of eggs fell the most (97.2 percent). Remember that the relationship between percentage change in time price and abundance is geometric, not linear. If an item becomes 50 percent cheaper, you get two items instead of one. A 97.2 percent decline in the time price of eggs means that instead of one egg, you get 36.
Another way of looking at breakfast abundance is to consider how many breakfasts blue-collar workers could get in 2019 for the same length of work needed to buy one breakfast in 1919. This “personal resource abundance” can be measured by comparing time prices at two different points in time. We do that by dividing the 1919 time price (9.72 hours) by the 2019 time price (1.02 hours). Given that 9.72 hours ÷ 1.02 hours equals 9.54, we can say that for the same length of work required to buy one breakfast in 1919, a blue-collar worker could get 9.54 breakfasts in 2019. That’s an 854 percent increase in personal resource abundance.
This 854 percent increase in personal breakfast abundance occurred while the U.S. population rose from 104.5 million to 328.2 million, or by 214 percent. So, every one percent increase in the U.S. population corresponded to a 4.0 percent increase in personal breakfast abundance.
The above data allows us to estimate resource abundance at a group level. We do that by multiplying personal resource abundance by the size of the group. We call that value “population resource abundance.” The changes in population resource abundance over time tell us whether resources are becoming more or less abundant for a group, country, or the entire planet.
Considering that personal breakfast abundance rose by 854 percent and the U.S. population grew by 214 percent, we can say that the total U.S. breakfast abundance increased by 2,896 percent [(9.54 x 3.14) -1]. Every one percent increase in the U.S. population corresponded to a 13.53 percent increase in the size of the overall U.S. “breakfast pie.”
Breakfasts became “Superabundant” (i.e., their abundance increased at a faster rate than population growth). When you enjoy your breakfast tomorrow morning, take a moment to thank all those who have worked to make all of our breakfasts so bounteous.
If you are interested in learning more about Superabundance, please email us at [email protected], and we will let you know in advance of the release of our upcoming book.