fbpx
01 / 05
Are Gas Prices Really the Highest in History?

Blog Post | Energy Prices

Are Gas Prices Really the Highest in History?

The time price is the true price. It's gallons per hour that count.

USA Today recently reported that gas prices are the most expensive that they’ve been in U.S. history, breaking the record from 2008. The U.S. Energy Information Administration notes that the average price of a gallon of gasoline reached $4.22 in April 2022, the highest nominal price ever and 16 cents higher than the previous record of $4.06 in July 2008.
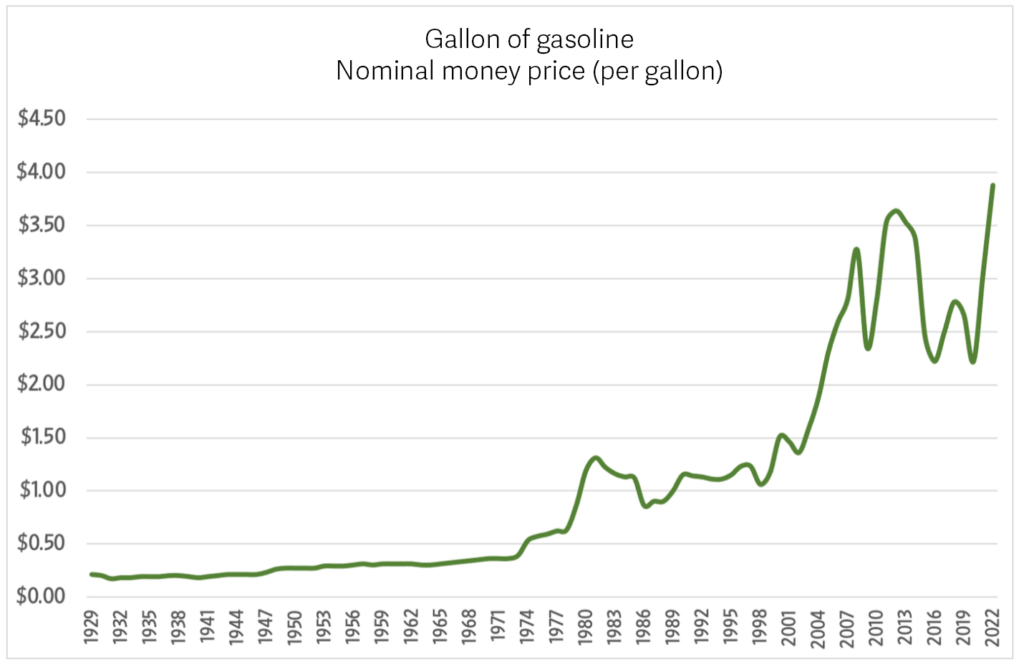
But does the nominal money price really reveal the true price? Since we buy things with money, but we pay for them with our time, there are actually two prices: money prices and time prices. Money prices are expressed in dollars and cents, while time prices are expressed in hours and minutes. Converting a money price to a time price is simple. Divide the money price of a product or service by hourly income. As long as hourly income increases faster than the money price, the time price will decrease.

To calculate the time price of a gallon of gasoline we divided the nominal money price by nominal blue-collar hourly compensation (wages and benefits) as reported by the economic data website measuringworth.com. When we look at the time price of a gallon of gasoline, we see a much different story.

In 1929 it took about 24 minutes to earn the money to buy one gallon of gasoline. Today the time price is closer to 6 minutes. The time price of gasoline has dropped by 75 percent. For the time it took to earn the money to buy one gallon in 1929, you can buy four gallons today. Gasoline abundance has increased by 300 percent. This occurred while the global population increased 290 percent, from 2 billion to 7.8 billion. The greater the population, the more abundant gasoline has become.

Another interesting way to think about the time price of a resource is to consider how many gallons of gasoline one hour of time would buy. Call this gallons per hour or GPH. This ratio reveals how much abundance is changing over time.
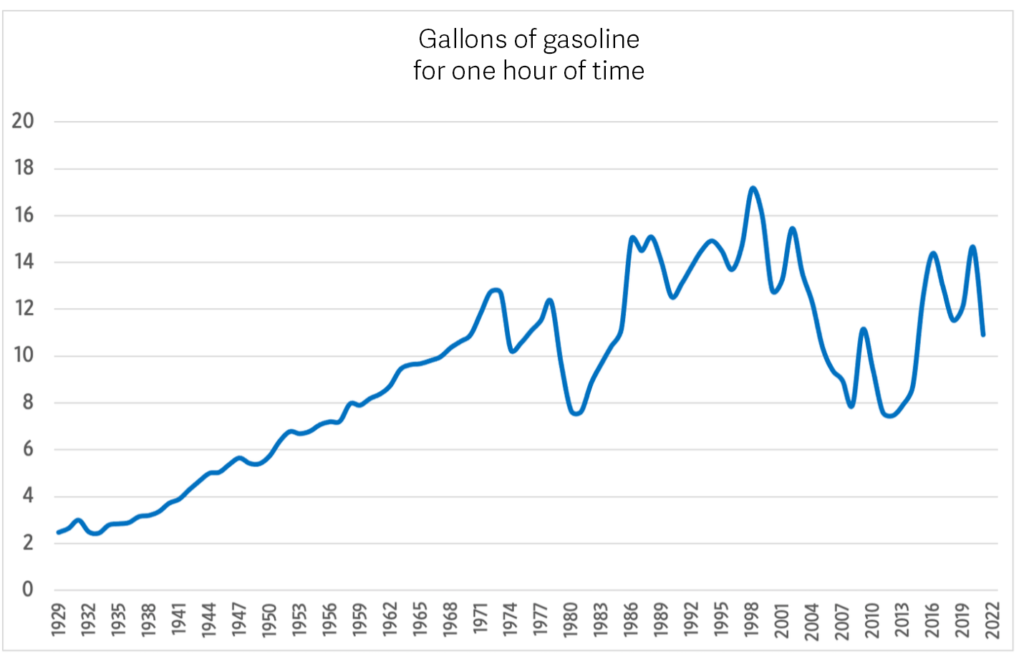
In 1929 one hour of time would get you around 2.5 gallons. By 1973, gasoline abundance had increased 410 percent, to 12.75 gallons per hour. Then the Organization of the Petroleum Exporting Countries (OPEC) cartel raised prices dramatically, so that by 1981 one hour would only get you 7.63 gallons of gasoline. Once OPEC lost its control of oil the trend reversed. By 1998 the number of gallons per hour was up to 17.15, the highest rate on record. World events reversed the trend again, and by 2012 it was back down to 7.46 gallons per hour, lower than what it had been in 1981. We then climbed out of this trough and were back up to 14.66 GPH in 2020. The COVID-19 policies have knocked us off course over the last two years, but the underlying fundamentals of economics suggest that we will recover and move back to around 12 gallons per hour, which is the average over the last 50 years.

Curiosities | Cost of Living

The Real Reasons Your Appliances Die Young

“Many people have a memory of some ancient, avocado-green washing machine or refrigerator chugging along for decades at their grandparents’ house. But even then, decade-spanning durability was uncommon.

Although I couldn’t find a ton of hard data on appliance lifespan over the past 40 years, nearly everyone I spoke with — service technicians, designers, engineers, trade-organization representatives, salespeople — said that kind of longevity was always the outlier, not the norm.

‘Everybody talks about the Maytag washing machine that lasts 50 years,’ said Daniel Conrad, a former product engineer at Whirlpool Corporation who is now the director of design quality, reliability, and testing for a commercial-refrigeration company. ‘No one talks about the other 4.5 million that didn’t last that long.'”

From New York Times.

Buenos Aires Times | Macroeconomic Environment

Inflation in Buenos Aires City Slows to Monthly 1.6 Percent

“Consumer prices in Buenos Aires City rose 1.6 percent in May, lower than the expectations of most analysts and a slowdown from the previous month.

The news will be welcomed by President Javier Milei’s national government, which is awaiting the publishing of the INDEC national statistics bureau’s national figure later this week.

According to data from the Buenos Aires City Statistics Office, prices in the capital were up 1.6 percent, down from the 2.3 percent recorded in April. Most private consultancy firms expected a rate of around two percent.

Inflation so far this year in the capital totals 12.9 percent – a massive drop on the 48.3 percent recorded over the same period in 2024.”

From Buenos Aires Times.

Curiosities | Trade

The Real Story of the “China Shock”

“The total number of jobs remained largely stable in the U.S.—and even slightly increased—as people adapted to competition from Chinese trade. Trade-exposed places recovered after 2010, primarily by adding young-adult workers, foreign-born immigrants, women and the college-educated to service-sector jobs.

Lost in the alarm over jobs is that trade with China delivered substantial benefits to the U.S. economy. Most obvious are the lower prices Americans pay for everything from clothing and electronics to furniture. One study found that a 1 percentage point increase in imports from China led to about a 1.9% drop in consumer prices in the U.S. For every factory job lost to Chinese competition, American consumers in aggregate gained an estimated $411,000 in consumer welfare. This so-called Walmart effect disproportionately helped middle- and lower-income families, who spend a bigger share of their budget on the kinds of cheap goods China excels at producing.

U.S. businesses also reaped advantages. Manufacturers who use imported parts or materials benefited from cheaper inputs, making them more competitive globally. An American appliance company, for example, could buy low-cost Chinese components to lower its production costs, keep its product prices down and potentially hire more workers.”

From Wall Street Journal.

Curiosities | Cost of Services

Service Costs Aren’t Exploding Anymore

“The trend of increasing service costs defined many of our economic debates for a decade. There was just one small problem — by the time we started talking about how to address this trend, the trend had changed…

Until around 1990, health spending rapidly ate up a bigger and bigger portion of our national income. Then the increase slowed down, but it did go up some more until around 2009. But after that, it leveled off; in 2024, Americans didn’t spend a greater percent of their income on health care than they did in 2009…

Higher education has been getting more affordable for years, and the decrease in affordability in the late 2000s and 2010s was significantly overstated. The popular narrative that college is getting less and less affordable is wrong…

These changing trends don’t mean that services are cheap and we can stop thinking about service costs. First of all, there are still some services that are getting less affordable over time — most notably, child care. Second, the recent mild increases in affordability for health care and higher education haven’t erased the big cost increases that happened in the 1980s, 1990s, and early 2000s; Americans still pay a lot more for these things than Europeans or Asians do, relative to their incomes. So there’s still probably scope to bring down the costs of health care and college.

But with all that said, the change in the trends in service costs and service productivity mean that our debates about these topics need to change.”

From Noahpinion.