fbpx
01 / 05
Are Gas Prices Really the Highest in History?

Blog Post | Energy Prices

Are Gas Prices Really the Highest in History?

The time price is the true price. It's gallons per hour that count.

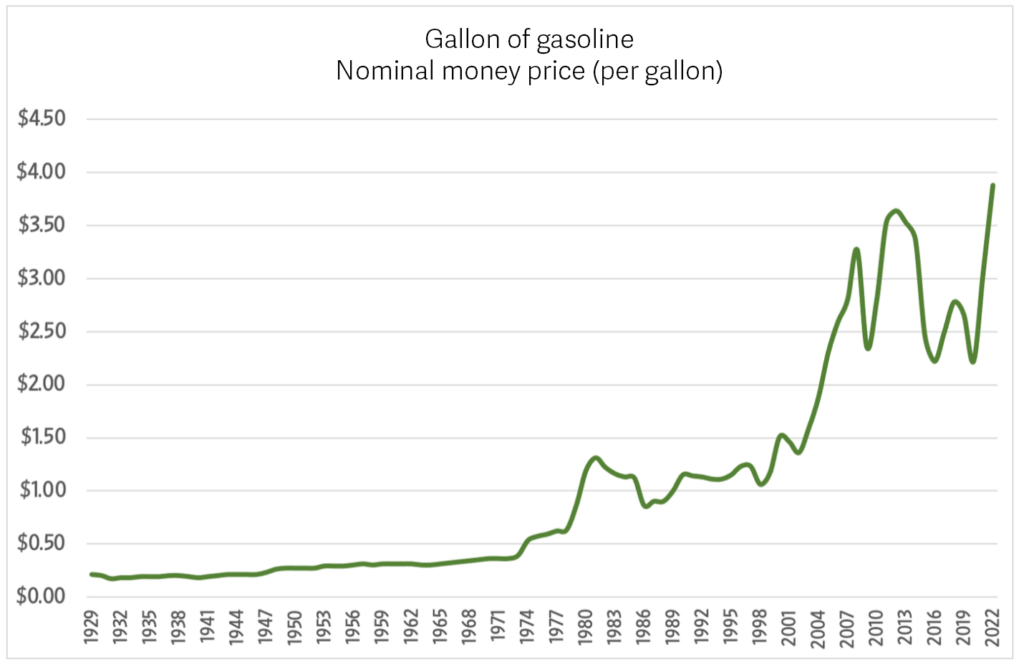
USA Today recently reported that gas prices are the most expensive that they’ve been in U.S. history, breaking the record from 2008. The U.S. Energy Information Administration notes that the average price of a gallon of gasoline reached $4.22 in April 2022, the highest nominal price ever and 16 cents higher than the previous record of $4.06 in July 2008.

But does the nominal money price really reveal the true price? Since we buy things with money, but we pay for them with our time, there are actually two prices: money prices and time prices. Money prices are expressed in dollars and cents, while time prices are expressed in hours and minutes. Converting a money price to a time price is simple. Divide the money price of a product or service by hourly income. As long as hourly income increases faster than the money price, the time price will decrease.

To calculate the time price of a gallon of gasoline we divided the nominal money price by nominal blue-collar hourly compensation (wages and benefits) as reported by the economic data website measuringworth.com. When we look at the time price of a gallon of gasoline, we see a much different story.

In 1929 it took about 24 minutes to earn the money to buy one gallon of gasoline. Today the time price is closer to 6 minutes. The time price of gasoline has dropped by 75 percent. For the time it took to earn the money to buy one gallon in 1929, you can buy four gallons today. Gasoline abundance has increased by 300 percent. This occurred while the global population increased 290 percent, from 2 billion to 7.8 billion. The greater the population, the more abundant gasoline has become.

Another interesting way to think about the time price of a resource is to consider how many gallons of gasoline one hour of time would buy. Call this gallons per hour or GPH. This ratio reveals how much abundance is changing over time.

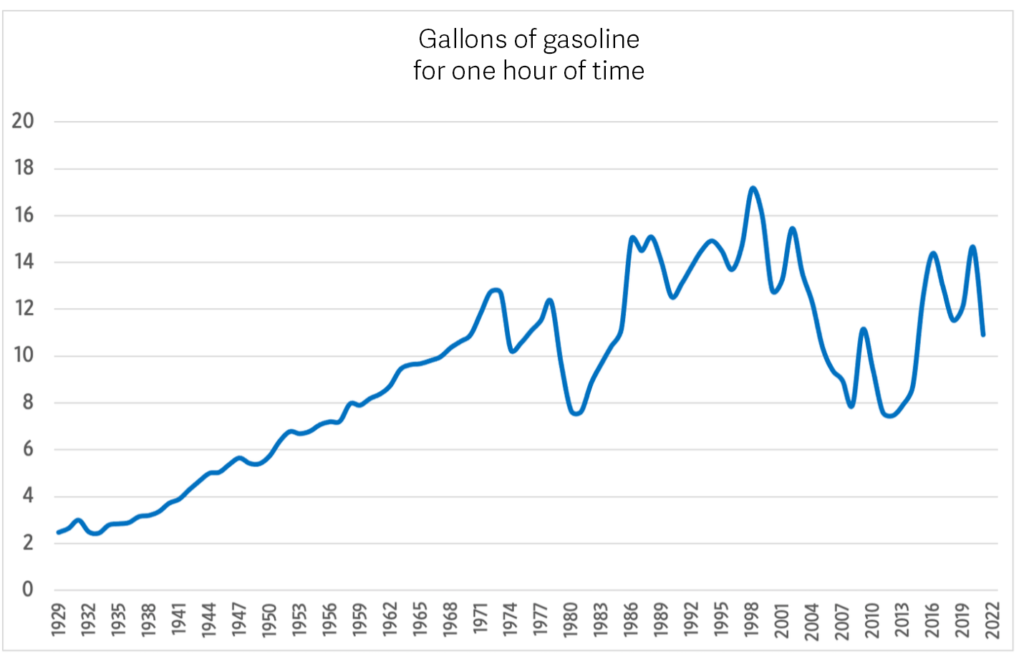
In 1929 one hour of time would get you around 2.5 gallons. By 1973, gasoline abundance had increased 410 percent, to 12.75 gallons per hour. Then the Organization of the Petroleum Exporting Countries (OPEC) cartel raised prices dramatically, so that by 1981 one hour would only get you 7.63 gallons of gasoline. Once OPEC lost its control of oil the trend reversed. By 1998 the number of gallons per hour was up to 17.15, the highest rate on record. World events reversed the trend again, and by 2012 it was back down to 7.46 gallons per hour, lower than what it had been in 1981. We then climbed out of this trough and were back up to 14.66 GPH in 2020. The COVID-19 policies have knocked us off course over the last two years, but the underlying fundamentals of economics suggest that we will recover and move back to around 12 gallons per hour, which is the average over the last 50 years.

International Labour Organization | Income Inequality

Wage Inequality Declined in Most Countries Since Start of 21st Century

“The Global Wage Report 2024-25 finds that since the early 2000’s, on average, wage inequality, which compares the wages of high and low wage earners, decreased in many countries at an average rate that ranged from 0.5 to 1.7 per cent annually, depending on the measure used. The most significant decreases occurred among low-income countries where the average annual decrease ranged from 3.2 to 9.6 per cent in the past two decades. 

Wage inequality is declining at a slower pace in wealthier countries, shrinking annually between 0.3 and 1.3 per cent in upper-middle-income-countries, and between 0.3 to 0.7 per cent in high-income countries”

From International Labour Organization.

World Bank | Income & Inequality

Remittances to Poor Countries Reached $685 Billion in 2024

“Officially recorded remittances to low- and middle-income countries (LMICs) are expected to reach $685 billion in 2024. The true size of remittances, including flows through informal channels, is also believed to be even larger. The growth rate of remittances in 2024 is estimated to be 5.8 percent, significantly higher than 1.2 percent registered in 2023…

It is notable that remittances have continued to outpace other types of external financial flows to low- and middle-income countries. Remittances have even surpassed FDI significantly (figure 5). The gap between remittances and FDI is expected to widen further in 2024.”

From World Bank.

Blog Post | Food Prices

Thanksgiving Dinner Will Be 8.8 Percent Cheaper This Year

Be thankful for the increase in human knowledge that transforms atoms into valuable resources.

Summary: There has been a remarkable decrease in the “time price” of a Thanksgiving dinner over the past 38 years, despite nominal cost increases. Thanks to rising wages and innovation, the time required for a blue-collar worker to afford the meal dropped significantly, making food much more abundant. Population growth and human knowledge drive resource abundance, allowing for greater prosperity and efficiency in providing for more people.


Since 1986, the American Farm Bureau Federation (AFBF) has conducted an annual price survey of food items that make up in a typical Thanksgiving Day dinner. The items on this shopping list are intended to feed a group of 10 people, with plenty of leftovers remaining. The list includes a turkey, a pumpkin pie mix, milk, a vegetable tray, bread rolls, pie shells, green peas, fresh cranberries, whipping cream, cubed stuffing, sweet potatoes, and several miscellaneous ingredients.

So, what has happened to the price of a Thanksgiving Day dinner over the past 38 years? The AFBF reports that in nominal terms, the cost rose from $28.74 in 1986 to $58.08 in 2024. That’s an increase of 102.1 percent.

Since we buy things with money but pay for them with time, we should analyze the cost of a Thanksgiving Day dinner using time prices. To calculate the time price, we divide the nominal price of the meal by the nominal wage rate. That gives us the number of work hours required to earn enough money to feed those 10 guests.

According to the Bureau of Labor Statistics, the blue-collar hourly wage rate increased by 240.2 percent – from $8.96 per hour in October 1986 to $30.48 in October 2024.

Remember that when wages increase faster than prices, time prices decrease. Consequently, we can say that between 1986 and 2024 the time price of the Thanksgiving dinner for a blue-collar worker declined from 3.2 hours to 1.9 hours, or 40.6 percent.

That means that blue-collar workers can buy 1.68 Thanksgiving Day dinners in 2024 for the same number of hours it took to buy one dinner in 1986. We can also say that Thanksgiving dinner became 68 percent more abundant.

Here is a chart showing the time price trend for the Thanksgiving dinner over the past 38 years:

The figure shows that the time price of a Thanksgiving dinner for a blue collar worker has gone down since 1986.
The figure shows that the time price of a Thanksgiving meal has decreased, while population, the nominal price of the meal, and hourly earnings have all increased.

The lowest time price for the Thanksgiving dinner was 1.87 hours in 2020, but then COVID-19 policies struck, and the time price jumped to 2.29 hours in 2022.

In 2023, the time price of the Thanksgiving dinner came to 2.09 hours. This year, it came to 1.91 hours – a decline of 8.8 percent. For the time it took to buy Thanksgiving dinner last year, we get 9.6 percent more food this year.

Between 1986 and 2024, the US population rose from 240 million to 337 million – a 40.4 percent increase. Over the same period, the Thanksgiving dinner time price decreased by 40.6 percent. Each one percentage point increase in population corresponded to a one percentage point decrease in the time price.

To get a sense of the relationship between food prices and population growth, imagine providing a Thanksgiving Day dinner for everyone in the United States. If the whole of the United States had consisted of blue-collar workers in 1986, the total Thanksgiving dinner time price would have been 77 million hours. By 2024, the time price fell to 64.2 million hours – a decline of 12.8 million hours or 16.6 percent.

Given that the population of the United States increased by 40.4 percent between 1986 and 2024, we can confidently say that more people truly make resources much more abundant.

An earlier version of this article was published at Gale Winds on 11/21/2024.