fbpx
01 / 05
2016: Year of the 1% or that Poverty Fell to a New Low?

Blog Post | Economic Growth

2016: Year of the 1% or that Poverty Fell to a New Low?

How can both of these seemingly conflicting graphs be accurate?

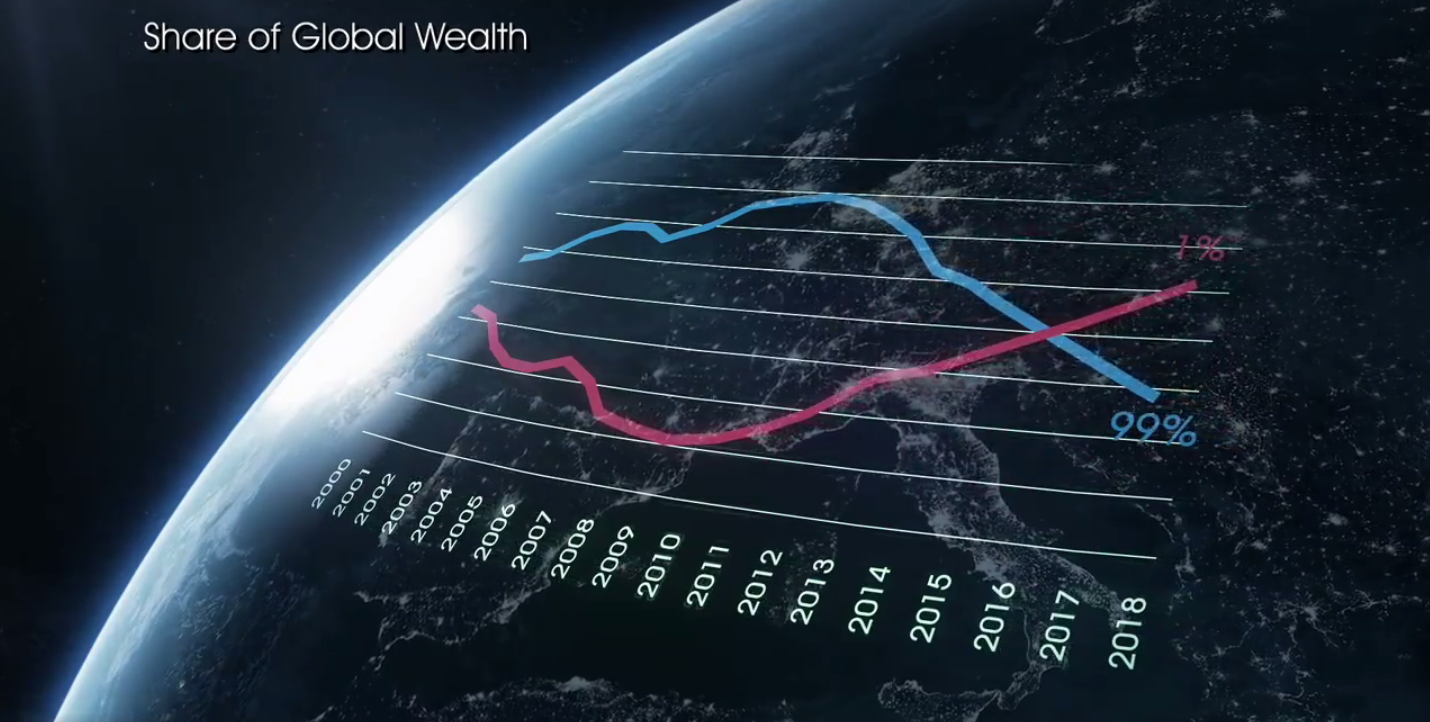
This past weekend, The Economist uploaded and shared a short video to its Facebook page called, “The year of the 1 percent.” The video shows a graph superimposed over the Earth seen from space, while a voice narrates, “2016 is set to be a more unequal world than ever before. For the first time, the richest 1 percent of the population will enjoy a greater share of global wealth than the other 99 percent.” The video has been viewed more than one hundred thousand times.

The Economist’s graph reminded me of another graph, which also shows two lines that eventually cross but tells a very different story. Despite population growth, there are fewer people living in extreme poverty today than ever before:

label

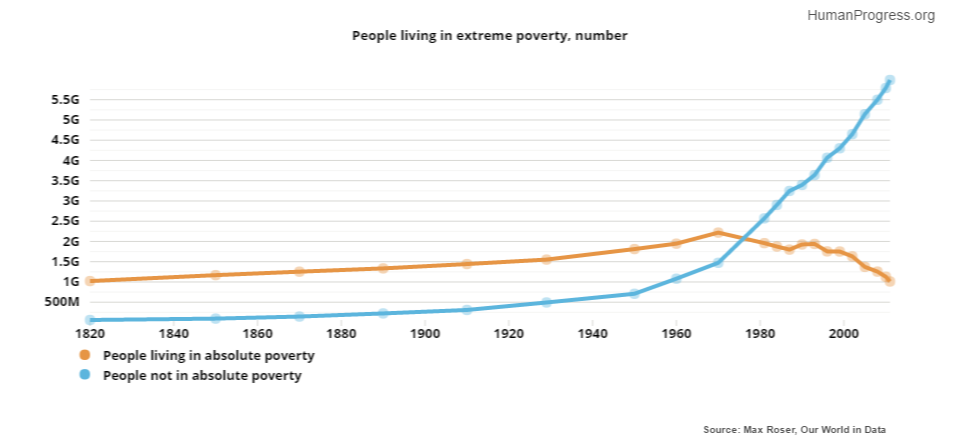
How can both graphs be accurate? Poverty can decline even as inequality rises, as long as the total amount of wealth in the world is growing. To ignore this is to fall prey to the “fixed pie fallacy.” Throughout most of human history, global wealth hardly changed. But thanks to trade and industrialization, wealth has skyrocketed since the 1900s and continues to climb. At the same time, technological advances have also increased human wellbeing in ways not captured by looking at GDP alone.

label

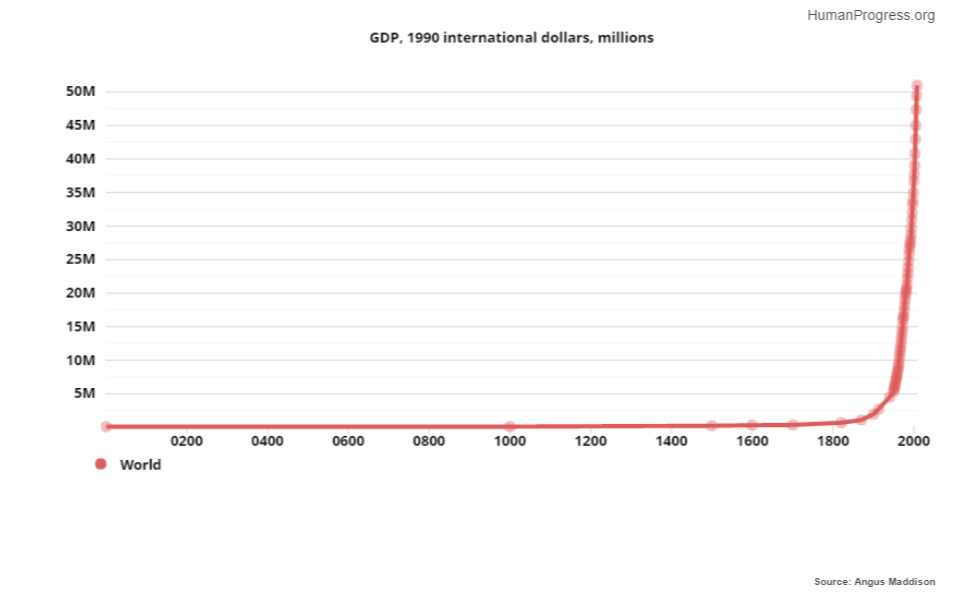
Because the pie is growing, focusing solely on inequality, like The Economist’s video did, makes little sense. Most of us would rather have a relatively small slice of a gigantic pie than the biggest slice of a microscopic pie. In other words, most of us would rather be wealthier in absolute terms, regardless of our relative position. This is why many of us, if given the choice, would choose to be an ordinary person today instead of a member of the upper crust a century ago or a 17th century king.

This first appeared in Cato at Liberty.

S&P Global | Energy & Natural Resources

US DOE Finalizes Rules to Speed Transmission Permitting

“Under the program, the DOE will coordinate efforts across eight other agencies to prepare a single environmental review document for transmission developers seeking federal approvals. The program also establishes a two-year timeline for the permitting process.

‘The CITAP program gives transmission developers a new option for a more efficient review process, a major step to provide increased confidence for the sector to invest in new transmission lines,’ the DOE said in a fact sheet.

A second final rule creates a categorical exclusion — the simplest form of review under the National Environmental Policy Act — for transmission projects that use existing rights of way, such as reconductoring projects, as well as solar and energy storage projects on already disturbed lands.”

From S&P Global.

Washington Post | Health & Medical Care

FDA Authorizes AI-Driven Test to Predict Sepsis in Hospitals

“Bobby Reddy Jr. roamed a hospital as he built his start-up, observing how patient care began with a diagnosis and followed a set protocol. The electrical engineer thought he knew a better way: an artificial intelligence tool that would individualize treatment.

Now, the Food and Drug Administration has greenlighted such a test developed by Reddy’s company, Chicago-based Prenosis, to predict the risk of sepsis — a complex condition that contributes to at least 350,000 deaths a year in the United States. It is the first algorithmic, AI-driven diagnostic tool for sepsis to receive the FDA’s go-ahead.”

From Washington Post.

BBC | Conservation & Biodiversity

How AI is being used to prevent illegal fishing

“Global Fishing Watch was co-founded by Google, marine conservation body Oceana, and environmental group SkyTruth. The latter studies satellite images to spot environmental damage.

To try to better monitor and quantify the problem of overfishing, Global Fishing Watch is now using increasingly sophisticated AI software, and satellite imagery, to globally map the movements of more than 65,000 commercial fishing vessels, both those with – and without – AIS.

The AI analyses millions of gigabytes of satellite imagery to detect vessels and offshore infrastructure. It then looks at publicly accessible data from ships’ AIS signals, and combines this with radar and optical imagery to identify vessels that fail to broadcast their positions.”

From BBC.