fbpx
01 / 05
The Counter-Intuitive Truth About the World's Resources

Blog Post | Adoption of Technology

The Counter-Intuitive Truth About the World's Resources

What matters is not the world's limited resources, but the endless possibilities devised by human ingenuity.

An oil refinery at night.

Are we running out of resources? That’s been a hotly debated question since the publication of Paul Ehrlich’s The Population Bomb in 1968. The Stanford University biologist warned that population growth would result in the exhaustion of resources and a global catastrophe. According to Ehrlich, “The battle to feed all of humanity is over. In the 1970s hundreds of millions of people will starve to death in spite of any crash programs embarked upon now. At this late date nothing can prevent a substantial increase in the world death rate”.

The University of Maryland economist Julian Simon rejected Ehrlich’s thesis. In his 1981 book The Ultimate Resource, he argued that humans were intelligent beings, capable of innovating their way out of shortages through greater efficiency, increased supply, or development of substitutes. He wrote: “There is no physical or economic reason why human resourcefulness and enterprise cannot forever continue to respond to impending shortages and existing problems with new expedients that, after an adjustment period, leave us better off than before the problem arose.”

A just-released paper, which I co-authored with Brigham Young University economics professor Gale Pooley, revisits the Ehrlich-Simon debate. In The Simon Abundance Index: A New Way to Measure Availability of Resources, we look at prices of 50 foundational commodities covering energy, food, materials and metals. Our findings confirm Simon’s thesis. Between 1980 and 2017, the world’s population increased from 4.46 to 7.55 billion or 69 per cent. Yet resources have become substantially more abundant.

To arrive at our conclusion, we introduce four new ways of measuring abundance of resources. Ehrlich and Simon looked at inflation adjusted prices of commodities. By our count, those fell by 36 per cent. Taking that analysis a step further, we have come up with a “time-price” of commodities, which allows us to cost resources in terms of human labour. We find that relative to the average global hourly income, commodity prices fell by 64.7 per cent between 1980 and 2017.

Second, the price elasticity of population (PEP) allows us to measure sensitivity of resource availability to population growth. We find that the time-price of commodities declined by 0.934 per cent for every 1 per cent increase in the world’s population. Put differently, over the last 37 years, every additional human being born on our planet appears to have made resources proportionately more plentiful for the rest of us.

Third, we develop the Simon Abundance Framework, which uses the PEP values to distinguish between different degrees of resource abundance, from decreasing abundance at the one end to super abundance at the other end. Considering that the time-price of commodities decreased at a faster proportional rate than population increased, we find that humanity is experiencing super abundance.

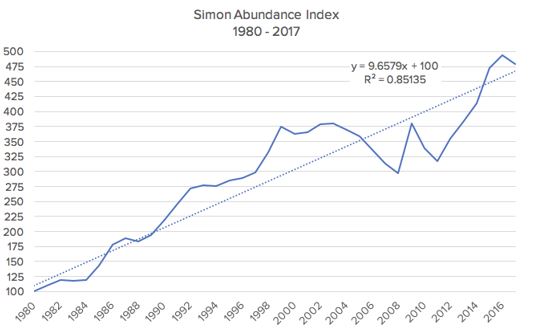
Finally, we create the Simon Abundance Index (SAI), which uses the time-price of commodities and change in global population to estimate overall resource abundance. The SAI represents the ratio of the change in population over the change in the time-price, times 100. It has a base year of 1980 and a base value of 100. Between 1980 and 2017, resource availability increased at a compounded annual growth rate of 4.32 percent. That means that the Earth was 379.6 percent more plentiful in 2017 than it was in 1980.

Based on our analysis of the relationship between resource availability and population growth, we forecast that the time-price of commodities could fall by a further 29 per cent over the next 37 years. Of course, much will depend on policies and institutions that nations pursue. For time-price of commodities to decline and resource abundance to increase, it is necessary for market incentives and price mechanism to endure. For it is when prices of commodities temporarily increase that people have an incentive to use resources more efficiently, increase their supply and develop cheaper substitutes.

Simon’s revolutionary insights with regard to the mutually beneficial interaction between population growth and availability of natural resources, which our research confirms, may be counterintuitive, but they are real.

The world’s resources are finite in the same way that the number of piano keys is finite. The instrument has only 88 notes, but those can be played in an infinite variety of ways. The same applies to our planet. The Earth’s atoms may be fixed, but the possible combinations of those atoms are infinite. What matters, then, is not the physical limits of our planet, but human freedom to experiment and reimagine the use of resources that we have.

This first appeared in CapX.

Blog Post | Cost of Material Goods

The Rise of Contact Lens Abundance

Get almost 16 today for the time price of one in 1971.

Summary: Since the introduction of the first US commercial soft contact lenses, significant advancements have made them more accessible and affordable. This progress in abundance, driven by continuous innovation, underscores the importance of fostering an environment conducive to scientific and entrepreneurial advancements for the prosperity of society.


In 1971, Bausch & Lomb manufactured the first US commercial soft contact lenses. An eye doctor fitting ran around $550, and a pair of contact lenses cost $65, putting total costs around $615. Unskilled workers at the time earned about $2 an hour. This means the time price was about 307.5 hours.

Today an eye exam is about $120, and lenses start at $200 for a 12-month supply, putting the cost at $320. Unskilled workers now earn about $16.51 an hour, indicating a time price of 19.4 hours.

Unskilled workers can now get 15.9 sets of contact lenses for the time price of one set in 1971. Abundance has been growing at a compound annual rate of 5.35 percent, doubling in abundance every 13.3 years.

Today an estimated 45 million Americans wear contact lenses, of which 30 million are women. Imagine if the manufacturers of eyeglasses had used government regulation and coercion to prevent the innovation of contact lenses?

The more we make of something, the more we learn. The more we learn, the lower the price. The lower the price, the higher our standard of living. This truth was described by Adam Smith in 1776 in The Wealth of Nations.

And what is wealth? As George Gilder notes, “Wealth is knowledge and growth is learning.” The nation that is best at growing new knowledge will enjoy the greatest wealth. Artificial intelligence offers the hope that this learning process can be dramatically enhanced.

We can thank the continuous innovations of scientists and entrepreneurs in developing new contact lens designs and manufacturing techniques. America’s comparative advantage has been its visionary leadership in encouraging everyone in discovering and creating valuable new knowledge that can be shared in free markets. We cannot allow fear to blind us to these truths and prevent a future of innovation and greater prosperity.

This article was published at Gale Winds on 3/12/2024.

Blog Post | Cost of Material Goods

The Good Old Days Were Really Expensive

Most things are more abundant and affordable today.

If you had a dime in 1900, you could buy a 1-ounce Hershey chocolate bar and a 6.5-ounce bottle of Coca-Cola. It sounds like those were happy days indeed. That is until you look at wages, which were around 14 cents an hour for blue-collar workers.

At Walmart today, a 1.55-ounce Hershey bar costs $1.17 and a 1.25-liter bottle (42.27 ounces) of Coke is $1.52. Blue-collar workers earn closer to $36.15 an hour in compensation.

We buy things with money but pay for them with our time. Money prices are expressed in dollars and cents, while time prices are expressed in hours and minutes. A time price is simply the money price divided by hourly income.

In 1900, it took more than 21.4 minutes to earn an ounce of chocolate and 3.3 minutes for an ounce of Coca-Cola. By 2023, the chocolate time price had fallen to 1.25 minutes, and sodas were down to 0.06 minutes (3.58 seconds).

Chocolate cost fell 94.2 percent while cola cost fell 98.2 percent. For the time required to earn 1 ounce of chocolate in 1900, you get 17.1 ounces today, and for the time required to earn 1 ounce of Coca-Cola in 1900, you get 55.2 ounces today. Chocolate is 1,611 percent more abundant while cola is 5,425 percent more abundant.

Things can get more expensive and more affordable at the same time. This is why you must always compare prices to wages to see the true price, which is how much time things cost you.

This article was published at Gale Winds on 3/19/2024.

Blog Post | Energy Prices

Where Is Gasoline the Most Affordable?

Remember that it’s the time price, not the money price, that counts.

Summary: The affordability of gasoline varies significantly worldwide due to varying taxes and subsidies. Analyzing the GDP per hour worked against the money price per gallon shows that the United States emerges as the most affordable country for purchasing gasoline, even compared to nations where gasoline prices are heavily subsidized by the government.


According to GlobalPetrolPrices.com, the average price of gasoline around the world is USD5.03 per gallon. However, there is substantial difference in these prices among countries due to the various taxes and subsidies for gasoline. All countries have access to the same petroleum prices of international markets, but countries do not all impose the same taxes. As a result, the retail price of gasoline varies significantly.

Graph displays the gasoline price per gallon in US dollars in various countries

The money price of 16 selected countries ranges from $2.26 in Russia to $8.55 in Denmark. But what about the time price? To calculate the time price, we first calculated the GDP per hour worked in each country. The data to calculate this ratio come from the World Bank and the Conference Board.

Graph displays the GDP per hour worked in various countries

We then divided GDP per hour worked by the money price per gallon. This gave us the gallons of gasoline that one hour of work would buy in each country:

Graph displays the gallons of gasoline per GDP per hour worked in various countries

We also divided the nominal price per gallon by GDP per hour worked to get the minutes required per gallon:

This chart illustrates how much more expensive relative to the US the other 15 countries are in terms of time price:

Chart displays the cost in time price of gasoline in 15 countries

Of the 16 countries analyzed, the US is by far the most affordable place to buy gasoline. There are other countries where gasoline is more affordable, but the gasoline price in those countries is heavily subsidized by government.

Tip of the Hat: Jeremy Horpendahl

This article was published at Gale Winds on 4/1/2024.

Blog Post | Air Transport

Flying Abundance (And Safety) Has Increased Dramatically

Get 10.8 flights from New York to London today for the time price of one in 1970 and be 80.4 times safer.

Summary: Since the Wright brothers’ pioneering flight in 1903, the aviation industry has made remarkable strides in safety, affordability, and accessibility. Comparing flight prices from 1970 to today reveals a staggering 90.8 percent decrease in the time price of flying, with transcontinental flights now affordable for the average person. Additionally, advancements in aviation technology have made flying dramatically safer today than it was in 1970, and are likely to improve flying safety in the future.


The Wright brothers launched the era of aviation on December 17, 1903, with a 12-second flight. Since then, aeronautical engineers and market innovators have made the experience safer, faster, and much more affordable.

For example, in 1970 the price for a roundtrip ticket from New York to London was $550. Blue-collar workers at the time were earning around $3.93 an hour in compensation (wages and benefits). This suggests a time price of around 140 hours.

Today, the ticket price has dropped to around $467. Blue-collar workers are now earning closer to $36.15 an hour, putting the time price at 12.9 hours. The time price has fallen by 90.8 percent: for the time required to earn the money to buy one flight in 1970, you can get 10.8 flights today.

Flying abundance has increased by 980 percent, compounding at an annual rate of 4.5 percent over the last 54 years. During this same period the global population increased by 4.3 billion (117 percent), from 3.7 billion to more than 8 billion. Every 1 percentage point increase in population corresponded to an 8.4 percentage point increase in flying abundance.

Now transcontinental flights are affordable for almost everyone. Free-market entrepreneurial capitalism isn’t about making more luxuries for the wealthy, it’s about making luxuries affordable for the average person.

While it is true that the 1970s flights may have had roomier cabins and better dining, flying today is dramatically safer. The Aviation Safety Network tracks airline accident data. Revenue passenger kilometer (RPK) is a standard metric used in aviation. Using this data, Javier Mediavilla plotted the ratio of fatalities per trillion RPK from 1970 to 2019 using five-year averages. The ratio decreased by 98.76 percent, from 3,218 to 40, during this 49-year range. Flying is more than 80.4 times safer today than in 1970, and safety has been improving at a compound rate of around 9.37 percent a year.

Considering both the time price and safety, flying has become 868 times more abundant since 1970 (10.8 x 80.4 = 868). If there had been no innovation in flying since 1970,  New York to London airfare would be around $5,059 today. Only the rich could afford transatlantic flights in 1970.

The 3,442-mile flight takes around seven hours. The supersonic Concorde could fly it in less than three. While there are no commercial supersonic flights available today, Boom Supersonic, a private company based in Colorado, aims to bring them back to US airlines by 2029. Perhaps spending half as much time on flights will allow people to use their most valuable resource for other value-creating activities.

This article was published at Gale Winds on 3/26/2024.