fbpx
01 / 05
Improvements in Human Well-Being in the New Millennium

Blog Post | Economic Growth

Improvements in Human Well-Being in the New Millennium

Humanity's gains in the 21st century are a cause for considerable optimism.

The story of humanity over the course of the last two centuries is nothing short of remarkable. As late as 1870, life expectancy in Europe and the world was 36 and 30 years, respectively. Today, it is 81 and 72 years, respectively. In 1820, 90 percent of humanity lived in extreme poverty. Today, less than 10 percent does. In 1800, 88 percent of the world’s population was illiterate. Today, 13 percent of the world’s population is illiterate. In 1800, 43 percent of children died before their fifth birthday. Today, less than 4 percent do. In 1816, 0.87 percent of the world’s population lived in a democracy. In 2015, 56 percent did. In 1800, food supply per person per day in France, which was one of the most advanced countries in the world, was a mere 1,846 calories. In 2013, food supply per person per day in Africa, the world’s poorest continent, amounted to 2,624 calories. Slavery, which was rampant in most parts of the world in 1800, is now illegal in every country. Finally, for the first time since the start of industrialization in the mid-18th century, global inequality is declining as developing countries catch up with the developed world.

The long-term trends in human welfare are undeniable, but indicators of human well-being have continued to improve at a dizzying speed within the lifespans of the teenagers in the West, many of whom are either ignorant of the real state of humanity or dissatisfied with the speed of progress. Opinion polls indicate that they have soured on free enterprise and are answering the siren calls of such socialists as Jeremy Corbyn in the United Kingdom and Alexandria Ocasio-Cortez in the United States. The hearts of the young are in the right place, but that does not absolve them of not knowing the facts. After all, if they want to change the world, they need to know something about it. To that end, I have looked at some of the most important indicators of human wellbeing, especially in the poor countries, since the start of the new millennium. The results are encouraging and ought to give us reasons for optimism.

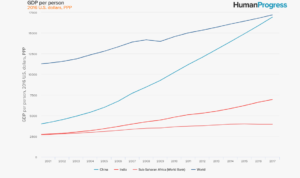
1. GDP per person, 2016 U.S. dollars, PPP, 2001-2017

Global: $11,347 → $17,196 (or a 52 percent increase)

Sub-Saharan Africa (SSA): $2,698 → $3,948 (or a 46 percent increase)

India: $2,773 → $6,950 (or a 78 percent increase)

China: $4,147 → $16,924 (or a 308 percent increase)
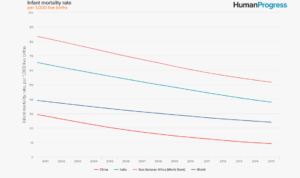
2. Infant mortality rate, per 1,000 live births, 2001-2015

Global: 38.4 → 23.9 (or a 38 percent decline)

SSA: 82.2 → 51.7 (or a 37 percent decline)

India: 64.2 → 37.9 (or a 41 percent decline)

China: 28.3 → 9.2 (or a 68 percent decline)
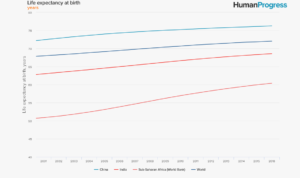
3. Life expectancy at birth, years, 2001-2016

Global: 67.9 → 72 (or a 6 percent increase)

SSA: 50.9 → 60.4 (or a 19 percent increase)

India: 62.9 → 68.6 (or a 9 percent increase)

China: 72.4 → 76.3 (or a 5 percent increase)
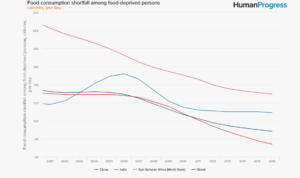
4. Food consumption shortfall among food-deprived persons, calories, per day, 2001-2016*

Global: 132.3 → 88.3 (or a 33 percent decline)

SSA: 202.7 → 129.6 (or a 39 percent decline)

India: 118 → 109 (or a 8 percent decline)

China: 130 → 74 (or a 43 percent decline)
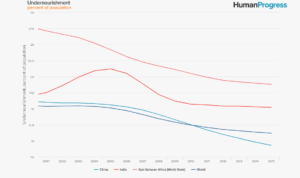
5. Undernourishment as a percentage of population, 2001-2015

Global: 15.4 → 11.2 (or a 27 percent decline)

SSA: 27 → 18.8 (or a 30 percent decline)

India: 17.5 → 15.2 (or a 15 percent decline)

China: 16 → 9.3 (or a 42 percent decline)
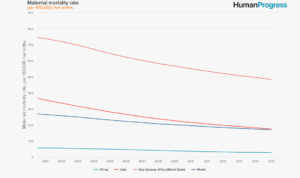
6. Maternal mortality rate, per 100,000 live births, 2001-2015

Global: 263.9 → 168.7 (or a 36 percent decline)

SSA: 736.9 → 481.9 (or a 35 percent decline)

India: 354 → 174 (or a 59 percent decline)

China: 56 → 27 (or a 52 percent decline)
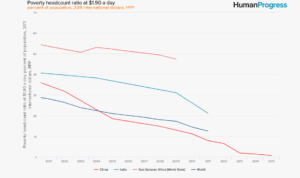
7. Poverty headcount ratio at $1.90 a day, adjusted for inflation and PPP, percent of population, 2001-2015

Global (2011): 28 → 12.5 (or a 55 percent decline)

SSA (2009): 53.5 → 47.3 (or a 12 percent decline)

India (2011): 40 → 21 (or a 48 percent decline)

China (2015): 34.5 → .7 (or a 98 percent decline)
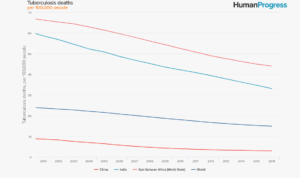
8. Tuberculosis deaths per 100,000 people, 2001-2016

Global: 23.6 → 15 (or a 36 percent decline)

SSA: 66 → 44 (or a 33 percent decline)

India: 58.6 → 33 (or a 44 percent decline)

China: 8.6 → 2.9 (or a 66 percent decline)
The world is not a perfect place and never will be. As long as there are people who go hungry or die from preventable diseases, there will always be room for improvement. Everyone has a role to play in helping those in need. Genuine help, however, should start with a clear understanding of what works and what does not. Free societies characterized by the rule of law, property rights, domestic competition and free trade have a much better record of tackling human misery than their socialist alternatives. The young followers of Corbyn and Ocasio-Cortez should, therefore, keep the Hippocratic Oath in mind: If you want to help, first do no harm.

*The depth of the food deficit indicates how many calories would be needed to lift the undernourished from their status, everything else being constant. The average intensity of food deprivation of the undernourished, estimated as the difference between the average dietary energy requirement and the average dietary energy consumption of the undernourished population (food-deprived), is multiplied by the number of undernourished to provide an estimate of the total food deficit in the country, which is then normalized by the total population.

This first appeared in CapX. 

Morocco World News | Population Demographics

Morocco’s Remarkable Progress in Reducing Child Mortality

“According to the report, the under-five mortality rate in Morocco has declined by an impressive 4.8 percent, dropping from 81 deaths per 1,000 live births in 1990 to 52 in 2000, and further to 17 in 2022.

The report also reveals that the infant mortality rate in Morocco has decreased from 64 deaths per 1,000 infants in 1990 to 15 deaths in 2022. Additionally, the neonatal mortality rate has declined by 3.9 percent, falling from 37 deaths per 1,000 live births in 1990 to 29 deaths in 2000, and reaching 11 in 2022.”

From Morocco World News.

Science | Vaccination

First Malaria Vaccine Slashes Early Childhood Mortality

“In a major analysis in Africa, the first vaccine approved to fight malaria cut deaths among young children by 13% over nearly 4 years, the World Health Organization (WHO) reported last week. The huge evaluation of a pilot rollout of the vaccine, called RTS,S or Mosquirix and made by GlaxoSmithKline, also showed a 22% reduction in severe malaria in kids young enough to receive a three-shot series.”

From Science.

Blog Post | Health & Medical Care

Surprisingly, the World Is Becoming More Equal

Chelsea Follett and Vincent Geloso measure the global decline in income inequality in their comprehensive new paper.

Summary: Contrary to popular belief, global inequality is shrinking across many dimensions of human well-being, including income, lifespan, nutrition, education, internet access, and political liberty. This article presents a new Inequality of Human Progress Index that measures and confirms this trend, arguing that greater global interconnectedness and market liberalization have contributed to increases in equality across the globe.


Read Chelsea Follett and Vincent Geloso’s full paper, “Global Inequality in Well‐​Being Has Decreased across Many Dimensions,” here.

Reading the news or listening to politicians and pundits speak, one could easily get the impression that global inequality is getting worse. But is the widely held belief that the world is becoming less equal true, or is it mistaken? The overwhelming majority of long‐​term trends regarding living standards—ranging from rising life expectancy to declining rates of poverty and hunger—show considerable improvement, even accounting for recent pandemic‐​related setbacks. You can explore the evidence for yourself on websites such as Human​Progress​.org. Have those improvements been widely shared, or have they accumulated mainly to a small population while much of the world is left behind?

That’s what George Mason University economist Vincent Geloso and I set out to discover. What we found is that while global inequality unquestionably still exists, it is in fact shrinking.

Our Inequality of Human Progress Index offers a new way of measuring global inequality. It is more comprehensive than any prior international inequality index, taking into account a greater number of dimensions. We found that in addition to a global decline in income inequality, there have also been declines in lifespan inequality, nutritional inequality, educational inequality, internet access inequality, and political liberty inequality. Around the world, gaps in these areas are shrinking.

Most importantly, there has been a decline in overall global inequality. That result was consistent, even under a variety of specifications that we tested. The data show that across all but two of the areas we examined, the world has become more equal since 1990. The data does not support the narrative of rising worldwide inequality.

The exceptions were infant survival inequality and clean air inequality. While infant mortality has decreased everywhere, it has fallen faster in rich countries with advanced medical technology and neonatal intensive care units. Clean air inequality has also gone up, probably because economic development often results in more pollution during industrialization before falling as a nation attains postindustrial prosperity—a tendency economists call the “environmental Kuznets curve.” Much of the world is still undergoing this transition.

Our research shows that improvements in international development have been both greater and more dispersed than many people realize. While there are still gaps, they are shrinking, and an accurate assessment of current trends is critical as we try to deepen our understanding of the drivers of human progress. The greater global interconnectedness and market liberalization of the past few decades have, it seems, not only raised absolute living standards but also equality. The world is not only better off than is commonly appreciated but also more equal.

This article was originally published at Cato.org. Read Chelsea Follett and Vincent Geloso’s full paper here.

Blog Post | Health & Medical Care

Why Are We So Gloomy?

Our evolved instincts are making us more anxious and depressed than we should be.

Summary: Many young people today are pessimistic about the future of the planet and humanity, believing that environmental degradation, poverty, violence, and inequality are getting worse. However, this gloomy outlook is not supported by the facts, which show remarkable improvements in living standards, health, education, peace, and prosperity over the last century. This article explores why people are so prone to pessimism and how to overcome it by examining the evidence of human progress.


Do you believe that the world is coming to an end? If so, you are not alone.

In 2021, researchers at the University of Bath polled 10,000 young people between the ages of 16 and 25 in Australia, Brazil, Finland, France, Great Britain, India, Nigeria, the Philippines, Portugal, and the United States. The researchers found that, on average, 83 percent of respondents thought that “people have failed to care for the planet.” Seventy-five percent thought that the “future is frightening.” Fifty-six percent thought that “humanity is doomed.” Fifty-five percent thought that they will have “less opportunity than [their] parents.” Finally, 39 percent stated that they were “hesitant to have children.”

The study remains one of the most comprehensive surveys of young people’s perception of the environmental state of the planet. But is this kind of doom warranted? The following global statistics paint an entirely different picture:

Between 1950 and 2020, the average inflation-adjusted income per person rose from $4,158 to $16,904, or 307 percent. Between 1960 and 2019, the average life expectancy, rose from 50.9 years to 72.9 years, or 43.2 percent. (Unfortunately, the pandemic reduced that number to 72.2 years.)

Between 2000 and 2020, the homicide rate fell from 6.85 per 100,000 to 5.77, or 16 percent.

Deaths from inter-state wars fell from a high of 596,000 in 1950 to a low of 49,000 in 2020, or 92 percent (though the war between Russia and Ukraine is bound to increase that number).

The rates of extreme poverty have plummeted, with the share of people living on less than $1.90 per day declining from 36 percent in 1990 to 8.7 percent in 2019. Though, once again, the pandemic has temporarily worsened that number somewhat.

Between 1969 and 2019, the average infant mortality rate per 1,000 live births fell from 89.7 to 20.9, or 77 percent.

Between 1961 and 2018, the daily supply of calories rose from 2,192 to 2,928, or 34 percent. Today, even in Africa, obesity is a growing concern.

The gross primary school enrollment rate rose from 89 percent in 1970 to 100 percent in 2018. The gross secondary school enrollment rate rose from 40 percent to 76 percent over the same period. Finally, the gross tertiary school enrollment rate rose from 9.7 percent to 38 percent.

The literacy rate among men aged 15 and older rose from 74 percent in 1975 to 90 percent in 2018. The literacy rate among women aged 15 and older rose from 56 percent in 1976 to 83 percent in 2018.

In 2018, 90 percent of women between the ages of 15 and 24 were literate. That number was almost 93 percent among men of the same age. The age-old literacy gap between the sexes has all but disappeared.

There is plenty of good news on the global environmental front as well:

The chance of a person dying in a natural catastrophe — earthquake, flood, drought, storm, wildfire, landslide or epidemic — fell by almost 99 percent over the last century.

Between 1982 and 2016, the global tree canopy cover increased by an area larger than Alaska and Montana combined.

In 2017, the World Database on Protected Areas reported that 15 percent of the planet’s land surface was covered by protected areas. That’s an area almost double the size of the U.S.

That year, marine protected areas covered nearly seven percent of the world’s oceans. That’s an area more than twice the size of South America.

There is more good news for the fish: Since 2012, more than half of all seafood consumed came from aquaculture, as opposed to the fish caught in the wild.

And while it is true that the total amount of CO2 emitted throughout the world is still rising, CO2 emissions in rich countries are falling both in totality and on a per capita basis.

With so much good news around us, why are we so gloomy? We have evolved to look out for danger. That was the best way to survive when the world was much more threatening. But, while the world has changed, our genes have not. That’s why the front pages of the newspapers are always filled with the most horrific stories. If it bleeds, it leads.

To make matters worse, the media compete with one another for a finite number of eyeballs. So, presenting stories in the most dramatic light pays dividends. Or, as one study recently found, for a headline of average length, “each additional negative word increased the click-through rate by 2.3%.” And so, in a race to the bottom, all media coverage got much darker over the last two decades.

We are literally scaring ourselves to death, with rates of anxiety, depression and even suicide rising in some parts of the world. To maintain your mental composure and to keep matters in perspective, follow the trendlines, not the headlines. You will discover that the world is in a much better shape than it appears. You will be more cheerful and, most importantly, accurately informed.

This article was originally published at RealClearPolicy on May 31st, 2023.