fbpx
01 / 05
Rural Life in the past Was a Battle for Survival

Blog Post | Economic Growth

Rural Life in the past Was a Battle for Survival

People in pre-industrial Europe generally lived a miserable, hand-to-mouth existence which would be foolish to romanticize.

In my last two pieces for CapX, I sketched out the miserable existence of our ancestors in the pre-industrial era. My focus was on life in the city, a task made easier by the fact that urban folk, thanks to higher literacy rates, have left us more detailed accounts of their lives.

This week I want to look at rural life, for that is where most people lived. At least theoretically, country folk could have enjoyed a better standard of living due to their “access to abundant commons – land, water, forests, livestock and robust systems of sharing and reciprocity,” which the anthropologist Jason Hickel praised in a recent article in The Guardian. In fact, the life of a peasant was, in some important aspects, worse than that of a city dweller.

Before industrialisation, European society was bifurcated between a small minority of the very rich and the vast majority of the very poor. Sébastien Le Prestre de Vauban, a military engineer during the reign of Louis XIV, estimated that the French population consisted of 10 per cent rich, 50 per cent very poor (fort malaise), 30 per cent near beggars and 10 per cent beggars. Likewise, Francesco Guicciardini, an Italian historian and friend of Niccolò Machiavelli, wrote that “except for a few Grandees of the Kingdom [of Spain] who live with great sumptuousness, one gathers that the others live in great poverty”.

Indeed, a census taken in the Alencon area of the Alsace region in France at the end of the 17th century found that of the 410,000 inhabitants, 48,051 were beggars. That amounts to about 12 per cent of the population. “In Brittany, of a population of 1,655,000, there were 149,325 beggars, or about 9 per cent.” Out of the English population of 5.5 million at the time of Henry VIII, 1.3 million (i.e., nearly a quarter) were described as “cottagers and paupers”. By implication, rural cottagers and urban paupers were deemed to have shared similar standard of living. The vast majority of these wretches lived in the countryside.

That was during “normal” times. As Carlo Cipolla observed in Before the Industrial Revolution: European Society and Economy 1000-1700, “in the cities the number of poor soared in the years of famine because starving peasants fled the depleted countryside and swarmed to the urban centres, where charity was more easily available and hopefully the houses of the wealthy had food in storage. Dr Tadino reported that in Milan (Italy) during the famine of 1629 in a few months the number of beggars grew from 3,554 to 9,715.” So much then for the vaunted benefits of “access to abundant commons”.

An account of rural life in 16th century Lombardy found that “the peasants live on wheat … and it seems to us that we can disregard their other expenses because it is the shortage of wheat that induces the labourers to raise their claims; their expenses for clothing and other needs are practically non-existent”. In 15th century England, 80 per cent of private expenditure went on food. Of that amount, 20 per cent was spent on bread alone.

By comparison, by 2013 only 10 per cent of private expenditure in the United States was spent on food, a figure which is itself inflated by the amount Americans spend in restaurants. For health reasons, many Americans today eschew eating bread altogether.

What about food derived from water, forests and livestock? “In pre-industrial England,” Cipolla notes, “people were convinced that vegetables ‘ingender ylle humours and be oftetymes the cause of putrid fevers,’ melancholy and flatulence. As a consequence of these ideas there was little demand for fruit and vegetables and the population lived in a prescorbutic state”. For cultural reasons, most people also avoided fresh cow’s milk, which is an excellent source of protein. Instead, the well-off preferred to pay wet nurses to suckle milk directly from their breasts.

The diet on the continent was somewhat more varied, though peasants’ standard of living was, if anything, lower than that in England. According to a 17th century account of rural living in France: “As for the poore paisant, he fareth very hardly and feedeth most upon bread and fruits, but yet he may comfort himselfe with this, and though his fare be nothing so good as the ploughmans and poore artificers in England, yet it is much better than that of the villano [peasant] in Italy.”

The pursuit of sufficient calories to survive preoccupied the crushing majority of our ancestors, including, of course, women and children. In addition to employment as domestic servants, women produced marketable commodities, such as bread, pasta, woollen garments and socks. Miniatures going back to the 14th century show women employed in agriculture as well. As late as the 18th century, an Austrian physician wrote, “In many villages [of the Austrian Empire] the dung has to be carried on human backs up high mountains and the soil has to be scraped in a crouching position; this is the reason why most of the young people [men and women] are deformed and misshapen.”

As Johan Norberg noted in Progress: Ten Reasons to Look Forward to the Future, it was common for “children to start working from seven years of age”. Their working conditions varied, but one 16th century ordnance in Lombardy found that supervisors of work in rice fields “bring together a large number of children and adolescents, against whom they practice barbarous cruelties.… [They] do not provide these poor creatures with the necessary food, and make them labour as slaves by beating them and treating them more harshly than galley slaves, so that many of the children … die miserably in the farms and neighbouring fields.”

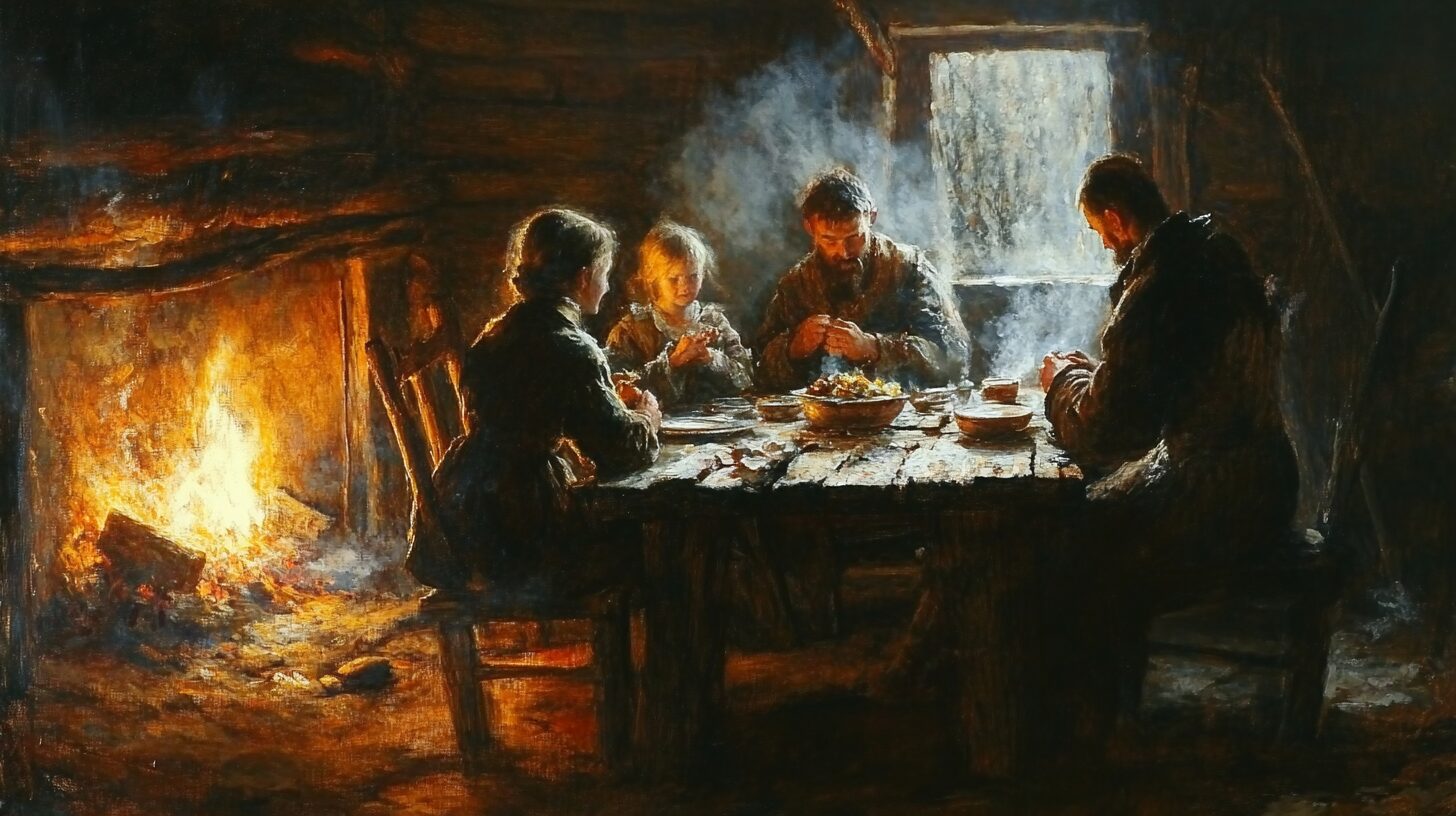
The idealised imagery of rural life portrayed by Romantic painters, philosophers and poets provides the modern reader with a highly skewed sense of reality. “We do know,” Cipolla writes, “that the mass [of the population] lived in a state of undernourishment. This gave rise, among other things, to serious forms of avitaminosis. Widespread filth was also the cause of troublesome and painful skin diseases. To this must be added in certain areas the endemic presence of malaria, or the deleterious effects of a restricted matrimonial selection, which gave rise to cretinism.”

This piece concludes a series of articles in which I have shown how contemporaneous evidence from town and country alike shows clearly that whatever their “access to abundant commons”, people in pre-industrial Europe generally lived a miserable, hand-to-mouth existence which it would be foolish to romanticize in any way.

This first appeared in CapX. 

International Labour Organization | Income Inequality

Wage Inequality Declined in Most Countries Since Start of 21st Century

“The Global Wage Report 2024-25 finds that since the early 2000’s, on average, wage inequality, which compares the wages of high and low wage earners, decreased in many countries at an average rate that ranged from 0.5 to 1.7 per cent annually, depending on the measure used. The most significant decreases occurred among low-income countries where the average annual decrease ranged from 3.2 to 9.6 per cent in the past two decades. 

Wage inequality is declining at a slower pace in wealthier countries, shrinking annually between 0.3 and 1.3 per cent in upper-middle-income-countries, and between 0.3 to 0.7 per cent in high-income countries”

From International Labour Organization.

Blog Post | Income & Inequality

Myths About American Inequality | Podcast Highlights

Chelsea Follett interviews John Early about popular misconceptions around inequality in the United States and the measurement errors behind them.

Listen to the podcast or read the full transcript here. To see the slides that accompany the interview, watch the video on YouTube or the Spotify app.

So, let’s start with your book, The Myth of American Inequality: How Government Biases Policy Debate. Why is everything that most people think they know about income, inequality, poverty, and other measures of economic well-being in America dead wrong?

In some ways, this is perhaps a somewhat boring answer about facts, but that’s what makes it important; we have to get the facts straight. The numbers that people’s opinions are based on are not correct. There are various ways in which they aren’t, but two big ones.

The first is that when the US census measures income, it doesn’t count two-thirds of what are called transfer payments, or money that the government gives to people for not doing anything. In other words, a transfer payment is not what we pay civil servants or the military. Transfer payments are things like food stamps or Medicaid, which are also two examples of things that the census does not count. They also don’t count 88 percent of the transfer payments that go to people who are classified as poor. They don’t count Medicare for the senior population. They don’t count what is called Supplemental Security Income. They don’t count many state and local transfer payments to poor people. They count some housing subsidies, the so-called Section 8 subsidies, but they don’t count others.

When you add all the pieces up, two-thirds of the total amount of transfer payments aren’t counted. So that’s one big piece.

The other big piece is they don’t adjust for taxes. At the bottom end of the income scale, people pay about seven and a half percent of their income in taxes, mostly sales taxes and excise taxes. At the upper end of the income scale, people pay between 35 and 40 percent of their income in taxes, mostly income taxes. So, if you don’t adjust for those taxes, you end up with a very skewed view of the income distribution.

The census splits US households into five groups based on income. The bottom quintile has the least income, and the top quintile has the most. Using the official census definition of income, the ratio between the top and the bottom is 16.7 to 1, so the top quintile has 16.7 times more income than the bottom.

Now, the first thing we did was ask what income was missing. Well, the first thing we found that was missing was capital gains. Capital gains are not counted as income for reasons that aren’t clear. That, of course, is missing mostly from the top half of the income distribution. At the low end of the distribution, there’s all sorts of income misreporting. Not terribly large, but there is some, people just don’t report all their income. And in the middle, employer-paid benefits are missing. So, adding all that earned income data made the ratio between the top and bottom much bigger. The top quintile earns 60 times more income than the bottom quintile.

But we’re still missing two-thirds of the transfer payments. If we add all the transfer payments, the difference between the top and bottom drops to 5.7 to 1.

So that’s all the money coming in, but the census also ignores the money the government takes through taxes. If we compare after-tax income and after-transfer payment income, the difference drops to only 4 to 1.

So, we’ve gone from 16.7 to 1 to 4 to 1 after counting all the money. We didn’t have to redefine anything.

Let me hit a couple of other points here.

It’s not only that the difference between the top and the bottom became smaller after adding all the income data and accounting for taxes. The differences between the bottom, the next to the bottom, and the middle virtually disappear. The bottom 60 percent of Americans all have almost the same amount of income. Let me explain that a bit.

Income in the second quintile is only 8 percent larger than in the bottom quintile. And yet there are 2.8 times more people working in second quintile households. And when they work, they work 1.8 times more hours. They work nearly 40 hours, and people in the bottom quintile work less than 20. And in the middle quintile, there is 32 percent more income, but over three times more people are working, and they work more than twice as many hours. They put out a whole lot more effort and don’t get much more income.

Now, there’s another important wrinkle: adjusting households for size. Households in the bottom quintile tend to be single individuals, retired individuals, people who’ve just graduated from college, and so on. Households become larger as you go up the income scale. When you adjust for size, the bottom quintile actually receives 5 percent more income than the second quintile does. And only 7 percent less than the middle.

There’s also the issue of change over time. There’s something called the Gini coefficient. It’s a measure that’s set up so that at zero, you have perfect equality. Every household has the same income. And at 1, all the income is in one household. The census publishes this measure, and it has risen over the long term. When President Obama or Chuck Schumer says income inequality is awful and it’s getting worse, this is what they’re referring to. But they don’t count all the transfer payments, which have gone from being like 10 percent of our federal budget to 75 percent over time. If you count all the transfers and take away the taxes, the Gini coefficient has actually fallen.

There’s also the question of economic mobility. In a previous paper, you found that two-thirds of children reared in the lowest quintile at some point escape to a higher quintile as adults. I don’t think people realize just how economically mobile Americans are.

Your last point there is really important. Almost all income distribution data are a slice in time. So, the statement that “the poor are getting poorer and the rich are getting richer” is just wrong because these categories are not static: people who were poor ten years ago are rich today, and some previously rich folks have fallen into lower income levels. Now, there are studies that track the same people through time, and during one’s lifetime, you generally move up. Almost everyone’s income goes up, except for those who choose not to participate in the labor force. Although their income goes up too because we keep raising the transfer payments.

The same also applies to income groups. In 1967, the top quintile of households were those that made around $60,000 or more in 2017 dollars. The people in the bottom quintile made between zero and $15,000 in 2017 dollars. In 2017, 77 percent of the population was making incomes that would have placed them in the top quintile 50 years earlier. That’s inflation-adjusted. And fewer than 2 percent of the people in the bottom quintile in 2017 would have been in the bottom quintile 50 years ago. So, throughout the income distribution, we’re all a whole lot better off.

Now, are we better off than five years ago? Well, some of us are, and some of us aren’t, but the overwhelming majority of us are better off than our parents and grandparents were. Far better off.

What is another hopeful fact about the US economy right now that people may not be aware of?

If you measure it right, the share of Americans in poverty has dropped from about 14 percent back when the war on poverty began to 1.1 percent.

So, when Lyndon B. Johnson declared the war on poverty in 1964, the poverty rate had declined from over 30 percent in the 1940s and 50s to around 17 percent. Now, what happened after that? Well, poverty continued to decline at the same rate for another four or five years. Then, it stopped going down and started rising and falling with the business cycle.

Why do you suppose that happened?

Mismeasurement.

Exactly. We declared a war on poverty. We started giving people a lot of money, but we didn’t measure that money as income. And so, it bounced between 11 percent and 15 percent, back and forth, back and forth. It dropped below 11 percent last year, but it’s still in the same range. But if we count all the transfer payments, it’s only 2.5 percent. And if we correct for the CPI overstating inflation, poverty would be less than 2 percent.

So, poverty has virtually disappeared. The people in that 2 percent are people who are especially challenged, either mentally or physically, and they may need help. But most people who are called poor are simply getting lots of money from the government, and they’re not poor anymore.

Johnson had two objectives for the war on poverty. One was to alleviate the suffering of those who were poor, but the other was to enable them to become productive citizens. We completely failed at that one. Only one third of work-age adults in the bottom quintile have a job. Back when Johnson started the war on poverty, two-thirds of them did.

Why? The government’s paying them to do nothing. So, they do nothing.

Get John Early’s book, The Myth of American Inequality: How Government Biases Policy Debate, here.

The Human Progress Podcast | Ep. 55

John Early: Myths About American Inequality

John Early, a mathematical economist and adjunct scholar at the Cato Institute, joins Chelsea Follett to discuss popular misconceptions about inequality in the United States and the measurement errors behind them. To see the slides that accompany the interview, watch the video on YouTube or the Spotify app.