fbpx
01 / 05
American Family Incomes Reach Record High

Blog Post | Economic Growth

American Family Incomes Reach Record High

Despite the narrative of economic decline pushed by some politicians and newspeople, the American family is earning more.

Prevailing wisdom holds that this is a time of stagnating incomes and economic struggle for American families. That is indeed a reality in many homes. But as economist and HumanProgress.org advisory board member Mark Perry recently pointed out, most American families are doing better than the prevailing wisdom might have them believe.

After adjusting for inflation, it turns out that median income for families reached a record high in 2015, the last year for which the U.S. Census Bureau has data. Families that include married couples, particularly those where both spouses participate in the labor force, did even better and also saw their incomes break records in 2015. The Census Bureau defines a family as “a group of two people or more … related by birth, marriage, or adoption and residing together.”

U.S. median income graph

Please note that median family income is not the same thing as median household income, as the latter includes non-family households.  Median household income has been more stagnant. It was 56,516 dollarsin 2015, around 14,000 dollars less than median income for family households. Interestingly, 65 percent of U.S. households were family households in 2016, the most recent year of data.

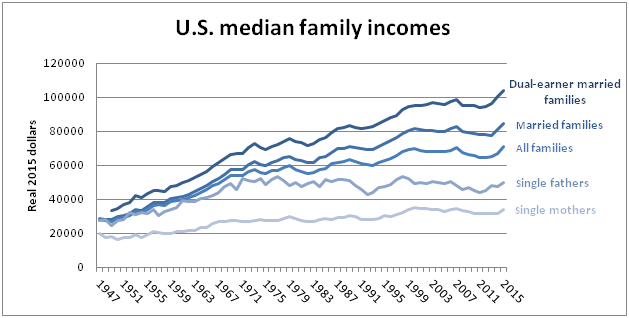
All family types saw a somewhat notable median income uptick in 2015, allowing each type to outperform pre-Great Recession income levels. Of course, some families have done better than others. Families headed by single women (simplified to “single mothers” in the above graph) have seen their incomes rise only slowly, while families headed by single men (“single fathers” in the graph) have seen their incomes essentially stagnate since the 1970s.

However, most families fall into the categories that have made impressive real income gains. 73 percent of family households include married couples, while 19 percent are headed by single women and only 8 percent are headed by single men. Moreover, both spouses now work in over 60 percent of married couple families, placing them in the highest-earning category of family.

The median income for all U.S. families was only 28,144 dollars in 1947, compared to 70,697 dollars in 2015. That is an increase of 151 percent. Again, that is after adjusting for inflation.

So despite the popular narrative of economic decline pushed by some politicians and newspeople, the American family is earning more than ever before recorded.

The first appeared in Cato at Liberty.

MSN | Wealth & Poverty

It Turns Out despite Avocado Toast, Millennial Wealth Is Booming

“A new report from the Center for American Progress, a left-leaning think tank, looked at how wealth changed for different age cohorts from 2019 to 2023 by analyzing data from the Federal Reserve’s Distributional Financial Accounts.

The analysis found good news for the much-beleaguered millennial generation: Their wealth grew at a historic clip.

Per CAP’s analysis, from the end of 2019 to the end of 2023, the average wealth of households under 40 grew by 49% — a $85,000 increase, to $259,000 from $174,000. The analysis said that rate of rapid wealth growth had never happened before in the data series’ history, and it came after wealth growth remained relatively stagnant for young Americans prepandemic.

Here’s the whopper: Wealth gains were even higher for just millennials, who were 23 to 38 in 2019; their wealth doubled from the end of 2019 to 2023.”

From MSN.

The Economist | Wealth & Poverty

Generation Z Is Unprecedentedly Rich

“In America hourly pay growth among 16- to 24-year-olds recently hit 13% year on year, compared with 6% for workers aged 25 to 54. This was the highest ‘young person premium’ since reliable data began (see chart 3). In Britain, where youth pay is measured differently, the average hourly pay of people aged 18-21 rose by an astonishing 15% last year, outstripping pay rises among other age groups by an unusually wide margin. In New Zealand the average hourly pay of people aged 20-24 increased by 10%, compared with an average of 6%.

Strong wage growth boosts family incomes. A new paper by Kevin Corinth of the American Enterprise Institute, a think-tank, and Jeff Larrimore of the Federal Reserve assesses Americans’ household income by generation, after accounting for taxes, government transfers and inflation. Millennials were somewhat better off than Gen X—those born between 1965 and 1980—when they were the same age. Zoomers, however, are much better off than millennials were at the same age. The typical 25-year-old Gen Z-er has an annual household income of over $40,000, more than 50% above baby-boomers at the same age.”

From The Economist.

BusinessMirror | Poverty Rates

PHL Could Hit Single-Digit Poverty Years Ahead of Schedule

“Better labor market conditions and slower inflation in the country could turn the administration’s single-digit poverty incidence aspirations into a reality two years ahead of schedule.

This was according to the latest Macro Poverty Outlook for the Philippines, released by the World Bank on Monday. It estimated that poverty incidence in the country could decrease to 9.3 percent in 2026 from 12.2 percent this year and 17.8 percent in 2021.”

From BusinessMirror.

Blog Post | Economic Growth

Measuring Freedom and Flourishing | Podcast Highlights

Chelsea Follett interviews Leandro Prados de la Escosura about the long term trends in wellbeing, inequality, and freedom.

Listen to the podcast or read the full transcript here.

Let’s discuss your latest book, Human Development and the Path to Freedom.

I have spent many years working on economic performance in the long run, and while I don’t have anything against GDP, I was always uneasy with the idea of using GDP per head as a shortcut for wellbeing. GDP is a good indicator of output but a very deficient indicator of wellbeing.

Most economists say, “This is true, but it’s highly correlated with non-economic dimensions of wellbeing.” There is also a tendency to produce a dashboard of indicators, basically GDP and some additional measures that create a more nuanced picture.

I was unhappy with that. Then I realized that, since the beginning of modern national accounts in the 1950s, there have been attempts to produce alternative measures. More than 30 years ago, the United Nations Development Programme produced the Human Development Index. I was very interested, but at the same time, I was frustrated when I saw that countries with no freedom at all ranked very highly in the index.

For example, in the first report in 1990, they had a retrospect going back to 1975, and I found that Spain, under Franco’s dictatorship, ranked very highly in human development. How come? It wasn’t satisfactory to rank a nasty dictatorship so highly. And then I read the literature accompanying the report and found this very candid assertion: “The purpose of human development is to increase people’s range of choices. If they are not free to make those choices, the entire process becomes a mockery.”

This is an important philosophical point: Human development is not just about living longer or having a higher material standard of living. You can get that in a high-security prison in Norway. Choosing between alternative ways of life is what makes the difference.

To make a long story short, they have tried time and again to introduce freedom, but they never managed to do so because of strong political opposition from country members of the program. So, as an independent scholar, I thought, “Look, nobody is going to read it, but I have the freedom to introduce the freedom dimension.”

Tell me about what you found.

Perhaps what makes sense is to compare what I found to what you would get on the basis of per capita income. If you look at the average increase from 1870 to 2020, the growth in income and wellbeing is very similar.

But if you look closer, you realize there are large differences across different periods. During first globalization before 1913 and between 1970 and 2000, they are relatively close. During the last two decades, the difference is huge in favor of material living standards measured by per capita income. The first part of the 20th century is just the opposite.

What next? Well, try to provide an explanation.

I went in two steps. One was asking, “Why has this growth in human wellbeing happened? What is the intuition?” The intuition is that if you get richer, you’re going to become better fed, healthier, better educated, and freer. But you can also have different levels of wellbeing at the same income level, and the most important finding from a historical perspective is that at any point of income, you have higher wellbeing today than in the past.

If you compare 1870 to 1913, you see that for most of the income levels, you get the same association between health and income, but at high levels of income, you get higher levels of health. Improvements in health techniques and medical knowledge were restricted to the most advanced countries. But if you look at the 1950s, at any income level, you get higher levels of health than in 1913 or 1870. You also find this for education and freedom. If you move to 2000, there is another upward shift.

Of course, there are reversals. There have been four moments in time in which the progression, the positive progression of human development stopped or declined. One was the Great Depression. The second one was during Mao’s Great Leap Forward. Then there were the oil shocks in the early ’70s, but the most damaging one has been COVID. COVID is the first period in which wellbeing measured in terms of augmented human development has declined

However, over the long run, for any income level, whether you are rich or poor, nowadays you have higher wellbeing than in the past.

Those findings are fascinating. What would you say is the biggest implication of your work?

The first thing is that wellbeing, broadly defined, has expanded worldwide more steadily than per capita income.

Secondly, the phases in which we conventionally associate improvements in wellbeing are not necessarily the same as those in which actual wellbeing improved. For instance, there was an important improvement in the so-called interwar period, even though economic growth stagnated. In 20th-century India, before independence, there was a stagnation in real average income but a remarkable improvement in health. This was because of the discovery of the germ theory of disease, which brought simple hygienic practices like washing your hands before eating and not sleeping near animals.

We also tend to forget that the association between wellbeing and income is not fixed. There are movements along the function: if you are richer, other things being equal, you’re going to be healthier, more educated, and freer. But this is not the whole story. There are also upward and downward shifts.

For instance, you could say that in terms of freedom in 2020, we are worse off than we were 20 years ago. This doesn’t mean that people were richer 20 years ago—we’re richer now—but at the same income level, 20 years ago, people were freer than we are today.

So, it’s a nuanced picture. Overall, things are improving, but there are also worrying declines in freedom.

Exactly.

Can you talk about inequality?

In 1870, in the case of wellbeing, inequality was high, and it increased up to the end of the century, then went down. Then, because of World War I, it increased again. But from the late 1920s to the present, with the exception of a reversal because of World War II, there has been a steady decline in inequality of wellbeing.

In the case of per capita income, inequality increased until the end of the 20th century, around 1980, and only began declining after 1990.

Here, I’m referring to relative inequality. If we increase wealth by 10 percent everywhere, inequality in relative terms doesn’t change. Some people are a bit pickier and think, “If my income increases 10 percent and my income is 100, I get 110. If your income is 1000, you now get 1100.” This is absolute inequality.

Relative inequality in per capita income increased until 1980 and has declined since 1990. But absolute inequality in per capita income, the distance between rich and poor, continues growing.

Absolute inequality in wellbeing has declined since 1960. Today, it is similar to what you would find in 1938, 1913, or 1900, but higher than in 1870.

It’s also important to look at what happens to different parts of the distribution. Who are the winners and losers? Broadly speaking, the middle class of the world gained the most, and the lower classes and those at the top won relatively less. If you look at absolute gains, those who were at a higher level of wellbeing got more. But that changes for different dimensions. Those at the bottom, for example, were the main winners in terms of education, while those in the middle were the main winners in terms of health.

I know that your current focus is on freedom. Could you tell me a little bit about that?

I became interested in human development after reading Amartya Sen, who emphasizes what Isaiah Berlin would call positive freedom. Freedom to. But he also emphasizes negative freedom, the absence of coercion and interference. And I think this is interesting because many people think there is a trade-off between negative and positive freedom.

At the end of the day, everybody wants to have negative freedom, but there are those who think negative freedom has nothing to do with income, that would be Hayek, and those who think negative freedom can only be reached as a second stage once you provide for those who don’t have access. For some, positive freedom is a socialist lie to reduce negative freedom. For others, they are two faces of the same coin.

As an economic historian, I find this is an interesting topic for research. If you look at the world, and you can see this in the Human Freedom Index that Cato publishes, you see the countries at the top in terms of negative freedom are also at the top in terms of positive freedom. For instance, Denmark is at the top of the list in terms of economic freedom, but also in terms of education and health.

My question was, well, maybe this trade-off is only a short-run phenomenon. Maybe if you look at the long run, the trade-off doesn’t hold or only holds for a certain period. So why not construct two alternative sets of estimates, one for positive freedom and the other for negative freedom? And this is what I’m trying to do now.

My main discrepancy with the Fraser Institute economic freedom index is that I don’t take into account the size of government. I know this is a contentious issue. People say, “the larger the government, the less room for private initiative.” At a point in time, this is true. And if you look at similarly developed countries, this is true.

But if you take a cross-section at a point in time, you can see that there are countries in which the size of government is much, much smaller, that are not necessarily freer, in terms of absence of coercion and interference, than countries with larger governments. Look at, for instance, Latin American and Sub-Saharan African countries. Think of Somalia. Or think of my own country under Franco. It was a right-wing, but, in many aspects, very socialist dictatorship in which the government was everywhere. But the size of government was very small.

In 1980, do you know what percentage the income tax contributed to the revenues of the central government in Spain? Give me a figure. You would say 40 percent?

Sure, 40 percent.

2 percent.

Wow.

Nobody paid income tax. So, there was no redistribution.

My point is that the size of government matters less than the nature of government. Perhaps Denmark would have more economic freedom with a smaller government, but if you compare Denmark to other countries, you can see that even though the Danish government is larger, Denmark’s degree of economic freedom is higher. Why? Because the nature of government action is different. It doesn’t interfere as much as another government that is less intrusive in quantitative terms but more intrusive in qualitative terms.

So, if you are looking at a point in time, it makes sense to say, “mutatis mutandis, if a rich country nowadays has a smaller government, this country is going to be freer.” That is true. But the action of government varies from one case to another.

Get Leandro Prados de la Escosura’s book, Human Development and the Path to Freedom: 1870 to the Present, here.